Functional analysis
Last updated: November 28, 2023
Section Overview
🕰 Time Estimation: 120 minutes
💬 Learning Objectives:
- Determine how functions are attributed to genes using Gene Ontology terms
- Describe the theory of how functional enrichment tools yield statistically enriched functions or interactions
- Discuss functional analysis using over-representation analysis, functional class scoring, and pathway topology methods
- Identify popular functional analysis tools for over-representation analysis
The output of RNA-seq differential expression analysis is a list of significant differentially expressed genes (DEGs). To gain greater biological insight on the differentially expressed genes there are various analyses that can be done:
- determine whether there is enrichment of known biological functions, interactions, or pathways
- identify genes' involvement in novel pathways or networks by grouping genes together based on similar trends
- use global changes in gene expression by visualizing all genes being significantly up- or down-regulated in the context of external interaction data
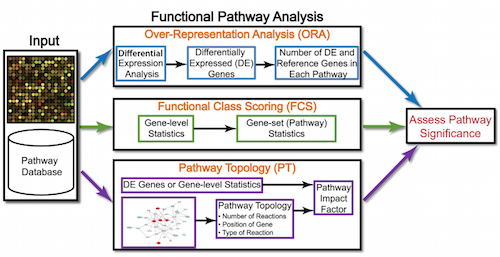
Generally for any differential expression analysis, it is useful to interpret the resulting gene lists using freely available web- and R-based tools. While tools for functional analysis span a wide variety of techniques, they can loosely be categorized into three main types: over-representation analysis, functional class scoring, and pathway topology. See more here.
The goal of functional analysis is to provide biological insight, so it's necessary to analyze our results in the context of our experimental hypothesis: What is the function of the genes dysregulated by Vampirium?. Therefore, based on the authors' hypothesis and observations, we may expect the enrichment of processes/pathways related to blood production and behaviour control, which we would need to validate experimentally.
Note
All tools described below are great tools to validate experimental results and to make hypotheses. These tools suggest genes/pathways that may be involved with your condition of interest; however, you should NOT use these tools to make conclusions about the pathways involved in your experimental process. You will need to perform experimental validation of any suggested pathways.
Over-representation analysis
There are a plethora of functional enrichment tools that perform some type of "over-representation" analysis by querying databases containing information about gene function and interactions.
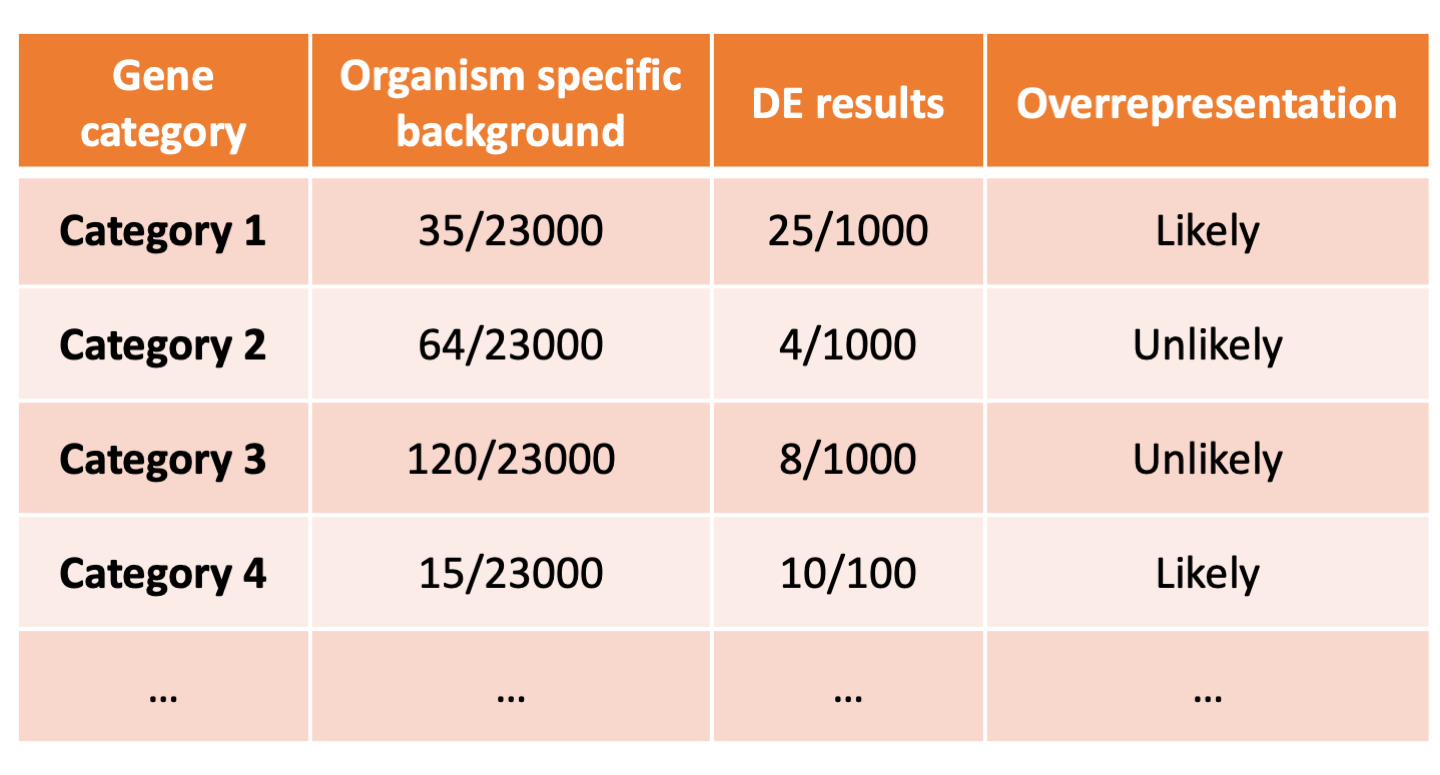
These databases typically categorize genes into groups (gene sets) based on shared function, or involvement in a pathway, or presence in a specific cellular location, or other categorizations, e.g. functional pathways, etc. Essentially, known genes are binned into categories that have been consistently named (controlled vocabulary) based on how the gene has been annotated functionally. These categories are independent of any organism, however each organism has distinct categorizations available.
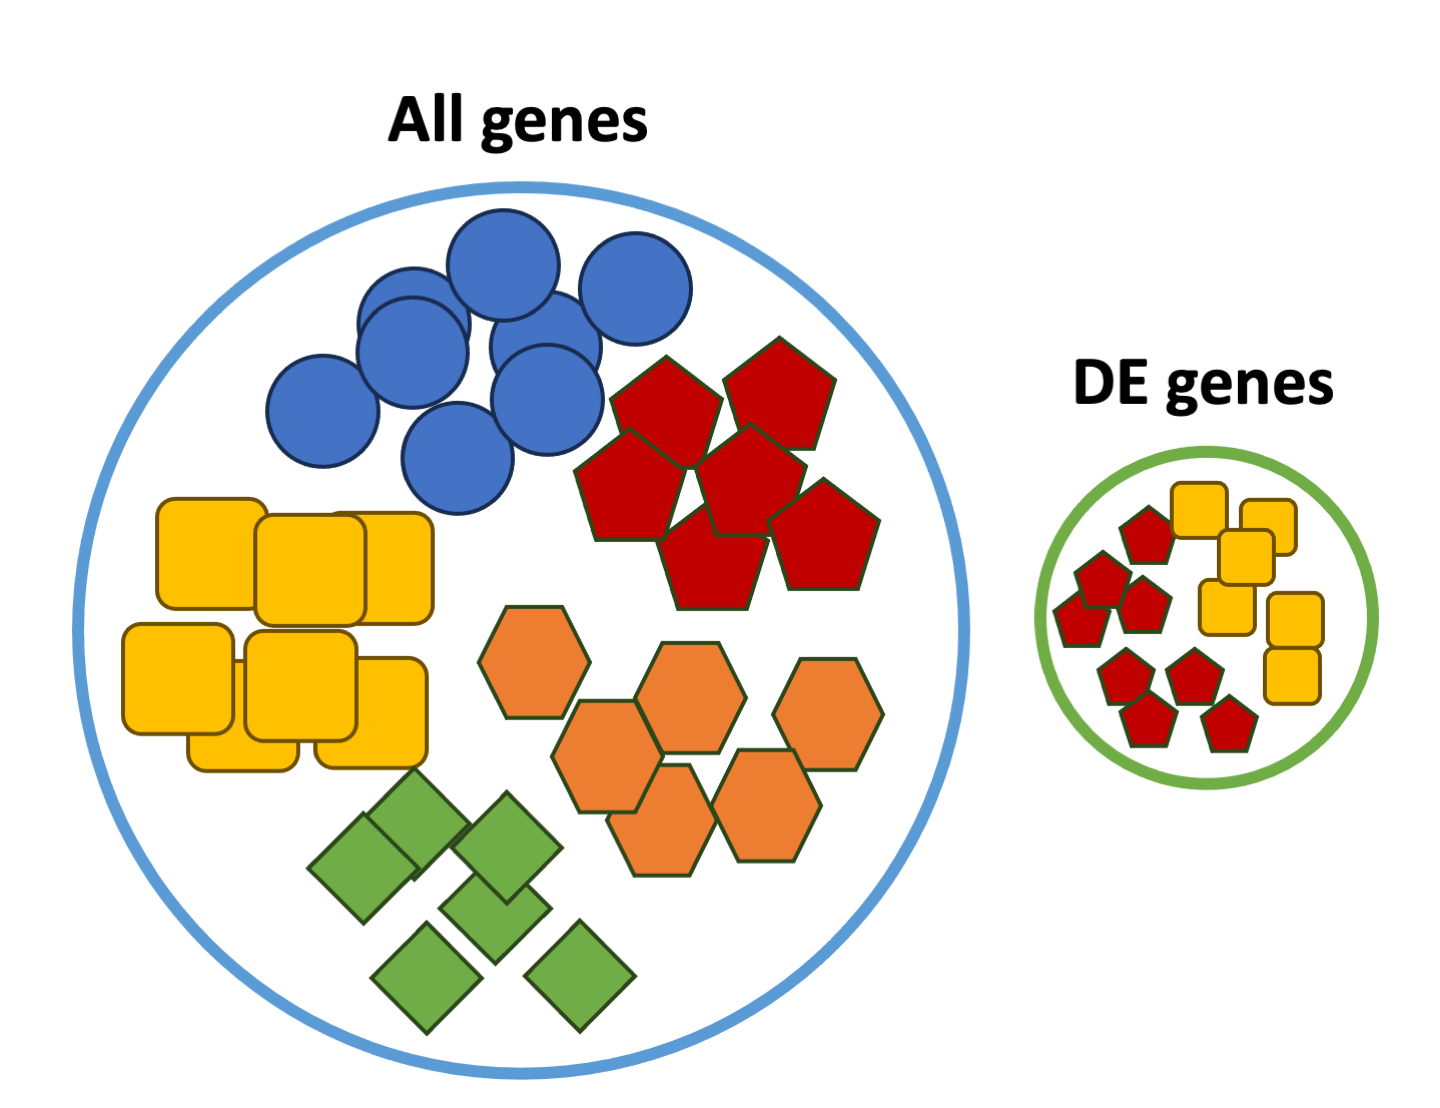
To determine whether any categories are over-represented, you can determine the probability of having the observed proportion of genes associated with a specific category in your gene list based on the proportion of genes associated with the same category in the background set (gene categorizations for the appropriate organism).
The statistical test that will determine whether something is actually over-represented is the Hypergeometric test.
Hypergeometric testing
Using the example of the first functional category above, hypergeometric distribution is a probability distribution that describes the probability of 25 genes (k) being associated with "Functional category 1", for all genes in our gene list (n=1000), from a population of all of the genes in entire genome (N=23,000) which contains 35 genes (K) associated with "Functional category 1" [4].

The calculation of probability of k successes follows the formula:
\(\(Pr(X = k) = \frac{\binom{K}{k} \binom{N - K}{n-k}}{\binom{N}{n}}\)\) 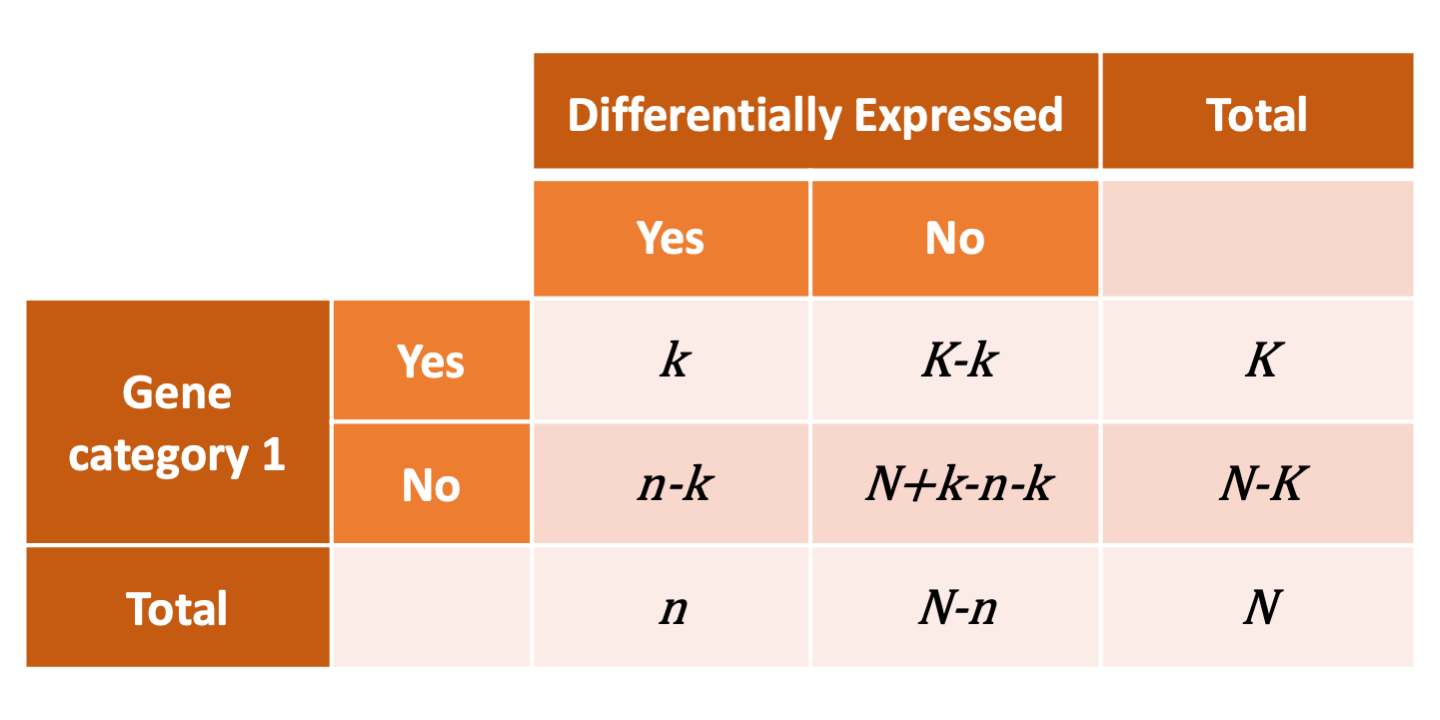
This test will result in an adjusted p-value (after multiple test correction) for each category tested.
Gene Ontology project
One of the most widely-used categorizations is the Gene Ontology (GO) established by the Gene Ontology project.
Quote
"The Gene Ontology project is a collaborative effort to address the need for consistent descriptions of gene products across databases".
The Gene Ontology Consortium maintains the GO terms, and these GO terms are incorporated into gene annotations in many of the popular repositories for animal, plant, and microbial genomes.
Tools that investigate enrichment of biological functions or interactions often use the Gene Ontology (GO) categorizations, i.e. the GO terms to determine whether any have significantly modified representation in a given list of genes. Therefore, to best use and interpret the results from these functional analysis tools, it is helpful to have a good understanding of the GO terms themselves and their organization.
GO Ontologies
To describe the roles of genes and gene products, GO terms are organized into three independent controlled vocabularies (ontologies) in a species-independent manner:
- Biological process: refers to the biological role involving the gene or gene product, and could include "transcription", "signal transduction", and "apoptosis". A biological process generally involves a chemical or physical change of the starting material or input.
- Molecular function: represents the biochemical activity of the gene product, such activities could include "ligand", "GTPase", and "transporter".
- Cellular component: refers to the location in the cell of the gene product. Cellular components could include "nucleus", "lysosome", and "plasma membrane".
Each GO term has a term name (e.g. DNA repair) and a unique term accession number (<0005125>), and a single gene product can be associated with many GO terms, since a single gene product "may function in several processes, contain domains that carry out diverse molecular functions, and participate in multiple alternative interactions with other proteins, organelles or locations in the cell". See more here.
GO term hierarchy
Some gene products are well-researched, with vast quantities of data available regarding their biological processes and functions. However, other gene products have very little data available about their roles in the cell.
For example, the protein, "p53", would contain a wealth of information on it's roles in the cell, whereas another protein might only be known as a "membrane-bound protein" with no other information available.
The GO ontologies were developed to describe and query biological knowledge with differing levels of information available. To do this, GO ontologies are loosely hierarchical, ranging from general, 'parent', terms to more specific, 'child' terms. The GO ontologies are "loosely" hierarchical since 'child' terms can have multiple 'parent' terms.
Some genes with less information may only be associated with general 'parent' terms or no terms at all, while other genes with a lot of information be associated with many terms.
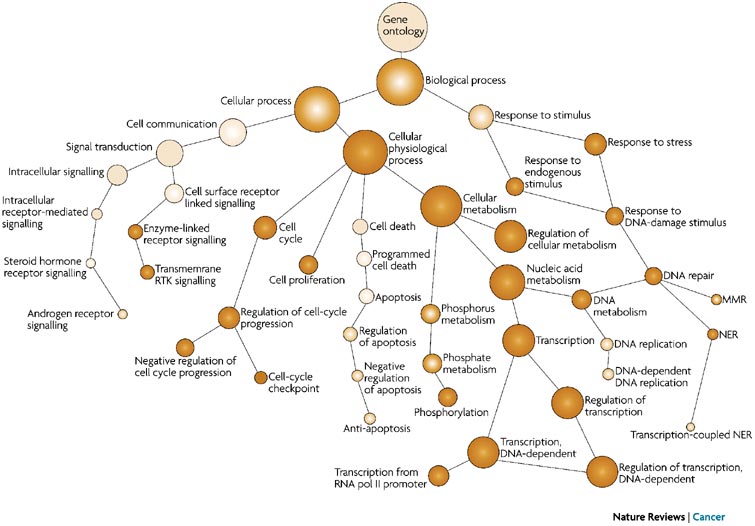
From Nature Reviews Cancer 7, 23-34 (January 2007)
Tip
More tips for working with GO can be found here
clusterProfiler
We will be using clusterProfiler to perform over-representation analysis on GO terms associated with our list of significant genes. The tool takes as input a significant gene list and a background gene list and performs statistical enrichment analysis using hypergeometric testing. The basic arguments allow the user to select the appropriate organism and GO ontology (BP, CC, MF) to test.
Running clusterProfiler
To run clusterProfiler GO over-representation analysis, we will change our gene names into Ensembl IDs, since the tool works a bit easier with the Ensembl IDs. Then load the following libraries:
To perform the over-representation analysis, we need a list of background genes and a list of significant genes. For our background dataset we will use all genes tested for differential expression (all genes in our results table). For our significant gene list we will use genes with p-adjusted values less than 0.05 (we could include a fold change threshold too if we have many DE genes).
## Create background dataset for hypergeometric testing using all genes tested for significance in the results
allCont_genes <- dplyr::filter(res_ids, !is.na(gene)) %>%
  pull(gene) %>%
  as.character()

## Extract significant results
sigCont <- dplyr::filter(res_ids, padj < 0.05 & !is.na(gene))

sigCont_genes <- sigCont %>%
  pull(gene) %>%
  as.character()
Now we can perform the GO enrichment analysis and save the results:
## Run GO enrichment analysis
ego <- enrichGO(gene = sigCont_genes,
                universe = allCont_genes,
                keyType = "ENSEMBL",
                OrgDb = org.Hs.eg.db,
                ont = "BP",
                pAdjustMethod = "BH",
                qvalueCutoff = 0.05,
                readable = TRUE)
Note
The different organisms with annotation databases available to use with for the OrgDb argument can be found here.
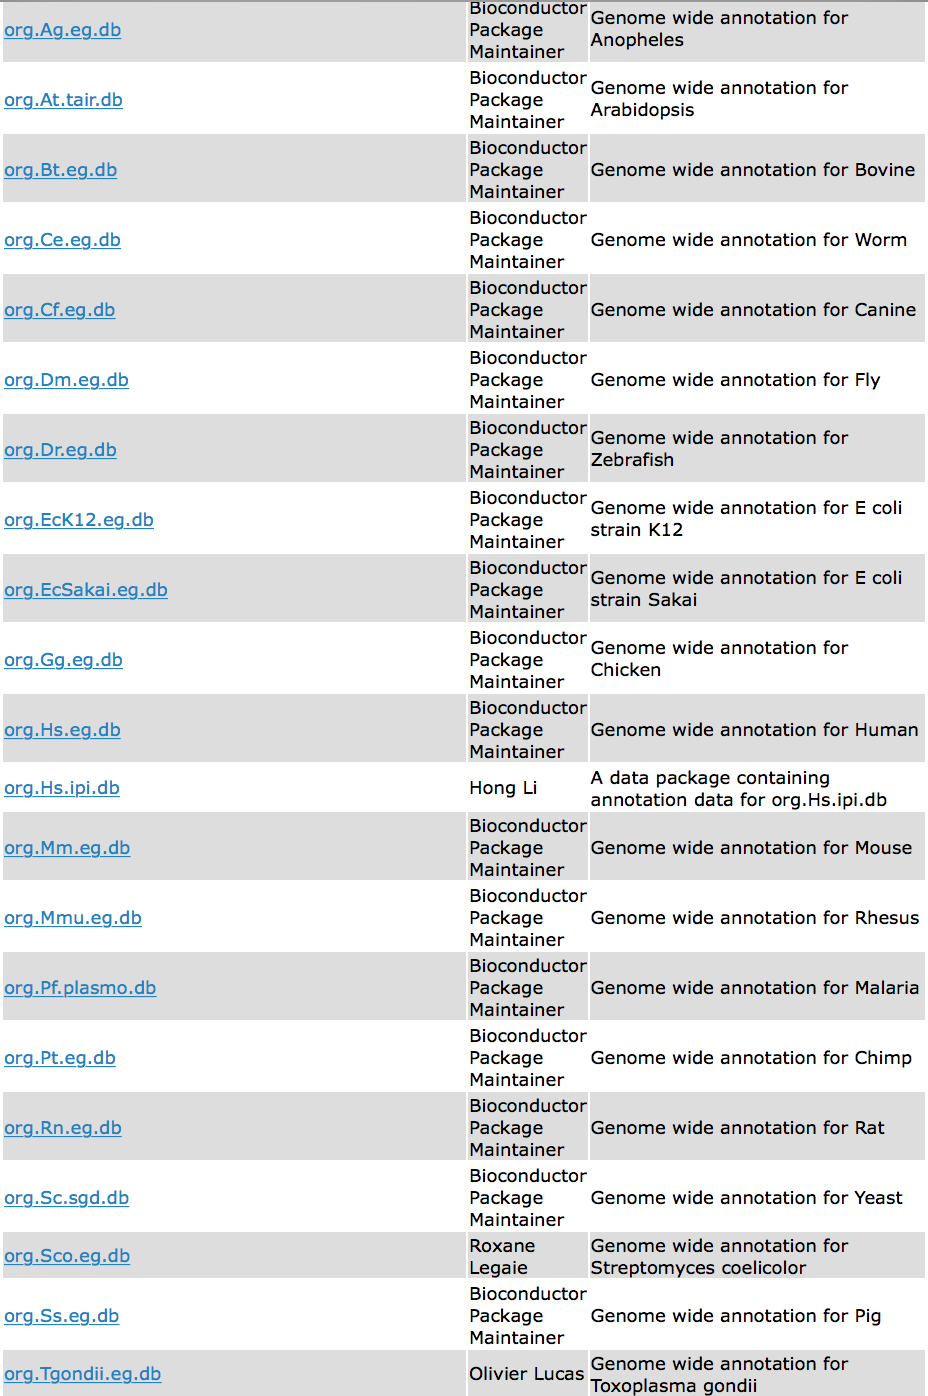
Also, the keyType argument may be coded as keytype in different versions of clusterProfiler.
Finally, the ont argument can accept either "BP" (Biological Process), "MF" (Molecular Function), and "CC" (Cellular Component) subontologies, or "ALL" for all three.
## Output results from GO analysis to a table
cluster_summary <- data.frame(ego)
cluster_summary

write.csv(cluster_summary, "../Results/clusterProfiler_Cont-Vamp.csv")
| ID | Description | GeneRatio | BgRatio | pvalue | p.adjust | qvalue | geneID | Count |
|---|---|---|---|---|---|---|---|---|
| GO:0002449 | lymphocyte mediated immunity | 259/3662 | 436/15509 | 3.55473e-59 | 2.20322e-55 | 1.32498e-55 | BTK/HFE/CD74/SLAMF7/TNFRSF1B/PARP3/FOXP3/FCGR2B/TBX21/MLH1/IL4R/PTPRC/P2RX7/ICAM1/MSH2/IL12RB1/GZMB/CD40/SMAD7/TLR8/CD40LG/IL21R/NBN/FCER2/LILRB1/IL27RA/CLC/TGFB1/AHR/EXOSC3/GATA3/PPP3CB/C1QBP/NSD2/CTSC/HPX/CD81/AICDA/IL12B/IL4/BCL6/CD160/PRDX1/ARG1/CLU/SHLD2/IL1B/CD70/C3/FOXJ1/NECTIN2/ULBP2/NDFIP1/ARL8B/IL6/IL10/IL21/SLC15A4/ARRB2/LYST/IL18/MR1/CD96/CD8A/CD1A/CD1C/CD1B/TNFSF13/PRKCD/MBL2/NOD2/KIR3DL1/FADD/INPP5D/LGALS9/SERPINB9/KIF5B/STAT5B/LIG4/LEP/CD19/CD28/HLA-DQB1/PRF1/MICA/BTN3A2/LILRB4/CARD9/ZP3/KIR2DL4/HMGB1/TUBB/CD55/HLA-DQA1/CR1/HLA-DOA/TAP2/TNF/HLA-E/HLA-G/TAP2/HLA-DQB1/TAP2/HLA-DQA1/HLA-DQB1/HLA-DQA1/HLA-DRA/TNF/HLA-B/HLA-E/HLA-A/HLA-A/HLA-G/HLA-DPB1/TAP2/HLA-B/HLA-DQA1/NCR3/HLA-DPB1/LTA/TNF/HLA-A/HLA-A/HLA-B/HLA-DQA1/HLA-E/NCR3/HLA-DQB1/HLA-DQA1/TAP2/LTA/HLA-DPB1/HLA-A/HLA-DRA/HLA-DQA1/TNF/TAP2/TNF/HLA-B/TNF/HLA-DRA/HLA-A/HLA-E/HLA-DPB1/TNF/HLA-E/LTA/HLA-G/HLA-DPB1/HLA-DPB1/HLA-DRB4/MICA/HLA-DQB1/HLA-DPA1/LTA/HLA-DQA1/HLA-A/HLA-DQB1/HLA-DQA1/HLA-B/TAP2/TNF/MICA/HLA-G/HLA-DQA1/HLA-DQB1/HLA-E/HLA-DRA/MICA/HLA-G/HLA-A/HLA-G/NCR3/HLA-DQA1/HLA-E/HLA-DPB1/NCR3/NCR3/HLA-G/HLA-DQA1/TAP2/HLA-DPB1/NCR3/LTA/HLA-DQA1/PTPRC/KIR2DL4/B2M/KIR3DL1/KIR3DL1/KIR2DL4/KIR2DL4/KIR2DL4/KIR2DL4/LILRB1/KIR3DL1/KIR2DL4/KIR3DL1/KIR2DL4/KIR2DL4/KIR3DL1/KIR2DL4/KIR2DL4/KIR3DL1/KIR3DL1/KIR3DL1/KIR2DL4/KIR2DL4/KIR3DL1/KIR2DL4/LILRB4/KIR2DL4/HLA-G/KIR3DL1/KIR3DL1/KIR3DL1/LILRB1/KIR3DL1/KIR2DL4/KIR2DL4/KIR2DL4/LILRB1/KIR3DL1/HLA-DRA/KIR2DL4/KIR2DL4/KIR2DL4/KIR2DL4/LILRB1/KIR2DL4/KIR2DL4/KIR3DL1/KIR2DL4/KIR2DL4/LILRB4/KIR3DL1/KIR2DL4/LILRB4/KIR2DL4/KIR3DL1/INPP5D/KIR3DL1/KIR3DL1/KIR3DL1/KIR2DL4/KIR3DL1/KIR2DL4/KIR2DL4/KIR2DL4/KIR3DL1/KIR3DL1/KIR2DL4/KIR2DL4/KIR3DL1/KIR2DL4/KIR2DL4/KIR2DL4/KIR2DL4/KIR3DL1 | 259 |
| GO:0001906 | cell killing | 180/3662 | 281/15509 | 6.369e-48 | 1.97375e-44 | 1.18698e-44 | TYROBP/LTF/SLAMF7/SPI1/FCGR2B/STXBP2/PTPRC/CD59/P2RX7/ICAM1/LYZ/HSP90AB1/IL12RB1/CTSG/GZMB/FCER2/LILRB1/HAMP/MAPK8/PPP3CB/CTSC/IFNG/IL12B/IL4/GNLY/CD160/PRDX1/ARG1/SEMG1/H2BC11/C3/NECTIN2/ULBP2/ARL8B/IL21/ARRB2/LYST/IL18/MR1/CD1A/CD1C/CD1B/SYK/KIR3DL1/FADD/CX3CR1/LGALS9/ITGAM/SERPINB9/KIF5B/BCL2L1/STAT5B/LEP/F2/PRF1/MICA/KIR2DL4/TUBB/CD55/ELANE/HMGN2/TAP2/HLA-E/HLA-G/TAP2/TAP2/HLA-DRA/HLA-B/HLA-E/HLA-A/HLA-A/HLA-G/TAP2/HLA-B/NCR3/HLA-A/HLA-A/HLA-B/HLA-E/NCR3/TAP2/HLA-A/HLA-DRA/TAP2/HLA-B/HLA-DRA/HLA-A/HLA-E/HLA-E/HLA-G/MICA/HLA-A/HLA-B/TAP2/MICA/HLA-G/HLA-E/HLA-DRA/MICA/HLA-G/HLA-A/HLA-G/NCR3/HLA-E/NCR3/NCR3/HLA-G/TAP2/NCR3/PTPRC/KIR2DL4/B2M/KIR3DL1/KIR3DL1/KIR2DL4/KIR2DL4/KIR2DL4/KIR2DL4/LILRB1/KIR3DL1/KIR2DL4/KIR3DL1/KIR2DL4/KIR2DL4/KIR3DL1/KIR2DL4/KIR2DL4/KIR3DL1/KIR3DL1/KIR3DL1/KIR2DL4/KIR2DL4/KIR3DL1/KIR2DL4/KIR2DL4/HLA-G/KIR3DL1/KIR3DL1/KIR3DL1/LILRB1/KIR3DL1/KIR2DL4/KIR2DL4/KIR2DL4/LILRB1/KIR3DL1/HLA-DRA/KIR2DL4/KIR2DL4/KIR2DL4/ELANE/KIR2DL4/LILRB1/KIR2DL4/KIR2DL4/KIR3DL1/KIR2DL4/KIR2DL4/KIR3DL1/KIR2DL4/KIR2DL4/KIR3DL1/KIR3DL1/KIR3DL1/KIR3DL1/KIR2DL4/KIR3DL1/KIR2DL4/KIR2DL4/KIR2DL4/KIR3DL1/KIR3DL1/KIR2DL4/KIR2DL4/KIR3DL1/KIR2DL4/KIR2DL4/KIR2DL4/KIR2DL4/KIR3DL1 | 180 |
| GO:1903039 | positive regulation of leukocyte cell-cell adhesion | 196/3662 | 320/15509 | 1.02609e-47 | 2.1199e-44 | 1.27487e-44 | BAD/SELE/CD4/IGF1/CD74/RUNX3/CD44/ARID1B/FOXP3/AP3D1/RHOA/CBFB/GLI2/ACTB/IL4R/PTPRC/IL12RB1/ABL1/SMARCB1/XBP1/CD40LG/NFAT5/PYCARD/CSK/IL7/LILRB1/IL27RA/JAK3/GATA3/MAP3K8/ZMIZ1/SMARCD2/CCL2/EFNB3/ZBTB16/CD5/MDK/CD81/IFNG/IL12B/IL4/BCL6/CD86/HES1/IL1A/ZAP70/ITGA4/IGFBP2/CD160/ARID1A/MYB/FOXO3/NR4A3/GPAM/CD80/SOX4/IL1B/TNFSF9/CD70/CCR7/EPO/RARA/FLOT2/AP3B1/PTPN22/IL2RA/IL6/HLX/CCL21/IL21/SLC7A1/ABL2/DUSP10/IL2RG/IL18/RUNX1/TNFRSF13C/ICOSLG/ITGB2/VCAM1/TGFBR2/SPTA1/SHH/SYK/BRD7/RAG1/NOD2/FADD/RHOH/LGALS9/PTAFR/CCL19/KAT5/RELA/STAT5B/SELP/LEP/CD28/PTPN11/HLA-DQB1/KLHL25/IRAK1/SOCS1/LILRB4/ZP3/ARID2/HMGB1/CD55/FUT4/HLA-DQA1/CD47/SRC/ELANE/DPP4/PDCD1LG2/PNP/CR1/HLA-DOA/TNF/HLA-E/HLA-G/HLA-DQB1/HLA-DQA1/HLA-DQB1/HLA-DQA1/HLA-DRA/TNF/HLA-E/HLA-A/HLA-A/HLA-G/HLA-DPB1/HLA-DQA1/HLA-DPB1/TNF/HLA-A/HLA-A/HLA-DQA1/HLA-E/HLA-DQB1/HLA-DQA1/HLA-DPB1/HLA-A/HLA-DRA/HLA-DQA1/TNF/TNF/TNF/HLA-DRA/HLA-A/HLA-E/HLA-DPB1/TNF/HLA-E/HLA-G/HLA-DPB1/HLA-DPB1/HLA-DRB4/HLA-DQB1/HLA-DPA1/HLA-DQA1/HLA-A/HLA-DQB1/HLA-DQA1/TNF/HLA-G/HLA-DQA1/HLA-DQB1/HLA-E/HLA-DRA/HLA-G/HLA-A/HLA-G/HLA-DQA1/HLA-E/HLA-DPB1/HLA-G/HLA-DQA1/HLA-DPB1/HLA-DQA1/PTPRC/CCL5/CD24/B2M/CCL5/LILRB1/SMARCB1/LILRB4/HLA-G/LILRB1/LILRB1/HLA-DRA/ELANE/LILRB1/LILRB4/LILRB4 | 196 |
| GO:0001909 | leukocyte mediated cytotoxicity | 163/3662 | 243/15509 | 1.80678e-47 | 2.79961e-44 | 1.68363e-44 | TYROBP/SLAMF7/SPI1/FCGR2B/STXBP2/PTPRC/P2RX7/ICAM1/IL12RB1/CTSG/GZMB/LILRB1/PPP3CB/CTSC/IL12B/CD160/PRDX1/ARG1/NECTIN2/ULBP2/ARL8B/IL21/ARRB2/LYST/IL18/MR1/CD1A/CD1C/CD1B/KIR3DL1/FADD/CX3CR1/LGALS9/ITGAM/SERPINB9/KIF5B/STAT5B/LEP/F2/PRF1/MICA/KIR2DL4/TUBB/ELANE/TAP2/HLA-E/HLA-G/TAP2/TAP2/HLA-DRA/HLA-B/HLA-E/HLA-A/HLA-A/HLA-G/TAP2/HLA-B/NCR3/HLA-A/HLA-A/HLA-B/HLA-E/NCR3/TAP2/HLA-A/HLA-DRA/TAP2/HLA-B/HLA-DRA/HLA-A/HLA-E/HLA-E/HLA-G/MICA/HLA-A/HLA-B/TAP2/MICA/HLA-G/HLA-E/HLA-DRA/MICA/HLA-G/HLA-A/HLA-G/NCR3/HLA-E/NCR3/NCR3/HLA-G/TAP2/NCR3/PTPRC/KIR2DL4/B2M/KIR3DL1/KIR3DL1/KIR2DL4/KIR2DL4/KIR2DL4/KIR2DL4/LILRB1/KIR3DL1/KIR2DL4/KIR3DL1/KIR2DL4/KIR2DL4/KIR3DL1/KIR2DL4/KIR2DL4/KIR3DL1/KIR3DL1/KIR3DL1/KIR2DL4/KIR2DL4/KIR3DL1/KIR2DL4/KIR2DL4/HLA-G/KIR3DL1/KIR3DL1/KIR3DL1/LILRB1/KIR3DL1/KIR2DL4/KIR2DL4/KIR2DL4/LILRB1/KIR3DL1/HLA-DRA/KIR2DL4/KIR2DL4/KIR2DL4/ELANE/KIR2DL4/LILRB1/KIR2DL4/KIR2DL4/KIR3DL1/KIR2DL4/KIR2DL4/KIR3DL1/KIR2DL4/KIR2DL4/KIR3DL1/KIR3DL1/KIR3DL1/KIR3DL1/KIR2DL4/KIR3DL1/KIR2DL4/KIR2DL4/KIR2DL4/KIR3DL1/KIR3DL1/KIR2DL4/KIR2DL4/KIR3DL1/KIR2DL4/KIR2DL4/KIR2DL4/KIR2DL4/KIR3DL1 | 163 |
| GO:0022409 | positive regulation of cell-cell adhesion | 214/3662 | 367/15509 | 4.54498e-47 | 5.63396e-44 | 3.38816e-44 | BAD/SELE/CD4/IGF1/CD74/RUNX3/CD44/ARID1B/FOXP3/PTPRU/AP3D1/RHOA/CBFB/GLI2/ACTB/IL4R/PTPRC/CEACAM6/IL12RB1/ABL1/SMARCB1/XBP1/CTSG/BMP7/SMAD7/CD40LG/NFAT5/PIEZO1/PYCARD/CSK/TJP1/IL7/LILRB1/IL27RA/JAK3/GATA3/MAP3K8/ZMIZ1/SMARCD2/CCL2/EFNB3/ZBTB16/CD5/MDK/CD81/IFNG/IL12B/IL4/BCL6/CD86/WNT5A/HES1/IL1A/ZAP70/ITGA4/IGFBP2/CD160/ARID1A/MYB/FOXO3/NR4A3/GPAM/CD80/SOX4/IL1B/TNFSF9/CD70/CCR7/PODXL/EPO/RARA/FLOT2/AP3B1/PTPN22/IL2RA/ADAM19/IL6/HLX/IL10/CCL21/IL21/SLC7A1/ABL2/DUSP10/IL2RG/IL18/CXCL13/NODAL/DMTN/RUNX1/TNFRSF13C/ICOSLG/ITGB2/JAK1/VCAM1/TGFBR2/SPTA1/SHH/SYK/BRD7/RAG1/NOD2/FADD/RHOH/LGALS9/PTAFR/FGG/FGA/CCL19/KAT5/RELA/STAT5B/SELP/LEP/CD28/PTPN11/HLA-DQB1/KLHL25/IRAK1/SOCS1/LILRB4/ZP3/ARID2/HMGB1/CD55/FUT4/HLA-DQA1/CD47/SRC/ELANE/DPP4/PDCD1LG2/PNP/CR1/HLA-DOA/TNF/HLA-E/HLA-G/HLA-DQB1/HLA-DQA1/HLA-DQB1/HLA-DQA1/HLA-DRA/TNF/HLA-E/HLA-A/HLA-A/HLA-G/HLA-DPB1/HLA-DQA1/HLA-DPB1/TNF/HLA-A/HLA-A/HLA-DQA1/HLA-E/HLA-DQB1/HLA-DQA1/HLA-DPB1/HLA-A/HLA-DRA/HLA-DQA1/TNF/TNF/TNF/HLA-DRA/HLA-A/HLA-E/HLA-DPB1/TNF/HLA-E/HLA-G/HLA-DPB1/HLA-DPB1/HLA-DRB4/HLA-DQB1/HLA-DPA1/HLA-DQA1/HLA-A/HLA-DQB1/HLA-DQA1/TNF/HLA-G/HLA-DQA1/HLA-DQB1/HLA-E/HLA-DRA/HLA-G/HLA-A/HLA-G/HLA-DQA1/HLA-E/HLA-DPB1/HLA-G/HLA-DQA1/HLA-DPB1/HLA-DQA1/PTPRC/CCL5/CD24/B2M/CCL5/LILRB1/SMARCB1/LILRB4/HLA-G/LILRB1/LILRB1/HLA-DRA/TJP1/ELANE/LILRB1/LILRB4/LILRB4 | 214 |
| GO:0002706 | regulation of lymphocyte mediated immunity | 172/3662 | 268/15509 | 5.39997e-46 | 5.57817e-43 | 3.35461e-43 | BTK/HFE/TNFRSF1B/PARP3/FOXP3/FCGR2B/TBX21/MLH1/PTPRC/P2RX7/MSH2/IL12RB1/CD40/SMAD7/FCER2/LILRB1/IL27RA/CLC/TGFB1/AHR/EXOSC3/GATA3/PPP3CB/NSD2/HPX/CD81/IL12B/IL4/BCL6/CD160/ARG1/SHLD2/IL1B/C3/FOXJ1/NECTIN2/NDFIP1/IL6/IL10/IL21/SLC15A4/ARRB2/IL18/MR1/CD96/CD1A/CD1C/CD1B/TNFSF13/NOD2/FADD/LGALS9/SERPINB9/STAT5B/LEP/CD28/MICA/LILRB4/ZP3/KIR2DL4/HMGB1/CD55/CR1/TAP2/TNF/HLA-E/HLA-G/TAP2/TAP2/HLA-DRA/TNF/HLA-B/HLA-E/HLA-A/HLA-A/HLA-G/TAP2/HLA-B/NCR3/LTA/TNF/HLA-A/HLA-A/HLA-B/HLA-E/NCR3/TAP2/LTA/HLA-A/HLA-DRA/TNF/TAP2/TNF/HLA-B/TNF/HLA-DRA/HLA-A/HLA-E/TNF/HLA-E/LTA/HLA-G/MICA/LTA/HLA-A/HLA-B/TAP2/TNF/MICA/HLA-G/HLA-E/HLA-DRA/MICA/HLA-G/HLA-A/HLA-G/NCR3/HLA-E/NCR3/NCR3/HLA-G/TAP2/NCR3/LTA/PTPRC/KIR2DL4/B2M/KIR2DL4/KIR2DL4/KIR2DL4/KIR2DL4/LILRB1/KIR2DL4/KIR2DL4/KIR2DL4/KIR2DL4/KIR2DL4/KIR2DL4/KIR2DL4/KIR2DL4/LILRB4/KIR2DL4/HLA-G/LILRB1/KIR2DL4/KIR2DL4/KIR2DL4/LILRB1/HLA-DRA/KIR2DL4/KIR2DL4/KIR2DL4/KIR2DL4/LILRB1/KIR2DL4/KIR2DL4/KIR2DL4/KIR2DL4/LILRB4/KIR2DL4/LILRB4/KIR2DL4/KIR2DL4/KIR2DL4/KIR2DL4/KIR2DL4/KIR2DL4/KIR2DL4/KIR2DL4/KIR2DL4/KIR2DL4/KIR2DL4 | 172 |
| GO:0002703 | regulation of leukocyte mediated immunity | 196/3662 | 327/15509 | 1.12955e-45 | 1.00014e-42 | 6.01465e-43 | BTK/HFE/TYROBP/TNFRSF1B/GAB2/PARP3/C12orf4/FOXP3/SPI1/FCGR2B/TBX21/MLH1/STXBP2/IL4R/DDX1/PTPRC/MAVS/P2RX7/ICAM1/MSH2/IL12RB1/CD40/SMAD7/GATA1/FCER2/LILRB1/IL27RA/CLC/TGFB1/JAK3/AHR/EXOSC3/GATA3/PPP3CB/NSD2/HPX/CD81/IL12B/IL4/BCL6/SNX4/CD160/ARG1/VAMP8/SHLD2/IL1B/C3/RAC2/FOXJ1/NECTIN2/NDFIP1/IL6/IL10/STXBP1/TLR4/IL21/SLC15A4/ARRB2/IL18/MR1/CD96/KIT/CD1A/CD1C/CD1B/ITGB2/TNFSF13/TLR3/SYK/NOD2/FADD/CX3CR1/LGALS9/PTAFR/ITGAM/SERPINB9/STAT5B/LEP/CD28/MICA/LILRB4/ZP3/KIR2DL4/HMGB1/CD55/CR1/TAP2/TNF/HLA-E/HLA-G/CD177/TAP2/TAP2/HLA-DRA/TNF/HLA-B/HLA-E/HLA-A/HLA-A/HLA-G/TAP2/HLA-B/NCR3/LTA/TNF/HLA-A/HLA-A/HLA-B/HLA-E/NCR3/TAP2/LTA/HLA-A/HLA-DRA/TNF/TAP2/TNF/HLA-B/TNF/HLA-DRA/HLA-A/HLA-E/TNF/HLA-E/LTA/HLA-G/MICA/LTA/HLA-A/HLA-B/TAP2/TNF/MICA/HLA-G/HLA-E/HLA-DRA/MICA/HLA-G/HLA-A/HLA-G/NCR3/HLA-E/NCR3/NCR3/HLA-G/TAP2/NCR3/LTA/PTPRC/KIR2DL4/B2M/KIR2DL4/KIR2DL4/KIR2DL4/KIR2DL4/LILRB1/KIR2DL4/KIR2DL4/KIR2DL4/KIR2DL4/KIR2DL4/KIR2DL4/KIR2DL4/KIR2DL4/LILRB4/KIR2DL4/HLA-G/LILRB1/KIR2DL4/KIR2DL4/KIR2DL4/LILRB1/HLA-DRA/KIR2DL4/KIR2DL4/KIR2DL4/KIR2DL4/LILRB1/KIR2DL4/KIR2DL4/KIR2DL4/KIR2DL4/LILRB4/KIR2DL4/LILRB4/KIR2DL4/KIR2DL4/KIR2DL4/KIR2DL4/KIR2DL4/KIR2DL4/KIR2DL4/KIR2DL4/KIR2DL4/KIR2DL4/KIR2DL4 | 196 |
| GO:0002440 | production of molecular mediator of immune response | 198/3662 | 336/15509 | 1.49188e-44 | 1.04211e-41 | 6.26706e-42 | BTK/HFE/CD22/CD74/TNFRSF1B/PARP3/FOXP3/TCF3/FCGR2B/TBX21/MLH1/IL4R/DDX1/PTPRC/MAVS/P2RX7/MSH2/XBP1/CD40/SMAD7/CD40LG/ACP5/PYCARD/NBN/LILRB1/IL27RA/CLC/GPI/TGFB1/JAK3/NOD1/EXOSC3/GATA3/NSD2/HPX/CD81/AICDA/IL17A/IL4/IL5/BCL6/CD86/WNT5A/CD160/ARG1/NR4A3/CD244/SHLD2/PKN1/IL1B/NDFIP1/EPHB2/PTPN22/CD36/IL6/IL10/TLR4/IL21/SLC15A4/TMBIM6/IL18/CD96/KIT/NLRX1/TNFSF13/MAPKAPK2/TLR3/SYK/NOD2/LIG4/CD28/HLA-DQB1/LACC1/PRG2/LILRB4/CARD9/KIR2DL4/CD55/TLR7/HLA-DQA1/ELANE/UBE2J1/CR1/HLA-DOA/TNF/HLA-E/HLA-G/HLA-DQB1/HLA-DQA1/HLA-DQB1/HLA-DQA1/HLA-DRA/TNF/HLA-E/HLA-A/HLA-A/HLA-G/HLA-DPB1/HLA-DQA1/HLA-DPB1/TNF/HLA-A/HLA-A/HLA-DQA1/HLA-E/HLA-DQB1/HLA-DQA1/HLA-DPB1/HLA-A/HLA-DRA/HLA-DQA1/TNF/TNF/TNF/HLA-DRA/HLA-A/HLA-E/HLA-DPB1/TNF/HLA-E/HLA-G/HLA-DPB1/HLA-DPB1/HLA-DRB4/HLA-DQB1/HLA-DPA1/HLA-DQA1/HLA-A/HLA-DQB1/HLA-DQA1/TNF/HLA-G/HLA-DQA1/HLA-DQB1/HLA-E/HLA-DRA/HLA-G/HLA-A/HLA-G/HLA-DQA1/HLA-E/HLA-DPB1/HLA-G/HLA-DQA1/HLA-DPB1/PRKDC/HLA-DQA1/PTPRC/KIR2DL4/B2M/KIR2DL4/KIR2DL4/KIR2DL4/KIR2DL4/LILRB1/KIR2DL4/KIR2DL4/KIR2DL4/KIR2DL4/KIR2DL4/KIR2DL4/KIR2DL4/KIR2DL4/LILRB4/KIR2DL4/HLA-G/LILRB1/MIF/KIR2DL4/KIR2DL4/KIR2DL4/LILRB1/HLA-DRA/KIR2DL4/KIR2DL4/KIR2DL4/ELANE/KIR2DL4/LILRB1/KIR2DL4/KIR2DL4/KIR2DL4/KIR2DL4/LILRB4/KIR2DL4/LILRB4/KIR2DL4/GPI/KIR2DL4/KIR2DL4/KIR2DL4/KIR2DL4/KIR2DL4/KIR2DL4/KIR2DL4/KIR2DL4/KIR2DL4/KIR2DL4 | 198 |
| GO:0002697 | regulation of immune effector process | 240/3662 | 445/15509 | 1.51323e-44 | 1.04211e-41 | 6.26706e-42 | BTK/HFE/TYROBP/CD22/CD74/TNFRSF1B/GRN/GAB2/PARP3/C12orf4/FOXP3/SPI1/FCGR2B/TBX21/MLH1/STXBP2/IL4R/DDX1/PTPRC/CD59/MAVS/P2RX7/ICAM1/MSH2/IL12RB1/XBP1/CD40/SMAD7/GATA1/CD40LG/ACP5/PYCARD/FCER2/LILRB1/IL27RA/CLC/GPI/TGFB1/JAK3/NOD1/AHR/EXOSC3/GATA3/PPP3CB/C1QBP/NSD2/HPX/CD81/IFNG/IL17A/IL12B/IL4/IL5/BCL6/CD86/WNT5A/SNX4/CD160/MYB/ARG1/VAMP8/NR4A3/CD80/CD244/SHLD2/PKN1/IL1B/C3/RAC2/FOXJ1/NECTIN2/NDFIP1/RARA/EPHB2/PTPN22/CD36/IL6/HLX/IL10/STXBP1/TLR4/IRF4/DDX60/IL21/SLC15A4/TMBIM6/ARRB2/DUSP10/IL18/MR1/CD96/KIT/APPL1/CD1A/CD1C/CD1B/ITGB2/NLRX1/TNFSF13/MAPKAPK2/TLR3/SYK/MBL2/NOD2/FADD/CX3CR1/LGALS9/PTAFR/ITGAM/SERPINB9/CCL19/STAT5B/LEP/A2M/CD28/LACC1/MICA/PRG2/LILRB4/CARD9/ZP3/KIR2DL4/HMGB1/CD55/TLR7/CD47/UBE2J1/CR1/TAP2/TNF/HLA-E/HLA-G/CD177/TAP2/TAP2/HLA-DRA/TNF/HLA-B/HLA-E/HLA-A/HLA-A/HLA-G/TAP2/HLA-B/NCR3/LTA/TNF/HLA-A/HLA-A/HLA-B/HLA-E/NCR3/TAP2/LTA/HLA-A/HLA-DRA/TNF/TAP2/TNF/HLA-B/TNF/HLA-DRA/HLA-A/HLA-E/TNF/HLA-E/LTA/HLA-G/MICA/LTA/HLA-A/HLA-B/TAP2/TNF/MICA/HLA-G/HLA-E/HLA-DRA/MICA/HLA-G/HLA-A/HLA-G/NCR3/HLA-E/NCR3/NCR3/HLA-G/TAP2/NCR3/LTA/PTPRC/KIR2DL4/B2M/KIR2DL4/KIR2DL4/KIR2DL4/KIR2DL4/LILRB1/KIR2DL4/KIR2DL4/KIR2DL4/KIR2DL4/KIR2DL4/KIR2DL4/KIR2DL4/KIR2DL4/LILRB4/KIR2DL4/HLA-G/LILRB1/MIF/KIR2DL4/KIR2DL4/KIR2DL4/LILRB1/HLA-DRA/KIR2DL4/KIR2DL4/KIR2DL4/KIR2DL4/LILRB1/KIR2DL4/KIR2DL4/KIR2DL4/KIR2DL4/LILRB4/KIR2DL4/LILRB4/KIR2DL4/GPI/KIR2DL4/KIR2DL4/KIR2DL4/KIR2DL4/KIR2DL4/KIR2DL4/KIR2DL4/KIR2DL4/KIR2DL4/KIR2DL4 | 240 |
| GO:0002699 | positive regulation of immune effector process | 195/3662 | 332/15509 | 1.37064e-43 | 8.49521e-41 | 5.10887e-41 | BTK/TYROBP/CD74/GAB2/C12orf4/FOXP3/SPI1/TBX21/MLH1/STXBP2/IL4R/DDX1/PTPRC/MAVS/P2RX7/MSH2/IL12RB1/XBP1/CD40/GATA1/PYCARD/FCER2/LILRB1/GPI/TGFB1/NOD1/EXOSC3/GATA3/NSD2/HPX/CD81/IFNG/IL17A/IL12B/IL4/IL5/CD86/WNT5A/SNX4/CD160/MYB/ARG1/VAMP8/NR4A3/CD80/CD244/SHLD2/IL1B/C3/RAC2/NECTIN2/RARA/EPHB2/PTPN22/CD36/IL6/HLX/IL10/STXBP1/TLR4/DDX60/IL21/IL18/MR1/KIT/CD1A/CD1C/CD1B/ITGB2/TNFSF13/MAPKAPK2/TLR3/SYK/MBL2/NOD2/FADD/LGALS9/PTAFR/ITGAM/CCL19/STAT5B/CD28/LACC1/CARD9/ZP3/KIR2DL4/CD55/TLR7/CR1/TAP2/TNF/HLA-E/HLA-G/CD177/TAP2/TAP2/HLA-DRA/TNF/HLA-B/HLA-E/HLA-A/HLA-A/HLA-G/TAP2/HLA-B/NCR3/LTA/TNF/HLA-A/HLA-A/HLA-B/HLA-E/NCR3/TAP2/LTA/HLA-A/HLA-DRA/TNF/TAP2/TNF/HLA-B/TNF/HLA-DRA/HLA-A/HLA-E/TNF/HLA-E/LTA/HLA-G/LTA/HLA-A/HLA-B/TAP2/TNF/HLA-G/HLA-E/HLA-DRA/HLA-G/HLA-A/HLA-G/NCR3/HLA-E/NCR3/NCR3/HLA-G/TAP2/NCR3/LTA/PTPRC/KIR2DL4/B2M/KIR2DL4/KIR2DL4/KIR2DL4/KIR2DL4/LILRB1/KIR2DL4/KIR2DL4/KIR2DL4/KIR2DL4/KIR2DL4/KIR2DL4/KIR2DL4/KIR2DL4/KIR2DL4/HLA-G/LILRB1/MIF/KIR2DL4/KIR2DL4/KIR2DL4/LILRB1/HLA-DRA/KIR2DL4/KIR2DL4/KIR2DL4/KIR2DL4/LILRB1/KIR2DL4/KIR2DL4/KIR2DL4/KIR2DL4/KIR2DL4/KIR2DL4/GPI/KIR2DL4/KIR2DL4/KIR2DL4/KIR2DL4/KIR2DL4/KIR2DL4/KIR2DL4/KIR2DL4/KIR2DL4/KIR2DL4 | 195 |
| GO:0002696 | positive regulation of leukocyte activation | 228/3662 | 418/15509 | 2.03813e-43 | 1.14839e-40 | 6.90622e-41 | BAD/CD38/CD4/BTK/TYROBP/IGF1/CD74/RUNX3/GAB2/ARID1B/FOXP3/AP3D1/KARS1/RHOA/CBFB/TBX21/GLI2/ACTB/MLH1/IL4R/PTPRC/MSH2/IL12RB1/ABL1/SMARCB1/XBP1/CD40/NFATC2/GATA1/CD40LG/PYCARD/CSK/IL7/LILRB1/IL27RA/TGFB1/JAK3/HAMP/EXOSC3/GATA3/MAP3K8/ZMIZ1/SMARCD2/CCL2/EFNB3/NSD2/CTSC/ZBTB16/CD5/MDK/CD81/IFNG/IL12B/IL4/IL5/BCL6/CD86/WNT5A/HES1/SNX4/IL1A/ZAP70/IGFBP2/CD160/MPL/ARID1A/MYB/VAMP8/FOXO3/NR4A3/GPAM/CD80/SHLD2/CDKN1A/SOX4/IL1B/TNFSF9/CD70/CCR7/NECTIN2/EPO/RARA/FLOT2/AP3B1/EPHB2/PTPN22/IL2RA/AKIRIN2/IL6/HLX/IL10/STXBP1/TLR4/CCL21/THBS1/IL21/SLC7A1/ABL2/DUSP10/IL2RG/IL18/MMP14/RUNX1/TNFRSF13C/ICOSLG/ITGB2/TNFSF13/VCAM1/TGFBR2/SPTA1/SHH/SYK/BRD7/RAG1/NOD2/FADD/RHOH/TNIP2/INPP5D/LGALS9/PTAFR/ITGAM/CCL19/KAT5/STAT5B/LEP/CD28/PTPN11/HLA-DQB1/KLHL25/SOCS1/LILRB4/ZP3/ARID2/BLOC1S3/HMGB1/CD55/HLA-DQA1/CD47/SRC/DPP4/PDCD1LG2/PNP/CR1/HLA-DOA/TNF/HLA-E/HLA-G/CD177/CRLF2/HLA-DQB1/HLA-DQA1/HLA-DQB1/HLA-DQA1/HLA-DRA/TNF/HLA-E/HLA-A/HLA-A/HLA-G/HLA-DPB1/HLA-DQA1/HLA-DPB1/TNF/HLA-A/HLA-A/HLA-DQA1/HLA-E/HLA-DQB1/HLA-DQA1/HLA-DPB1/HLA-A/HLA-DRA/HLA-DQA1/TNF/TNF/TNF/HLA-DRA/HLA-A/HLA-E/HLA-DPB1/TNF/HLA-E/HLA-G/HLA-DPB1/HLA-DPB1/HLA-DRB4/HLA-DQB1/HLA-DPA1/HLA-DQA1/HLA-A/HLA-DQB1/HLA-DQA1/TNF/HLA-G/HLA-DQA1/HLA-DQB1/HLA-E/HLA-DRA/HLA-G/HLA-A/HLA-G/HLA-DQA1/HLA-E/HLA-DPB1/HLA-G/HLA-DQA1/HLA-DPB1/CEBPA/PRKDC/HLA-DQA1/PTPRC/CCL5/CD24/B2M/CCL5/LILRB1/SMARCB1/LILRB4/HLA-G/LILRB1/MIF/LILRB1/HLA-DRA/LILRB1/LILRB4/LILRB4/INPP5D | 228 |
| GO:0002228 | natural killer cell mediated immunity | 126/3662 | 173/15509 | 6.04231e-43 | 3.12085e-40 | 1.87683e-40 | SLAMF7/GZMB/LILRB1/IL12B/CD160/PRDX1/NECTIN2/ULBP2/ARL8B/IL21/ARRB2/LYST/IL18/CD96/KIR3DL1/LGALS9/SERPINB9/KIF5B/STAT5B/LEP/MICA/KIR2DL4/TUBB/HLA-E/HLA-G/HLA-B/HLA-E/HLA-A/HLA-A/HLA-G/HLA-B/NCR3/HLA-A/HLA-A/HLA-B/HLA-E/NCR3/HLA-A/HLA-B/HLA-A/HLA-E/HLA-E/HLA-G/MICA/HLA-A/HLA-B/MICA/HLA-G/HLA-E/MICA/HLA-G/HLA-A/HLA-G/NCR3/HLA-E/NCR3/NCR3/HLA-G/NCR3/KIR2DL4/KIR3DL1/KIR3DL1/KIR2DL4/KIR2DL4/KIR2DL4/KIR2DL4/LILRB1/KIR3DL1/KIR2DL4/KIR3DL1/KIR2DL4/KIR2DL4/KIR3DL1/KIR2DL4/KIR2DL4/KIR3DL1/KIR3DL1/KIR3DL1/KIR2DL4/KIR2DL4/KIR3DL1/KIR2DL4/KIR2DL4/HLA-G/KIR3DL1/KIR3DL1/KIR3DL1/LILRB1/KIR3DL1/KIR2DL4/KIR2DL4/KIR2DL4/LILRB1/KIR3DL1/KIR2DL4/KIR2DL4/KIR2DL4/KIR2DL4/LILRB1/KIR2DL4/KIR2DL4/KIR3DL1/KIR2DL4/KIR2DL4/KIR3DL1/KIR2DL4/KIR2DL4/KIR3DL1/KIR3DL1/KIR3DL1/KIR3DL1/KIR2DL4/KIR3DL1/KIR2DL4/KIR2DL4/KIR2DL4/KIR3DL1/KIR3DL1/KIR2DL4/KIR2DL4/KIR3DL1/KIR2DL4/KIR2DL4/KIR2DL4/KIR2DL4/KIR3DL1 | 126 |
| GO:0042267 | natural killer cell mediated cytotoxicity | 125/3662 | 171/15509 | 6.76603e-43 | 3.22584e-40 | 1.93996e-40 | SLAMF7/GZMB/LILRB1/IL12B/CD160/PRDX1/NECTIN2/ULBP2/ARL8B/IL21/ARRB2/LYST/IL18/KIR3DL1/LGALS9/SERPINB9/KIF5B/STAT5B/LEP/MICA/KIR2DL4/TUBB/HLA-E/HLA-G/HLA-B/HLA-E/HLA-A/HLA-A/HLA-G/HLA-B/NCR3/HLA-A/HLA-A/HLA-B/HLA-E/NCR3/HLA-A/HLA-B/HLA-A/HLA-E/HLA-E/HLA-G/MICA/HLA-A/HLA-B/MICA/HLA-G/HLA-E/MICA/HLA-G/HLA-A/HLA-G/NCR3/HLA-E/NCR3/NCR3/HLA-G/NCR3/KIR2DL4/KIR3DL1/KIR3DL1/KIR2DL4/KIR2DL4/KIR2DL4/KIR2DL4/LILRB1/KIR3DL1/KIR2DL4/KIR3DL1/KIR2DL4/KIR2DL4/KIR3DL1/KIR2DL4/KIR2DL4/KIR3DL1/KIR3DL1/KIR3DL1/KIR2DL4/KIR2DL4/KIR3DL1/KIR2DL4/KIR2DL4/HLA-G/KIR3DL1/KIR3DL1/KIR3DL1/LILRB1/KIR3DL1/KIR2DL4/KIR2DL4/KIR2DL4/LILRB1/KIR3DL1/KIR2DL4/KIR2DL4/KIR2DL4/KIR2DL4/LILRB1/KIR2DL4/KIR2DL4/KIR3DL1/KIR2DL4/KIR2DL4/KIR3DL1/KIR2DL4/KIR2DL4/KIR3DL1/KIR3DL1/KIR3DL1/KIR3DL1/KIR2DL4/KIR3DL1/KIR2DL4/KIR2DL4/KIR2DL4/KIR3DL1/KIR3DL1/KIR2DL4/KIR2DL4/KIR3DL1/KIR2DL4/KIR2DL4/KIR2DL4/KIR2DL4/KIR3DL1 | 125 |
| GO:1903037 | regulation of leukocyte cell-cell adhesion | 222/3662 | 405/15509 | 9.49056e-43 | 4.20161e-40 | 2.52677e-40 | BAD/SELE/CD4/HFE/IGF1/CD74/RUNX3/CD44/ARID1B/FOXP3/AP3D1/RHOA/CBFB/FCGR2B/TBX21/GLI2/ACTB/IL4R/ARG2/PTPRC/IL12RB1/ABL1/SMARCB1/XBP1/CTSG/SMAD7/CD40LG/NFAT5/PYCARD/CSK/IL7/LILRB1/IL27RA/JAK3/GATA3/CXCL12/MAP3K8/ZMIZ1/SMARCD2/CCL2/EFNB3/ZBTB16/CD5/MDK/CD81/IFNG/IL12B/IL4/BCL6/CD86/HES1/IL1A/ZAP70/ITGA4/IGFBP2/CD160/ARID1A/MYB/ARG1/FOXO3/NR4A3/GPAM/CD80/SOX4/IL1B/TNFSF9/CD70/CCR7/TWSG1/FOXJ1/EPO/ASS1/NDFIP1/RARA/FLOT2/AP3B1/SFTPD/PTPN22/IL2RA/IL6/HLX/IL10/CCL21/IL21/SLC7A1/ABL2/DUSP10/TNFRSF21/IL2RG/IL18/RUNX1/TNFRSF13C/ICOSLG/ITGB2/VCAM1/TGFBR2/SPTA1/CTLA4/CASP3/SHH/SYK/BRD7/RAG1/NOD2/PRDX2/FADD/RHOH/LGALS9/PTAFR/CEBPB/CCL19/KAT5/RELA/STAT5B/SELP/LEP/GLMN/RAG2/PTPN2/ZDHHC21/CD28/PTPN11/HLA-DQB1/KLHL25/IRAK1/SOCS1/LILRB4/ZP3/ARID2/HMGB1/CD55/FUT4/HLA-DQA1/CD47/SRC/ELANE/DPP4/PDCD1LG2/NRARP/PNP/CR1/HLA-DOA/TNF/HLA-E/HLA-G/HLA-DQB1/HLA-DQA1/HLA-DQB1/HLA-DQA1/HLA-DRA/TNF/HLA-E/HLA-A/HLA-A/HLA-G/HLA-DPB1/HLA-DQA1/HLA-DPB1/TNF/HLA-A/HLA-A/HLA-DQA1/HLA-E/HLA-DQB1/HLA-DQA1/HLA-DPB1/HLA-A/HLA-DRA/HLA-DQA1/TNF/TNF/TNF/HLA-DRA/HLA-A/HLA-E/HLA-DPB1/TNF/HLA-E/HLA-G/HLA-DPB1/HLA-DPB1/HLA-DRB4/HLA-DQB1/HLA-DPA1/HLA-DQA1/HLA-A/HLA-DQB1/HLA-DQA1/TNF/HLA-G/HLA-DQA1/HLA-DQB1/HLA-E/HLA-DRA/HLA-G/HLA-A/HLA-G/HLA-DQA1/HLA-E/HLA-DPB1/HLA-G/HLA-DQA1/HLA-DPB1/HLA-DQA1/PTPRC/CCL5/CD24/B2M/CCL5/LILRB1/SMARCB1/LILRB4/HLA-G/LILRB1/LILRB1/HLA-DRA/ELANE/LILRB1/LILRB4/LILRB4/PTEN/ITCH | 222 |
| GO:0050867 | positive regulation of cell activation | 232/3662 | 433/15509 | 1.93124e-42 | 7.97987e-40 | 4.79896e-40 | BAD/CD38/CD4/BTK/TYROBP/IGF1/CD74/RUNX3/GAB2/ARID1B/FOXP3/AP3D1/KARS1/RHOA/CBFB/TBX21/GLI2/ACTB/MLH1/IL4R/PTPRC/MSH2/IL12RB1/ABL1/SMARCB1/XBP1/CD40/NFATC2/GATA1/CD40LG/PYCARD/CSK/IL7/LILRB1/IL27RA/TGFB1/JAK3/HAMP/EXOSC3/GATA3/ACTA2/MAP3K8/ZMIZ1/SMARCD2/CCL2/EFNB3/NSD2/CTSC/ZBTB16/CD5/MDK/CD81/IFNG/IL12B/IL4/IL5/PDGFRB/BCL6/CD86/WNT5A/HES1/SNX4/IL1A/ZAP70/IGFBP2/CD160/MPL/ARID1A/MYB/VAMP8/FOXO3/NR4A3/GPAM/CD80/SHLD2/CDKN1A/SOX4/IL1B/TNFSF9/CD70/CCR7/SOX15/NECTIN2/EPO/RARA/FLOT2/AP3B1/EPHB2/PTPN22/IL2RA/AKIRIN2/IL6/HLX/IL10/STXBP1/TLR4/CCL21/THBS1/IL21/SLC7A1/ABL2/DUSP10/IL2RG/IL18/MMP14/RUNX1/TNFRSF13C/ICOSLG/ITGB2/TNFSF13/VCAM1/TGFBR2/SPTA1/SHH/SYK/BRD7/RAG1/NOD2/FADD/RHOH/TNIP2/INPP5D/LGALS9/PTAFR/ITGAM/CCL19/KAT5/STAT5B/SELP/LEP/CD28/PTPN11/HLA-DQB1/KLHL25/SOCS1/LILRB4/ZP3/ARID2/BLOC1S3/HMGB1/CD55/HLA-DQA1/CD47/SRC/DPP4/PDCD1LG2/PNP/CR1/HLA-DOA/TNF/HLA-E/HLA-G/CD177/CRLF2/HLA-DQB1/HLA-DQA1/HLA-DQB1/HLA-DQA1/HLA-DRA/TNF/HLA-E/HLA-A/HLA-A/HLA-G/HLA-DPB1/HLA-DQA1/HLA-DPB1/TNF/HLA-A/HLA-A/HLA-DQA1/HLA-E/HLA-DQB1/HLA-DQA1/HLA-DPB1/HLA-A/HLA-DRA/HLA-DQA1/TNF/TNF/TNF/HLA-DRA/HLA-A/HLA-E/HLA-DPB1/TNF/HLA-E/HLA-G/HLA-DPB1/HLA-DPB1/HLA-DRB4/HLA-DQB1/HLA-DPA1/HLA-DQA1/HLA-A/HLA-DQB1/HLA-DQA1/TNF/HLA-G/HLA-DQA1/HLA-DQB1/HLA-E/HLA-DRA/HLA-G/HLA-A/HLA-G/HLA-DQA1/HLA-E/HLA-DPB1/HLA-G/HLA-DQA1/HLA-DPB1/CEBPA/PRKDC/HLA-DQA1/PTPRC/CCL5/CD24/B2M/CCL5/LILRB1/SMARCB1/LILRB4/HLA-G/LILRB1/MIF/LILRB1/HLA-DRA/LILRB1/LILRB4/LILRB4/INPP5D | 232 |
| GO:0007159 | leukocyte cell-cell adhesion | 234/3662 | 439/15509 | 2.64361e-42 | 1.02407e-39 | 6.15857e-40 | BAD/ITGAL/SELE/CD4/HFE/IGF1/CD74/RUNX3/CD44/ARID1B/FOXP3/AP3D1/RHOA/ROCK1/CBFB/FCGR2B/TBX21/GLI2/ADD2/ACTB/IL4R/ARG2/PTPRC/ICAM1/IL12RB1/ABL1/SMARCB1/XBP1/CTSG/BMP7/SMAD7/CD40LG/NFAT5/PYCARD/CSK/IL7/LILRB1/IL27RA/JAK3/GATA3/CXCL12/MAP3K8/ZMIZ1/SMARCD2/CCL2/EFNB3/ZBTB16/CD5/MDK/CD81/IFNG/IL12B/IL4/BCL6/CD86/HES1/IL1A/ZAP70/ITGA4/IGFBP2/CD160/ARID1A/MYB/ARG1/FOXO3/NR4A3/GPAM/CD80/SOX4/IL1B/TNFSF9/CD70/CCR7/RAC2/TWSG1/FOXJ1/EPO/ASS1/NDFIP1/RARA/FLOT2/AP3B1/SFTPD/PTPN22/IL2RA/NT5E/IL6/HLX/IL10/CCL21/IL21/SLC7A1/ABL2/DUSP10/TNFRSF21/MSN/IL2RG/ITGB1/IL18/RUNX1/TNFRSF13C/ICOSLG/ITGB2/VCAM1/TGFBR2/SPTA1/CTLA4/CASP3/SHH/SYK/BRD7/RAG1/NOD2/PRDX2/FADD/CX3CR1/RHOH/LGALS9/PTAFR/CEBPB/CCL19/KAT5/RELA/STAT5B/SELP/LEP/GLMN/RAG2/PTPN2/ZDHHC21/CD28/PTPN11/HLA-DQB1/KLHL25/IRAK1/SOCS1/LILRB4/ZP3/ARID2/HMGB1/CD55/FUT4/HLA-DQA1/CD47/SRC/ELANE/DPP4/PDCD1LG2/NRARP/PNP/CR1/HLA-DOA/TNF/HLA-E/HLA-G/CD177/HLA-DQB1/HLA-DQA1/HLA-DQB1/HLA-DQA1/HLA-DRA/TNF/HLA-E/HLA-A/HLA-A/HLA-G/HLA-DPB1/HLA-DQA1/HLA-DPB1/TNF/HLA-A/HLA-A/HLA-DQA1/HLA-E/HLA-DQB1/HLA-DQA1/HLA-DPB1/HLA-A/HLA-DRA/HLA-DQA1/TNF/TNF/TNF/HLA-DRA/HLA-A/HLA-E/HLA-DPB1/TNF/HLA-E/HLA-G/HLA-DPB1/HLA-DPB1/HLA-DRB4/HLA-DQB1/HLA-DPA1/HLA-DQA1/HLA-A/HLA-DQB1/HLA-DQA1/TNF/HLA-G/HLA-DQA1/HLA-DQB1/HLA-E/HLA-DRA/HLA-G/HLA-A/HLA-G/HLA-DQA1/HLA-E/HLA-DPB1/HLA-G/HLA-DQA1/HLA-DPB1/HLA-DQA1/PECAM1/PTPRC/CCL5/CD24/B2M/CCL5/LILRB1/SMARCB1/LILRB4/HLA-G/LILRB1/LILRB1/HLA-DRA/ELANE/LILRB1/LILRB4/LILRB4/PTEN/ITCH | 234 |
| GO:0050870 | positive regulation of T cell activation | 175/3662 | 289/15509 | 1.04299e-41 | 3.80264e-39 | 2.28684e-39 | BAD/CD4/IGF1/CD74/RUNX3/ARID1B/FOXP3/AP3D1/RHOA/CBFB/GLI2/ACTB/IL4R/PTPRC/IL12RB1/ABL1/SMARCB1/XBP1/CD40LG/PYCARD/CSK/IL7/LILRB1/IL27RA/JAK3/GATA3/MAP3K8/ZMIZ1/SMARCD2/CCL2/EFNB3/ZBTB16/CD5/MDK/CD81/IFNG/IL12B/IL4/BCL6/CD86/HES1/IL1A/ZAP70/IGFBP2/CD160/ARID1A/MYB/FOXO3/GPAM/CD80/SOX4/IL1B/TNFSF9/CD70/CCR7/EPO/RARA/FLOT2/AP3B1/PTPN22/IL2RA/IL6/HLX/CCL21/IL21/SLC7A1/ABL2/DUSP10/IL2RG/IL18/RUNX1/TNFRSF13C/ICOSLG/VCAM1/TGFBR2/SPTA1/SHH/SYK/BRD7/RAG1/NOD2/FADD/RHOH/LGALS9/CCL19/KAT5/STAT5B/LEP/CD28/PTPN11/HLA-DQB1/KLHL25/SOCS1/LILRB4/ZP3/ARID2/HMGB1/CD55/HLA-DQA1/CD47/SRC/DPP4/PDCD1LG2/PNP/CR1/HLA-DOA/HLA-E/HLA-G/HLA-DQB1/HLA-DQA1/HLA-DQB1/HLA-DQA1/HLA-DRA/HLA-E/HLA-A/HLA-A/HLA-G/HLA-DPB1/HLA-DQA1/HLA-DPB1/HLA-A/HLA-A/HLA-DQA1/HLA-E/HLA-DQB1/HLA-DQA1/HLA-DPB1/HLA-A/HLA-DRA/HLA-DQA1/HLA-DRA/HLA-A/HLA-E/HLA-DPB1/HLA-E/HLA-G/HLA-DPB1/HLA-DPB1/HLA-DRB4/HLA-DQB1/HLA-DPA1/HLA-DQA1/HLA-A/HLA-DQB1/HLA-DQA1/HLA-G/HLA-DQA1/HLA-DQB1/HLA-E/HLA-DRA/HLA-G/HLA-A/HLA-G/HLA-DQA1/HLA-E/HLA-DPB1/HLA-G/HLA-DQA1/HLA-DPB1/HLA-DQA1/PTPRC/CCL5/CD24/B2M/CCL5/LILRB1/SMARCB1/LILRB4/HLA-G/LILRB1/LILRB1/HLA-DRA/LILRB1/LILRB4/LILRB4 | 175 |
| GO:0002705 | positive regulation of leukocyte mediated immunity | 147/3662 | 223/15509 | 1.65737e-41 | 5.70688e-39 | 3.43202e-39 | BTK/TYROBP/FOXP3/SPI1/TBX21/MLH1/DDX1/PTPRC/MAVS/P2RX7/MSH2/IL12RB1/CD40/FCER2/TGFB1/EXOSC3/GATA3/NSD2/HPX/CD81/IL12B/IL4/CD160/ARG1/SHLD2/IL1B/C3/NECTIN2/IL6/IL21/IL18/MR1/KIT/CD1A/CD1C/CD1B/ITGB2/TNFSF13/NOD2/FADD/PTAFR/ITGAM/STAT5B/CD28/ZP3/KIR2DL4/CD55/TAP2/TNF/HLA-E/HLA-G/CD177/TAP2/TAP2/HLA-DRA/TNF/HLA-B/HLA-E/HLA-A/HLA-A/HLA-G/TAP2/HLA-B/NCR3/LTA/TNF/HLA-A/HLA-A/HLA-B/HLA-E/NCR3/TAP2/LTA/HLA-A/HLA-DRA/TNF/TAP2/TNF/HLA-B/TNF/HLA-DRA/HLA-A/HLA-E/TNF/HLA-E/LTA/HLA-G/LTA/HLA-A/HLA-B/TAP2/TNF/HLA-G/HLA-E/HLA-DRA/HLA-G/HLA-A/HLA-G/NCR3/HLA-E/NCR3/NCR3/HLA-G/TAP2/NCR3/LTA/PTPRC/KIR2DL4/B2M/KIR2DL4/KIR2DL4/KIR2DL4/KIR2DL4/KIR2DL4/KIR2DL4/KIR2DL4/KIR2DL4/KIR2DL4/KIR2DL4/KIR2DL4/KIR2DL4/KIR2DL4/HLA-G/KIR2DL4/KIR2DL4/KIR2DL4/HLA-DRA/KIR2DL4/KIR2DL4/KIR2DL4/KIR2DL4/KIR2DL4/KIR2DL4/KIR2DL4/KIR2DL4/KIR2DL4/KIR2DL4/KIR2DL4/KIR2DL4/KIR2DL4/KIR2DL4/KIR2DL4/KIR2DL4/KIR2DL4/KIR2DL4/KIR2DL4/KIR2DL4 | 147 |
| GO:0031341 | regulation of cell killing | 131/3662 | 188/15509 | 3.81479e-41 | 1.24442e-38 | 7.48375e-39 | TYROBP/SPI1/FCGR2B/PTPRC/CD59/P2RX7/ICAM1/HSP90AB1/IL12RB1/FCER2/LILRB1/MAPK8/PPP3CB/IFNG/IL12B/IL4/CD160/ARG1/NECTIN2/IL21/ARRB2/MR1/CD1A/CD1C/CD1B/SYK/FADD/CX3CR1/LGALS9/ITGAM/SERPINB9/BCL2L1/STAT5B/LEP/PRF1/MICA/KIR2DL4/CD55/TAP2/HLA-E/HLA-G/TAP2/TAP2/HLA-DRA/HLA-B/HLA-E/HLA-A/HLA-A/HLA-G/TAP2/HLA-B/NCR3/HLA-A/HLA-A/HLA-B/HLA-E/NCR3/TAP2/HLA-A/HLA-DRA/TAP2/HLA-B/HLA-DRA/HLA-A/HLA-E/HLA-E/HLA-G/MICA/HLA-A/HLA-B/TAP2/MICA/HLA-G/HLA-E/HLA-DRA/MICA/HLA-G/HLA-A/HLA-G/NCR3/HLA-E/NCR3/NCR3/HLA-G/TAP2/NCR3/PTPRC/KIR2DL4/B2M/KIR2DL4/KIR2DL4/KIR2DL4/KIR2DL4/LILRB1/KIR2DL4/KIR2DL4/KIR2DL4/KIR2DL4/KIR2DL4/KIR2DL4/KIR2DL4/KIR2DL4/KIR2DL4/HLA-G/LILRB1/KIR2DL4/KIR2DL4/KIR2DL4/LILRB1/HLA-DRA/KIR2DL4/KIR2DL4/KIR2DL4/KIR2DL4/LILRB1/KIR2DL4/KIR2DL4/KIR2DL4/KIR2DL4/KIR2DL4/KIR2DL4/KIR2DL4/KIR2DL4/KIR2DL4/KIR2DL4/KIR2DL4/KIR2DL4/KIR2DL4/KIR2DL4/KIR2DL4/KIR2DL4 | 131 |
| GO:0002700 | regulation of production of molecular mediator of immune response | 155/3662 | 244/15509 | 1.02526e-40 | 3.17728e-38 | 1.91076e-38 | BTK/HFE/CD22/CD74/TNFRSF1B/PARP3/FOXP3/FCGR2B/TBX21/MLH1/IL4R/DDX1/PTPRC/MAVS/P2RX7/MSH2/XBP1/CD40/SMAD7/CD40LG/ACP5/PYCARD/LILRB1/IL27RA/CLC/GPI/TGFB1/JAK3/NOD1/EXOSC3/GATA3/NSD2/HPX/CD81/IL17A/IL4/IL5/BCL6/CD86/WNT5A/CD160/ARG1/NR4A3/CD244/SHLD2/PKN1/IL1B/NDFIP1/EPHB2/PTPN22/CD36/IL6/IL10/TLR4/IL21/SLC15A4/TMBIM6/IL18/CD96/KIT/NLRX1/TNFSF13/MAPKAPK2/TLR3/SYK/NOD2/CD28/LACC1/PRG2/LILRB4/CARD9/KIR2DL4/CD55/TLR7/UBE2J1/CR1/TNF/HLA-E/HLA-G/TNF/HLA-E/HLA-A/HLA-A/HLA-G/TNF/HLA-A/HLA-A/HLA-E/HLA-A/TNF/TNF/TNF/HLA-A/HLA-E/TNF/HLA-E/HLA-G/HLA-A/TNF/HLA-G/HLA-E/HLA-G/HLA-A/HLA-G/HLA-E/HLA-G/PTPRC/KIR2DL4/B2M/KIR2DL4/KIR2DL4/KIR2DL4/KIR2DL4/LILRB1/KIR2DL4/KIR2DL4/KIR2DL4/KIR2DL4/KIR2DL4/KIR2DL4/KIR2DL4/KIR2DL4/LILRB4/KIR2DL4/HLA-G/LILRB1/MIF/KIR2DL4/KIR2DL4/KIR2DL4/LILRB1/KIR2DL4/KIR2DL4/KIR2DL4/KIR2DL4/LILRB1/KIR2DL4/KIR2DL4/KIR2DL4/KIR2DL4/LILRB4/KIR2DL4/LILRB4/KIR2DL4/GPI/KIR2DL4/KIR2DL4/KIR2DL4/KIR2DL4/KIR2DL4/KIR2DL4/KIR2DL4/KIR2DL4/KIR2DL4/KIR2DL4 | 155 |
| GO:0002708 | positive regulation of lymphocyte mediated immunity | 137/3662 | 203/15509 | 1.66678e-40 | 4.91937e-38 | 2.95842e-38 | BTK/FOXP3/TBX21/MLH1/PTPRC/P2RX7/MSH2/IL12RB1/CD40/FCER2/TGFB1/EXOSC3/GATA3/NSD2/HPX/CD81/IL12B/IL4/CD160/SHLD2/IL1B/C3/NECTIN2/IL6/IL21/IL18/MR1/CD1A/CD1C/CD1B/TNFSF13/NOD2/FADD/STAT5B/CD28/ZP3/KIR2DL4/CD55/TAP2/TNF/HLA-E/HLA-G/TAP2/TAP2/HLA-DRA/TNF/HLA-B/HLA-E/HLA-A/HLA-A/HLA-G/TAP2/HLA-B/NCR3/LTA/TNF/HLA-A/HLA-A/HLA-B/HLA-E/NCR3/TAP2/LTA/HLA-A/HLA-DRA/TNF/TAP2/TNF/HLA-B/TNF/HLA-DRA/HLA-A/HLA-E/TNF/HLA-E/LTA/HLA-G/LTA/HLA-A/HLA-B/TAP2/TNF/HLA-G/HLA-E/HLA-DRA/HLA-G/HLA-A/HLA-G/NCR3/HLA-E/NCR3/NCR3/HLA-G/TAP2/NCR3/LTA/PTPRC/KIR2DL4/B2M/KIR2DL4/KIR2DL4/KIR2DL4/KIR2DL4/KIR2DL4/KIR2DL4/KIR2DL4/KIR2DL4/KIR2DL4/KIR2DL4/KIR2DL4/KIR2DL4/KIR2DL4/HLA-G/KIR2DL4/KIR2DL4/KIR2DL4/HLA-DRA/KIR2DL4/KIR2DL4/KIR2DL4/KIR2DL4/KIR2DL4/KIR2DL4/KIR2DL4/KIR2DL4/KIR2DL4/KIR2DL4/KIR2DL4/KIR2DL4/KIR2DL4/KIR2DL4/KIR2DL4/KIR2DL4/KIR2DL4/KIR2DL4/KIR2DL4/KIR2DL4 | 137 |
| GO:0031342 | negative regulation of cell killing | 85/3662 | 98/15509 | 4.46788e-40 | 1.25872e-37 | 7.56975e-38 | FCGR2B/PTPRC/HSP90AB1/LILRB1/PPP3CB/IL4/ARRB2/CX3CR1/LGALS9/SERPINB9/MICA/KIR2DL4/HLA-E/HLA-G/HLA-B/HLA-E/HLA-A/HLA-A/HLA-G/HLA-B/HLA-A/HLA-A/HLA-B/HLA-E/HLA-A/HLA-B/HLA-A/HLA-E/HLA-E/HLA-G/MICA/HLA-A/HLA-B/MICA/HLA-G/HLA-E/MICA/HLA-G/HLA-A/HLA-G/HLA-E/HLA-G/PTPRC/KIR2DL4/KIR2DL4/KIR2DL4/KIR2DL4/KIR2DL4/LILRB1/KIR2DL4/KIR2DL4/KIR2DL4/KIR2DL4/KIR2DL4/KIR2DL4/KIR2DL4/KIR2DL4/KIR2DL4/HLA-G/LILRB1/KIR2DL4/KIR2DL4/KIR2DL4/LILRB1/KIR2DL4/KIR2DL4/KIR2DL4/KIR2DL4/LILRB1/KIR2DL4/KIR2DL4/KIR2DL4/KIR2DL4/KIR2DL4/KIR2DL4/KIR2DL4/KIR2DL4/KIR2DL4/KIR2DL4/KIR2DL4/KIR2DL4/KIR2DL4/KIR2DL4/KIR2DL4/KIR2DL4 | 85 |
| GO:0002707 | negative regulation of lymphocyte mediated immunity | 100/3662 | 126/15509 | 5.28805e-40 | 1.42501e-37 | 8.56979e-38 | HFE/PARP3/FOXP3/FCGR2B/TBX21/PTPRC/SMAD7/LILRB1/AHR/PPP3CB/BCL6/ARG1/FOXJ1/NDFIP1/ARRB2/CD96/NOD2/LGALS9/SERPINB9/MICA/LILRB4/KIR2DL4/CD55/CR1/HLA-E/HLA-G/HLA-B/HLA-E/HLA-A/HLA-A/HLA-G/HLA-B/HLA-A/HLA-A/HLA-B/HLA-E/HLA-A/HLA-B/HLA-A/HLA-E/HLA-E/HLA-G/MICA/HLA-A/HLA-B/MICA/HLA-G/HLA-E/MICA/HLA-G/HLA-A/HLA-G/HLA-E/HLA-G/PTPRC/KIR2DL4/KIR2DL4/KIR2DL4/KIR2DL4/KIR2DL4/LILRB1/KIR2DL4/KIR2DL4/KIR2DL4/KIR2DL4/KIR2DL4/KIR2DL4/KIR2DL4/KIR2DL4/LILRB4/KIR2DL4/HLA-G/LILRB1/KIR2DL4/KIR2DL4/KIR2DL4/LILRB1/KIR2DL4/KIR2DL4/KIR2DL4/KIR2DL4/LILRB1/KIR2DL4/KIR2DL4/KIR2DL4/KIR2DL4/LILRB4/KIR2DL4/LILRB4/KIR2DL4/KIR2DL4/KIR2DL4/KIR2DL4/KIR2DL4/KIR2DL4/KIR2DL4/KIR2DL4/KIR2DL4/KIR2DL4/KIR2DL4 | 100 |
| GO:0001911 | negative regulation of leukocyte mediated cytotoxicity | 83/3662 | 95/15509 | 1.09506e-39 | 2.82799e-37 | 1.70071e-37 | FCGR2B/PTPRC/LILRB1/PPP3CB/ARRB2/CX3CR1/LGALS9/SERPINB9/MICA/KIR2DL4/HLA-E/HLA-G/HLA-B/HLA-E/HLA-A/HLA-A/HLA-G/HLA-B/HLA-A/HLA-A/HLA-B/HLA-E/HLA-A/HLA-B/HLA-A/HLA-E/HLA-E/HLA-G/MICA/HLA-A/HLA-B/MICA/HLA-G/HLA-E/MICA/HLA-G/HLA-A/HLA-G/HLA-E/HLA-G/PTPRC/KIR2DL4/KIR2DL4/KIR2DL4/KIR2DL4/KIR2DL4/LILRB1/KIR2DL4/KIR2DL4/KIR2DL4/KIR2DL4/KIR2DL4/KIR2DL4/KIR2DL4/KIR2DL4/KIR2DL4/HLA-G/LILRB1/KIR2DL4/KIR2DL4/KIR2DL4/LILRB1/KIR2DL4/KIR2DL4/KIR2DL4/KIR2DL4/LILRB1/KIR2DL4/KIR2DL4/KIR2DL4/KIR2DL4/KIR2DL4/KIR2DL4/KIR2DL4/KIR2DL4/KIR2DL4/KIR2DL4/KIR2DL4/KIR2DL4/KIR2DL4/KIR2DL4/KIR2DL4/KIR2DL4 | 83 |
| GO:0051251 | positive regulation of lymphocyte activation | 202/3662 | 368/15509 | 4.54752e-39 | 1.12742e-36 | 6.78012e-37 | BAD/CD38/CD4/BTK/TYROBP/IGF1/CD74/RUNX3/ARID1B/FOXP3/AP3D1/RHOA/CBFB/TBX21/GLI2/ACTB/MLH1/IL4R/PTPRC/MSH2/IL12RB1/ABL1/SMARCB1/XBP1/CD40/NFATC2/CD40LG/PYCARD/CSK/IL7/LILRB1/IL27RA/TGFB1/JAK3/EXOSC3/GATA3/MAP3K8/ZMIZ1/SMARCD2/CCL2/EFNB3/NSD2/ZBTB16/CD5/MDK/CD81/IFNG/IL12B/IL4/IL5/BCL6/CD86/HES1/IL1A/ZAP70/IGFBP2/CD160/MPL/ARID1A/MYB/FOXO3/GPAM/CD80/SHLD2/CDKN1A/SOX4/IL1B/TNFSF9/CD70/CCR7/EPO/RARA/FLOT2/AP3B1/EPHB2/PTPN22/IL2RA/AKIRIN2/IL6/HLX/IL10/TLR4/CCL21/IL21/SLC7A1/ABL2/DUSP10/IL2RG/IL18/MMP14/RUNX1/TNFRSF13C/ICOSLG/TNFSF13/VCAM1/TGFBR2/SPTA1/SHH/SYK/BRD7/RAG1/NOD2/FADD/RHOH/TNIP2/INPP5D/LGALS9/CCL19/KAT5/STAT5B/LEP/CD28/PTPN11/HLA-DQB1/KLHL25/SOCS1/LILRB4/ZP3/ARID2/BLOC1S3/HMGB1/CD55/HLA-DQA1/CD47/SRC/DPP4/PDCD1LG2/PNP/CR1/HLA-DOA/HLA-E/HLA-G/HLA-DQB1/HLA-DQA1/HLA-DQB1/HLA-DQA1/HLA-DRA/HLA-E/HLA-A/HLA-A/HLA-G/HLA-DPB1/HLA-DQA1/HLA-DPB1/HLA-A/HLA-A/HLA-DQA1/HLA-E/HLA-DQB1/HLA-DQA1/HLA-DPB1/HLA-A/HLA-DRA/HLA-DQA1/HLA-DRA/HLA-A/HLA-E/HLA-DPB1/HLA-E/HLA-G/HLA-DPB1/HLA-DPB1/HLA-DRB4/HLA-DQB1/HLA-DPA1/HLA-DQA1/HLA-A/HLA-DQB1/HLA-DQA1/HLA-G/HLA-DQA1/HLA-DQB1/HLA-E/HLA-DRA/HLA-G/HLA-A/HLA-G/HLA-DQA1/HLA-E/HLA-DPB1/HLA-G/HLA-DQA1/HLA-DPB1/PRKDC/HLA-DQA1/PTPRC/CCL5/CD24/B2M/CCL5/LILRB1/SMARCB1/LILRB4/HLA-G/LILRB1/MIF/LILRB1/HLA-DRA/LILRB1/LILRB4/LILRB4/INPP5D | 202 |
| GO:0002716 | negative regulation of natural killer cell mediated immunity | 79/3662 | 89/15509 | 5.90243e-39 | 1.40705e-36 | 8.46174e-37 | LILRB1/ARRB2/CD96/LGALS9/SERPINB9/MICA/KIR2DL4/HLA-E/HLA-G/HLA-B/HLA-E/HLA-A/HLA-A/HLA-G/HLA-B/HLA-A/HLA-A/HLA-B/HLA-E/HLA-A/HLA-B/HLA-A/HLA-E/HLA-E/HLA-G/MICA/HLA-A/HLA-B/MICA/HLA-G/HLA-E/MICA/HLA-G/HLA-A/HLA-G/HLA-E/HLA-G/KIR2DL4/KIR2DL4/KIR2DL4/KIR2DL4/KIR2DL4/LILRB1/KIR2DL4/KIR2DL4/KIR2DL4/KIR2DL4/KIR2DL4/KIR2DL4/KIR2DL4/KIR2DL4/KIR2DL4/HLA-G/LILRB1/KIR2DL4/KIR2DL4/KIR2DL4/LILRB1/KIR2DL4/KIR2DL4/KIR2DL4/KIR2DL4/LILRB1/KIR2DL4/KIR2DL4/KIR2DL4/KIR2DL4/KIR2DL4/KIR2DL4/KIR2DL4/KIR2DL4/KIR2DL4/KIR2DL4/KIR2DL4/KIR2DL4/KIR2DL4/KIR2DL4/KIR2DL4/KIR2DL4 | 79 |
| GO:0001910 | regulation of leukocyte mediated cytotoxicity | 121/3662 | 172/15509 | 9.28807e-39 | 2.13213e-36 | 1.28222e-36 | TYROBP/SPI1/FCGR2B/PTPRC/P2RX7/ICAM1/IL12RB1/LILRB1/PPP3CB/IL12B/CD160/ARG1/NECTIN2/IL21/ARRB2/MR1/CD1A/CD1C/CD1B/FADD/CX3CR1/LGALS9/ITGAM/SERPINB9/STAT5B/LEP/MICA/KIR2DL4/TAP2/HLA-E/HLA-G/TAP2/TAP2/HLA-DRA/HLA-B/HLA-E/HLA-A/HLA-A/HLA-G/TAP2/HLA-B/NCR3/HLA-A/HLA-A/HLA-B/HLA-E/NCR3/TAP2/HLA-A/HLA-DRA/TAP2/HLA-B/HLA-DRA/HLA-A/HLA-E/HLA-E/HLA-G/MICA/HLA-A/HLA-B/TAP2/MICA/HLA-G/HLA-E/HLA-DRA/MICA/HLA-G/HLA-A/HLA-G/NCR3/HLA-E/NCR3/NCR3/HLA-G/TAP2/NCR3/PTPRC/KIR2DL4/B2M/KIR2DL4/KIR2DL4/KIR2DL4/KIR2DL4/LILRB1/KIR2DL4/KIR2DL4/KIR2DL4/KIR2DL4/KIR2DL4/KIR2DL4/KIR2DL4/KIR2DL4/KIR2DL4/HLA-G/LILRB1/KIR2DL4/KIR2DL4/KIR2DL4/LILRB1/HLA-DRA/KIR2DL4/KIR2DL4/KIR2DL4/KIR2DL4/LILRB1/KIR2DL4/KIR2DL4/KIR2DL4/KIR2DL4/KIR2DL4/KIR2DL4/KIR2DL4/KIR2DL4/KIR2DL4/KIR2DL4/KIR2DL4/KIR2DL4/KIR2DL4/KIR2DL4/KIR2DL4/KIR2DL4 | 121 |
| GO:0045953 | negative regulation of natural killer cell mediated cytotoxicity | 78/3662 | 88/15509 | 2.25544e-38 | 4.99258e-36 | 3.00245e-36 | LILRB1/ARRB2/LGALS9/SERPINB9/MICA/KIR2DL4/HLA-E/HLA-G/HLA-B/HLA-E/HLA-A/HLA-A/HLA-G/HLA-B/HLA-A/HLA-A/HLA-B/HLA-E/HLA-A/HLA-B/HLA-A/HLA-E/HLA-E/HLA-G/MICA/HLA-A/HLA-B/MICA/HLA-G/HLA-E/MICA/HLA-G/HLA-A/HLA-G/HLA-E/HLA-G/KIR2DL4/KIR2DL4/KIR2DL4/KIR2DL4/KIR2DL4/LILRB1/KIR2DL4/KIR2DL4/KIR2DL4/KIR2DL4/KIR2DL4/KIR2DL4/KIR2DL4/KIR2DL4/KIR2DL4/HLA-G/LILRB1/KIR2DL4/KIR2DL4/KIR2DL4/LILRB1/KIR2DL4/KIR2DL4/KIR2DL4/KIR2DL4/LILRB1/KIR2DL4/KIR2DL4/KIR2DL4/KIR2DL4/KIR2DL4/KIR2DL4/KIR2DL4/KIR2DL4/KIR2DL4/KIR2DL4/KIR2DL4/KIR2DL4/KIR2DL4/KIR2DL4/KIR2DL4/KIR2DL4 | 78 |
| GO:0002704 | negative regulation of leukocyte mediated immunity | 103/3662 | 137/15509 | 2.22263e-37 | 4.75029e-35 | 2.85674e-35 | HFE/PARP3/FOXP3/SPI1/FCGR2B/TBX21/PTPRC/SMAD7/LILRB1/JAK3/AHR/PPP3CB/BCL6/ARG1/FOXJ1/NDFIP1/ARRB2/CD96/NOD2/CX3CR1/LGALS9/SERPINB9/MICA/LILRB4/KIR2DL4/CD55/CR1/HLA-E/HLA-G/HLA-B/HLA-E/HLA-A/HLA-A/HLA-G/HLA-B/HLA-A/HLA-A/HLA-B/HLA-E/HLA-A/HLA-B/HLA-A/HLA-E/HLA-E/HLA-G/MICA/HLA-A/HLA-B/MICA/HLA-G/HLA-E/MICA/HLA-G/HLA-A/HLA-G/HLA-E/HLA-G/PTPRC/KIR2DL4/KIR2DL4/KIR2DL4/KIR2DL4/KIR2DL4/LILRB1/KIR2DL4/KIR2DL4/KIR2DL4/KIR2DL4/KIR2DL4/KIR2DL4/KIR2DL4/KIR2DL4/LILRB4/KIR2DL4/HLA-G/LILRB1/KIR2DL4/KIR2DL4/KIR2DL4/LILRB1/KIR2DL4/KIR2DL4/KIR2DL4/KIR2DL4/LILRB1/KIR2DL4/KIR2DL4/KIR2DL4/KIR2DL4/LILRB4/KIR2DL4/LILRB4/KIR2DL4/KIR2DL4/KIR2DL4/KIR2DL4/KIR2DL4/KIR2DL4/KIR2DL4/KIR2DL4/KIR2DL4/KIR2DL4/KIR2DL4 | 103 |
| GO:0002718 | regulation of cytokine production involved in immune response | 123/3662 | 181/15509 | 6.00847e-37 | 1.24135e-34 | 7.46526e-35 | BTK/HFE/CD74/TNFRSF1B/FOXP3/TBX21/DDX1/MAVS/P2RX7/SMAD7/ACP5/PYCARD/LILRB1/CLC/TGFB1/JAK3/NOD1/GATA3/CD81/IL4/BCL6/WNT5A/CD160/ARG1/NR4A3/IL1B/CD36/IL6/IL10/TLR4/IL18/CD96/KIT/NLRX1/MAPKAPK2/TLR3/SYK/NOD2/LACC1/PRG2/LILRB4/CARD9/KIR2DL4/CD55/TLR7/UBE2J1/TNF/HLA-E/HLA-G/TNF/HLA-E/HLA-A/HLA-A/HLA-G/TNF/HLA-A/HLA-A/HLA-E/HLA-A/TNF/TNF/TNF/HLA-A/HLA-E/TNF/HLA-E/HLA-G/HLA-A/TNF/HLA-G/HLA-E/HLA-G/HLA-A/HLA-G/HLA-E/HLA-G/KIR2DL4/B2M/KIR2DL4/KIR2DL4/KIR2DL4/KIR2DL4/LILRB1/KIR2DL4/KIR2DL4/KIR2DL4/KIR2DL4/KIR2DL4/KIR2DL4/KIR2DL4/KIR2DL4/LILRB4/KIR2DL4/HLA-G/LILRB1/MIF/KIR2DL4/KIR2DL4/KIR2DL4/LILRB1/KIR2DL4/KIR2DL4/KIR2DL4/KIR2DL4/LILRB1/KIR2DL4/KIR2DL4/KIR2DL4/KIR2DL4/LILRB4/KIR2DL4/LILRB4/KIR2DL4/KIR2DL4/KIR2DL4/KIR2DL4/KIR2DL4/KIR2DL4/KIR2DL4/KIR2DL4/KIR2DL4/KIR2DL4/KIR2DL4 | 123 |
| GO:0002698 | negative regulation of immune effector process | 127/3662 | 192/15509 | 3.09235e-36 | 6.1827e-34 | 3.71816e-34 | HFE/CD22/GRN/PARP3/FOXP3/SPI1/FCGR2B/TBX21/IL4R/PTPRC/CD59/SMAD7/ACP5/LILRB1/TGFB1/JAK3/AHR/PPP3CB/IL4/BCL6/ARG1/FOXJ1/NDFIP1/HLX/IL10/TMBIM6/ARRB2/DUSP10/CD96/APPL1/NLRX1/NOD2/CX3CR1/LGALS9/SERPINB9/A2M/MICA/PRG2/LILRB4/KIR2DL4/CD55/CD47/CR1/TNF/HLA-E/HLA-G/TNF/HLA-B/HLA-E/HLA-A/HLA-A/HLA-G/HLA-B/TNF/HLA-A/HLA-A/HLA-B/HLA-E/HLA-A/TNF/TNF/HLA-B/TNF/HLA-A/HLA-E/TNF/HLA-E/HLA-G/MICA/HLA-A/HLA-B/TNF/MICA/HLA-G/HLA-E/MICA/HLA-G/HLA-A/HLA-G/HLA-E/HLA-G/PTPRC/KIR2DL4/KIR2DL4/KIR2DL4/KIR2DL4/KIR2DL4/LILRB1/KIR2DL4/KIR2DL4/KIR2DL4/KIR2DL4/KIR2DL4/KIR2DL4/KIR2DL4/KIR2DL4/LILRB4/KIR2DL4/HLA-G/LILRB1/KIR2DL4/KIR2DL4/KIR2DL4/LILRB1/KIR2DL4/KIR2DL4/KIR2DL4/KIR2DL4/LILRB1/KIR2DL4/KIR2DL4/KIR2DL4/KIR2DL4/LILRB4/KIR2DL4/LILRB4/KIR2DL4/KIR2DL4/KIR2DL4/KIR2DL4/KIR2DL4/KIR2DL4/KIR2DL4/KIR2DL4/KIR2DL4/KIR2DL4/KIR2DL4 | 127 |
| GO:0002367 | cytokine production involved in immune response | 123/3662 | 183/15509 | 3.36284e-36 | 6.5134e-34 | 3.91704e-34 | BTK/HFE/CD74/TNFRSF1B/FOXP3/TBX21/DDX1/MAVS/P2RX7/SMAD7/ACP5/PYCARD/LILRB1/CLC/TGFB1/JAK3/NOD1/GATA3/CD81/IL4/BCL6/WNT5A/CD160/ARG1/NR4A3/IL1B/CD36/IL6/IL10/TLR4/IL18/CD96/KIT/NLRX1/MAPKAPK2/TLR3/SYK/NOD2/LACC1/PRG2/LILRB4/CARD9/KIR2DL4/CD55/TLR7/UBE2J1/TNF/HLA-E/HLA-G/TNF/HLA-E/HLA-A/HLA-A/HLA-G/TNF/HLA-A/HLA-A/HLA-E/HLA-A/TNF/TNF/TNF/HLA-A/HLA-E/TNF/HLA-E/HLA-G/HLA-A/TNF/HLA-G/HLA-E/HLA-G/HLA-A/HLA-G/HLA-E/HLA-G/KIR2DL4/B2M/KIR2DL4/KIR2DL4/KIR2DL4/KIR2DL4/LILRB1/KIR2DL4/KIR2DL4/KIR2DL4/KIR2DL4/KIR2DL4/KIR2DL4/KIR2DL4/KIR2DL4/LILRB4/KIR2DL4/HLA-G/LILRB1/MIF/KIR2DL4/KIR2DL4/KIR2DL4/LILRB1/KIR2DL4/KIR2DL4/KIR2DL4/KIR2DL4/LILRB1/KIR2DL4/KIR2DL4/KIR2DL4/KIR2DL4/LILRB4/KIR2DL4/LILRB4/KIR2DL4/KIR2DL4/KIR2DL4/KIR2DL4/KIR2DL4/KIR2DL4/KIR2DL4/KIR2DL4/KIR2DL4/KIR2DL4/KIR2DL4 | 123 |
| GO:0050863 | regulation of T cell activation | 208/3662 | 399/15509 | 8.56357e-36 | 1.60839e-33 | 9.6726e-34 | BAD/CD4/HFE/IGF1/CD74/RUNX3/TNFRSF1B/ARID1B/FOXP3/PRDM1/AP3D1/RHOA/CBFB/FCGR2B/TBX21/GLI2/ACTB/IL4R/ARG2/PTPRC/IL12RB1/ABL1/SMARCB1/XBP1/CTSG/SMAD7/CD40LG/PYCARD/CSK/IL7/LILRB1/IL27RA/CLC/JAK3/TNFSF8/GATA3/MAP3K8/ZMIZ1/SMARCD2/CCL2/EFNB3/ZBTB16/CD5/MDK/CD81/IFNG/IL12B/IL4/BCL6/CD86/HES1/IL1A/ZAP70/IGFBP2/CD160/ARID1A/MYB/ARG1/FOXO3/GPAM/CD80/SOX4/IL1B/TNFSF9/CD70/CCR7/RAC2/TWSG1/FOXJ1/EPO/NDFIP1/RARA/FLOT2/AP3B1/SFTPD/PTPN22/IL2RA/IL6/HLX/IL10/CCL21/IRF4/IL21/SLC7A1/SOD1/ABL2/DUSP10/TNFRSF21/IL2RG/ZEB1/IL18/RUNX1/TNFRSF13C/ICOSLG/VCAM1/TGFBR2/SPTA1/CTLA4/CASP3/SHH/SYK/BRD7/RAG1/LMO1/NOD2/PRDX2/FADD/RHOH/LGALS9/PRELID1/CEBPB/CCL19/KAT5/STAT5B/LEP/GLMN/RAG2/PTPN2/CD28/PTPN11/HLA-DQB1/KLHL25/SOCS1/LILRB4/ZP3/ARID2/HMGB1/CD55/HLA-DQA1/CD47/SRC/DPP4/PDCD1LG2/NRARP/PNP/CR1/HLA-DOA/HLA-E/HLA-G/HLA-DQB1/HLA-DQA1/HLA-DQB1/HLA-DQA1/HLA-DRA/HLA-E/HLA-A/HLA-A/HLA-G/HLA-DPB1/HLA-DQA1/HLA-DPB1/HLA-A/HLA-A/HLA-DQA1/HLA-E/HLA-DQB1/HLA-DQA1/HLA-DPB1/HLA-A/HLA-DRA/HLA-DQA1/HLA-DRA/HLA-A/HLA-E/HLA-DPB1/HLA-E/HLA-G/HLA-DPB1/HLA-DPB1/HLA-DRB4/HLA-DQB1/HLA-DPA1/HLA-DQA1/HLA-A/HLA-DQB1/HLA-DQA1/HLA-G/HLA-DQA1/HLA-DQB1/HLA-E/HLA-DRA/HLA-G/HLA-A/HLA-G/HLA-DQA1/HLA-E/HLA-DPB1/HLA-G/HLA-DQA1/HLA-DPB1/HLA-DQA1/PTPRC/CCL5/CD24/B2M/CCL5/LILRB1/SMARCB1/LILRB4/HLA-G/LILRB1/LILRB1/HLA-DRA/LILRB1/LILRB4/LILRB4/PTEN/ITCH | 208 |
| GO:1903706 | regulation of hemopoiesis | 202/3662 | 389/15509 | 1.80325e-34 | 3.28723e-32 | 1.97688e-32 | BAD/PAF1/SCIN/CD4/BTK/TYROBP/LTF/SNAI2/CD74/RUNX3/HMGB3/ARID1B/FOXP3/PRDM1/AP3D1/SPI1/RHOA/CBFB/TFE3/FCGR2B/TBX21/GLI2/ACTB/IL4R/HOXA9/PTPRC/BRPF3/IL12RB1/ABL1/SMARCB1/XBP1/ACIN1/NFKBIA/RASSF2/SMAD7/GATA1/SFRP1/IL7/LILRB1/TGFB1/JAK3/PTN/HOXA5/GATA3/ZMIZ1/CSF3/SMARCD2/ZBTB16/MDK/IFNG/NEDD9/MAPK14/IL17A/HSPA9/IL12B/IL4/IL5/BCL6/CD86/ZAP70/STAT1/ID2/MPL/ARID1A/MYB/FOXO3/CSF3R/PTK2B/IAPP/CD80/INHBA/SOX4/TNFSF9/PRMT1/ZFP36/LIF/LRRC17/FOXJ1/NDFIP1/RARA/PIAS3/AP3B1/NOTCH2/IL2RA/ABCB10/HLX/IL10/TLR4/IRF4/RB1/CUL4A/SKIC8/SOD1/ARNT/DUSP10/MEIS1/TCTA/PIK3R1/PURB/IL2RG/ZEB1/IL18/POU4F2/POU4F1/ZFP36L2/PRKCA/GABPA/KLF10/BRPF1/MMP14/RUNX1/TAL1/MYSM1/RBM15/TGFBR2/CTLA4/PF4/SLC9B2/TLR3/SHH/TNFRSF11B/SYK/BRD7/RAG1/PRDX2/FADD/RHOH/INPP5D/LGALS9/PRELID1/FOS/CEBPB/CCL19/RARG/KAT5/ESRRA/GPR137/STAT5B/RAG2/PTPN2/CD28/CTNNBIP1/ADIPOQ/KLHL25/CSF1/CIB1/SOCS1/ZFP36L1/LILRB4/ARID2/HMGB1/NRARP/MTOR/PNP/CR1/MAFB/HLA-DOA/TNF/HLA-G/HLA-DRA/TNF/HLA-B/HLA-G/HLA-B/TNF/HLA-B/HLA-DRA/TNF/TNF/HLA-B/TNF/HLA-DRA/TNF/HLA-G/HLA-B/TNF/HLA-G/HLA-DRA/HLA-G/HLA-G/HLA-G/EIF6/CEBPA/PRKDC/PTPRC/H4C15/H4C14/H4C12/B2M/LILRB1/SMARCB1/LILRB4/HLA-G/LILRB1/H4C5/LILRB1/H4C4/HLA-DRA/LILRB1/LILRB4/LILRB4/INPP5D | 202 |
| GO:0002702 | positive regulation of production of molecular mediator of immune response | 120/3662 | 184/15509 | 2.12267e-33 | 3.75895e-31 | 2.26057e-31 | BTK/CD74/TBX21/MLH1/IL4R/DDX1/PTPRC/MAVS/P2RX7/MSH2/XBP1/CD40/PYCARD/LILRB1/GPI/TGFB1/NOD1/EXOSC3/GATA3/NSD2/HPX/CD81/IL17A/IL4/IL5/CD86/WNT5A/CD160/NR4A3/CD244/SHLD2/IL1B/EPHB2/PTPN22/CD36/IL6/IL10/TLR4/IL21/IL18/KIT/TNFSF13/MAPKAPK2/TLR3/SYK/NOD2/CD28/LACC1/CARD9/KIR2DL4/CD55/TLR7/HLA-E/HLA-G/HLA-E/HLA-A/HLA-A/HLA-G/HLA-A/HLA-A/HLA-E/HLA-A/HLA-A/HLA-E/HLA-E/HLA-G/HLA-A/HLA-G/HLA-E/HLA-G/HLA-A/HLA-G/HLA-E/HLA-G/PTPRC/KIR2DL4/B2M/KIR2DL4/KIR2DL4/KIR2DL4/KIR2DL4/LILRB1/KIR2DL4/KIR2DL4/KIR2DL4/KIR2DL4/KIR2DL4/KIR2DL4/KIR2DL4/KIR2DL4/KIR2DL4/HLA-G/LILRB1/MIF/KIR2DL4/KIR2DL4/KIR2DL4/LILRB1/KIR2DL4/KIR2DL4/KIR2DL4/KIR2DL4/LILRB1/KIR2DL4/KIR2DL4/KIR2DL4/KIR2DL4/KIR2DL4/KIR2DL4/GPI/KIR2DL4/KIR2DL4/KIR2DL4/KIR2DL4/KIR2DL4/KIR2DL4/KIR2DL4/KIR2DL4/KIR2DL4/KIR2DL4 | 120 |
| GO:0042269 | regulation of natural killer cell mediated cytotoxicity | 90/3662 | 119/15509 | 3.66983e-33 | 6.31823e-31 | 3.79967e-31 | LILRB1/IL12B/CD160/NECTIN2/IL21/ARRB2/LGALS9/SERPINB9/STAT5B/LEP/MICA/KIR2DL4/HLA-E/HLA-G/HLA-B/HLA-E/HLA-A/HLA-A/HLA-G/HLA-B/NCR3/HLA-A/HLA-A/HLA-B/HLA-E/NCR3/HLA-A/HLA-B/HLA-A/HLA-E/HLA-E/HLA-G/MICA/HLA-A/HLA-B/MICA/HLA-G/HLA-E/MICA/HLA-G/HLA-A/HLA-G/NCR3/HLA-E/NCR3/NCR3/HLA-G/NCR3/KIR2DL4/KIR2DL4/KIR2DL4/KIR2DL4/KIR2DL4/LILRB1/KIR2DL4/KIR2DL4/KIR2DL4/KIR2DL4/KIR2DL4/KIR2DL4/KIR2DL4/KIR2DL4/KIR2DL4/HLA-G/LILRB1/KIR2DL4/KIR2DL4/KIR2DL4/LILRB1/KIR2DL4/KIR2DL4/KIR2DL4/KIR2DL4/LILRB1/KIR2DL4/KIR2DL4/KIR2DL4/KIR2DL4/KIR2DL4/KIR2DL4/KIR2DL4/KIR2DL4/KIR2DL4/KIR2DL4/KIR2DL4/KIR2DL4/KIR2DL4/KIR2DL4/KIR2DL4/KIR2DL4 | 90 |
| GO:0002715 | regulation of natural killer cell mediated immunity | 91/3662 | 122/15509 | 1.05784e-32 | 1.77203e-30 | 1.06567e-30 | LILRB1/IL12B/CD160/NECTIN2/IL21/ARRB2/CD96/LGALS9/SERPINB9/STAT5B/LEP/MICA/KIR2DL4/HLA-E/HLA-G/HLA-B/HLA-E/HLA-A/HLA-A/HLA-G/HLA-B/NCR3/HLA-A/HLA-A/HLA-B/HLA-E/NCR3/HLA-A/HLA-B/HLA-A/HLA-E/HLA-E/HLA-G/MICA/HLA-A/HLA-B/MICA/HLA-G/HLA-E/MICA/HLA-G/HLA-A/HLA-G/NCR3/HLA-E/NCR3/NCR3/HLA-G/NCR3/KIR2DL4/KIR2DL4/KIR2DL4/KIR2DL4/KIR2DL4/LILRB1/KIR2DL4/KIR2DL4/KIR2DL4/KIR2DL4/KIR2DL4/KIR2DL4/KIR2DL4/KIR2DL4/KIR2DL4/HLA-G/LILRB1/KIR2DL4/KIR2DL4/KIR2DL4/LILRB1/KIR2DL4/KIR2DL4/KIR2DL4/KIR2DL4/LILRB1/KIR2DL4/KIR2DL4/KIR2DL4/KIR2DL4/KIR2DL4/KIR2DL4/KIR2DL4/KIR2DL4/KIR2DL4/KIR2DL4/KIR2DL4/KIR2DL4/KIR2DL4/KIR2DL4/KIR2DL4/KIR2DL4 | 91 |
| GO:0002460 | adaptive immune response based on somatic recombination of immune receptors built from immunoglobulin superfamily domains | 192/3662 | 371/15509 | 1.51397e-32 | 2.46936e-30 | 1.48503e-30 | TMEM98/CD4/BTK/HFE/SLC11A1/CD74/TNFRSF1B/PARP3/FOXP3/FCGR2B/TBX21/MLH1/IL4R/PTPRC/P2RX7/ICAM1/MSH2/IL12RB1/CD40/SMAD7/TLR8/CD40LG/IL21R/NBN/FCER2/LILRB1/IL27RA/CLC/TGFB1/JAK3/AHR/EXOSC3/GATA3/PPP3CB/C1QBP/NSD2/CTSC/HPX/CD81/AICDA/IL12B/IL4/BCL6/TNFAIP3/ARG1/CLU/CD80/SHLD2/PKN1/IL1B/CD70/C3/FOXJ1/NECTIN2/NDFIP1/EPHB2/IL6/HLX/IL10/TLR4/IRF4/IL18BP/SLC15A4/NOTCH1/IL18/MR1/CD8A/CXCL13/CD1A/CD1C/CD1B/IL6R/TNFSF13/PRKCD/MBL2/NOD2/FADD/INPP5D/CCL19/LIG4/HRAS/CD19/CD28/HLA-DQB1/PRF1/MICA/BTN3A2/LILRB4/CARD9/ZP3/HMGB1/CD55/HLA-DQA1/ENTPD7/MTOR/CR1/HLA-DOA/TAP2/TNF/HLA-E/HLA-G/TAP2/HLA-DQB1/TAP2/HLA-DQA1/HLA-DQB1/HLA-DQA1/HLA-DRA/TNF/HLA-B/HLA-E/HLA-A/HLA-A/HLA-G/HLA-DPB1/TAP2/HLA-B/HLA-DQA1/HLA-DPB1/LTA/TNF/HLA-A/HLA-A/HLA-B/HLA-DQA1/HLA-E/HLA-DQB1/HLA-DQA1/TAP2/LTA/HLA-DPB1/HLA-A/HLA-DRA/HLA-DQA1/TNF/TAP2/TNF/HLA-B/TNF/HLA-DRA/HLA-A/HLA-E/HLA-DPB1/TNF/HLA-E/LTA/HLA-G/HLA-DPB1/HLA-DPB1/HLA-DRB4/MICA/HLA-DQB1/HLA-DPA1/LTA/HLA-DQA1/HLA-A/HLA-DQB1/HLA-DQA1/HLA-B/TAP2/TNF/MICA/HLA-G/HLA-DQA1/HLA-DQB1/HLA-E/HLA-DRA/MICA/HLA-G/HLA-A/HLA-G/HLA-DQA1/HLA-E/HLA-DPB1/HLA-G/HLA-DQA1/TAP2/HLA-DPB1/LTA/HLA-DQA1/PTPRC/B2M/LILRB1/LILRB4/HLA-G/LILRB1/LILRB1/HLA-DRA/LILRB1/LILRB4/LILRB4/INPP5D | 192 |
| GO:0002683 | negative regulation of immune system process | 224/3662 | 469/15509 | 4.11086e-31 | 6.5331e-29 | 3.92889e-29 | BTK/HFE/TYROBP/CD22/LTF/SNAI2/CD74/RUNX3/HMGB3/GRN/PARP3/FOXP3/SPI1/CBFB/FCGR2B/TBX21/MKRN2/IL4R/ARG2/PTPRC/PIBF1/CD59/CTSG/HCK/SMAD7/ACP5/SFRP1/LILRB1/IL27RA/TGFB1/JAK3/AHR/AMBP/CXCL12/PPP3CB/CCL2/LPXN/MDK/MAPK14/HSPA9/IL12B/IL4/BCL6/CD86/ID2/PADI2/CD160/TNFAIP3/ARG1/GPAM/IAPP/CD80/INHBA/PKN1/NR1D1/LRRC17/TWSG1/CD68/FOXJ1/NDFIP1/RARA/PIAS3/SYT11/SFTPD/PTPN22/IL2RA/HLX/IL10/TLR4/CCN3/CCL21/THBS1/CYP19A1/TMBIM6/CUL4A/FURIN/ARRB2/DUSP10/PARP1/TCTA/SLIT2/PLK2/PIK3R1/TNFRSF21/MERTK/CD96/APPL1/TSC22D3/RUNX1/PSMB4/NLRX1/ALOX15/FCRLB/CTLA4/CASP3/TLR3/SHH/TNFRSF11B/GPER1/SYK/NOD2/PRDX2/FADD/CX3CR1/INPP5D/LGALS9/SERPINB9/CEBPB/GPR137/GLMN/RAG2/BANF1/PTPN2/A2M/ADIPOQ/PLCB1/MICA/SOCS1/YTHDF3/PRG2/LILRB4/CNR2/KIR2DL4/HMGB1/CD55/CD47/SRC/DPP4/PDCD1LG2/NRARP/CR1/MAFB/ZDHHC18/HLA-DOA/TNF/HLA-E/HLA-G/TNF/HLA-B/HLA-E/HLA-A/HLA-A/HLA-G/HLA-B/TNF/HLA-A/HLA-A/HLA-B/HLA-E/HLA-A/TNF/TNF/HLA-B/TNF/HLA-A/HLA-E/TNF/HLA-E/HLA-G/MICA/HLA-A/HLA-B/TNF/MICA/HLA-G/HLA-E/MICA/HLA-G/HLA-A/HLA-G/HLA-E/HLA-G/TNFRSF13B/CEBPA/PTPRC/KIR2DL4/KIR2DL4/KIR2DL4/KIR2DL4/KIR2DL4/LILRB1/KIR2DL4/KIR2DL4/KIR2DL4/KIR2DL4/KIR2DL4/KIR2DL4/KIR2DL4/KIR2DL4/LILRB4/KIR2DL4/HLA-G/LILRB1/MIF/KIR2DL4/KIR2DL4/KIR2DL4/LILRB1/KIR2DL4/KIR2DL4/KIR2DL4/KIR2DL4/LILRB1/KIR2DL4/KIR2DL4/KIR2DL4/KIR2DL4/LILRB4/KIR2DL4/LILRB4/KIR2DL4/INPP5D/KIR2DL4/KIR2DL4/KIR2DL4/KIR2DL4/KIR2DL4/KIR2DL4/KIR2DL4/KIR2DL4/KIR2DL4/KIR2DL4/PTEN/ITCH | 224 |
| GO:0002720 | positive regulation of cytokine production involved in immune response | 95/3662 | 135/15509 | 1.05248e-30 | 1.63081e-28 | 9.80741e-29 | CD74/TBX21/DDX1/MAVS/P2RX7/PYCARD/LILRB1/NOD1/GATA3/CD81/IL4/WNT5A/CD160/NR4A3/IL1B/CD36/IL6/TLR4/IL18/KIT/MAPKAPK2/TLR3/SYK/NOD2/LACC1/CARD9/KIR2DL4/CD55/TLR7/HLA-E/HLA-G/HLA-E/HLA-A/HLA-A/HLA-G/HLA-A/HLA-A/HLA-E/HLA-A/HLA-A/HLA-E/HLA-E/HLA-G/HLA-A/HLA-G/HLA-E/HLA-G/HLA-A/HLA-G/HLA-E/HLA-G/KIR2DL4/B2M/KIR2DL4/KIR2DL4/KIR2DL4/KIR2DL4/LILRB1/KIR2DL4/KIR2DL4/KIR2DL4/KIR2DL4/KIR2DL4/KIR2DL4/KIR2DL4/KIR2DL4/KIR2DL4/HLA-G/LILRB1/MIF/KIR2DL4/KIR2DL4/KIR2DL4/LILRB1/KIR2DL4/KIR2DL4/KIR2DL4/KIR2DL4/LILRB1/KIR2DL4/KIR2DL4/KIR2DL4/KIR2DL4/KIR2DL4/KIR2DL4/KIR2DL4/KIR2DL4/KIR2DL4/KIR2DL4/KIR2DL4/KIR2DL4/KIR2DL4/KIR2DL4/KIR2DL4/KIR2DL4 | 95 |
| GO:0002370 | natural killer cell cytokine production | 55/3662 | 59/15509 | 3.91638e-30 | 5.77946e-28 | 3.47567e-28 | CD160/CD96/KIR2DL4/HLA-E/HLA-G/HLA-E/HLA-G/HLA-E/HLA-E/HLA-E/HLA-G/HLA-G/HLA-E/HLA-G/HLA-G/HLA-E/HLA-G/KIR2DL4/KIR2DL4/KIR2DL4/KIR2DL4/KIR2DL4/KIR2DL4/KIR2DL4/KIR2DL4/KIR2DL4/KIR2DL4/KIR2DL4/KIR2DL4/KIR2DL4/KIR2DL4/HLA-G/KIR2DL4/KIR2DL4/KIR2DL4/KIR2DL4/KIR2DL4/KIR2DL4/KIR2DL4/KIR2DL4/KIR2DL4/KIR2DL4/KIR2DL4/KIR2DL4/KIR2DL4/KIR2DL4/KIR2DL4/KIR2DL4/KIR2DL4/KIR2DL4/KIR2DL4/KIR2DL4/KIR2DL4/KIR2DL4/KIR2DL4 | 55 |
| GO:0002727 | regulation of natural killer cell cytokine production | 55/3662 | 59/15509 | 3.91638e-30 | 5.77946e-28 | 3.47567e-28 | CD160/CD96/KIR2DL4/HLA-E/HLA-G/HLA-E/HLA-G/HLA-E/HLA-E/HLA-E/HLA-G/HLA-G/HLA-E/HLA-G/HLA-G/HLA-E/HLA-G/KIR2DL4/KIR2DL4/KIR2DL4/KIR2DL4/KIR2DL4/KIR2DL4/KIR2DL4/KIR2DL4/KIR2DL4/KIR2DL4/KIR2DL4/KIR2DL4/KIR2DL4/KIR2DL4/HLA-G/KIR2DL4/KIR2DL4/KIR2DL4/KIR2DL4/KIR2DL4/KIR2DL4/KIR2DL4/KIR2DL4/KIR2DL4/KIR2DL4/KIR2DL4/KIR2DL4/KIR2DL4/KIR2DL4/KIR2DL4/KIR2DL4/KIR2DL4/KIR2DL4/KIR2DL4/KIR2DL4/KIR2DL4/KIR2DL4/KIR2DL4 | 55 |
| GO:1902105 | regulation of leukocyte differentiation | 163/3662 | 304/15509 | 4.26102e-30 | 6.14181e-28 | 3.69358e-28 | BAD/CD4/BTK/TYROBP/LTF/CD74/RUNX3/HMGB3/ARID1B/FOXP3/PRDM1/AP3D1/RHOA/CBFB/TFE3/FCGR2B/TBX21/GLI2/ACTB/IL4R/PTPRC/IL12RB1/ABL1/SMARCB1/XBP1/ACIN1/RASSF2/SMAD7/SFRP1/IL7/LILRB1/TGFB1/JAK3/GATA3/ZMIZ1/SMARCD2/ZBTB16/MDK/IFNG/NEDD9/IL17A/IL12B/IL4/IL5/BCL6/CD86/ZAP70/ID2/ARID1A/MYB/FOXO3/IAPP/CD80/INHBA/SOX4/TNFSF9/LIF/LRRC17/FOXJ1/NDFIP1/RARA/PIAS3/AP3B1/NOTCH2/IL2RA/HLX/IL10/TLR4/IRF4/RB1/CUL4A/SOD1/DUSP10/TCTA/PIK3R1/IL2RG/ZEB1/IL18/POU4F2/POU4F1/ZFP36L2/PRKCA/KLF10/MMP14/RUNX1/TGFBR2/CTLA4/PF4/SLC9B2/TLR3/SHH/TNFRSF11B/SYK/BRD7/RAG1/PRDX2/FADD/RHOH/INPP5D/LGALS9/PRELID1/FOS/CEBPB/CCL19/KAT5/ESRRA/GPR137/STAT5B/RAG2/PTPN2/CD28/CTNNBIP1/ADIPOQ/KLHL25/CSF1/SOCS1/ZFP36L1/LILRB4/ARID2/HMGB1/NRARP/MTOR/PNP/CR1/MAFB/HLA-DOA/TNF/HLA-G/HLA-DRA/TNF/HLA-B/HLA-G/HLA-B/TNF/HLA-B/HLA-DRA/TNF/TNF/HLA-B/TNF/HLA-DRA/TNF/HLA-G/HLA-B/TNF/HLA-G/HLA-DRA/HLA-G/HLA-G/HLA-G/PRKDC/PTPRC/LILRB1/SMARCB1/LILRB4/HLA-G/LILRB1/LILRB1/HLA-DRA/LILRB1/LILRB4/LILRB4/INPP5D | 163 |
| GO:0002729 | positive regulation of natural killer cell cytokine production | 54/3662 | 58/15509 | 1.56409e-29 | 2.20323e-27 | 1.32499e-27 | CD160/KIR2DL4/HLA-E/HLA-G/HLA-E/HLA-G/HLA-E/HLA-E/HLA-E/HLA-G/HLA-G/HLA-E/HLA-G/HLA-G/HLA-E/HLA-G/KIR2DL4/KIR2DL4/KIR2DL4/KIR2DL4/KIR2DL4/KIR2DL4/KIR2DL4/KIR2DL4/KIR2DL4/KIR2DL4/KIR2DL4/KIR2DL4/KIR2DL4/KIR2DL4/HLA-G/KIR2DL4/KIR2DL4/KIR2DL4/KIR2DL4/KIR2DL4/KIR2DL4/KIR2DL4/KIR2DL4/KIR2DL4/KIR2DL4/KIR2DL4/KIR2DL4/KIR2DL4/KIR2DL4/KIR2DL4/KIR2DL4/KIR2DL4/KIR2DL4/KIR2DL4/KIR2DL4/KIR2DL4/KIR2DL4/KIR2DL4 | 54 |
| GO:0002832 | negative regulation of response to biotic stimulus | 111/3662 | 176/15509 | 4.53432e-29 | 6.24527e-27 | 3.75579e-27 | LTF/GRN/FOXP3/SIRT2/ARG2/RIOK3/LILRB1/AHR/C1QBP/TNFAIP3/ARG1/PPM1B/TARBP2/ARRB2/DUSP10/PARP1/CD96/NLRX1/HTRA1/PRDX2/LGALS9/SERPINB9/BANF1/PTPN2/A2M/MICA/SIGIRR/YTHDF3/KIR2DL4/PCBP2/CR1/ZDHHC18/HLA-E/HLA-G/MICB/HLA-B/HLA-E/HLA-A/HLA-A/HLA-G/HLA-B/HLA-A/HLA-A/MICB/HLA-B/HLA-E/HLA-A/MICB/HLA-B/HLA-A/HLA-E/HLA-E/HLA-G/MICB/MICA/MICB/HLA-A/HLA-B/MICA/HLA-G/HLA-E/MICA/HLA-G/HLA-A/HLA-G/HLA-E/HLA-G/MICB/KIR2DL4/KIR2DL4/KIR2DL4/KIR2DL4/KIR2DL4/LILRB1/KIR2DL4/KIR2DL4/KIR2DL4/KIR2DL4/KIR2DL4/KIR2DL4/KIR2DL4/KIR2DL4/KIR2DL4/HLA-G/LILRB1/KIR2DL4/KIR2DL4/KIR2DL4/LILRB1/KIR2DL4/KIR2DL4/KIR2DL4/KIR2DL4/LILRB1/KIR2DL4/KIR2DL4/KIR2DL4/KIR2DL4/KIR2DL4/KIR2DL4/KIR2DL4/KIR2DL4/KIR2DL4/KIR2DL4/KIR2DL4/KIR2DL4/KIR2DL4/KIR2DL4/KIR2DL4/KIR2DL4/ITCH | 111 |
| GO:0019882 | antigen processing and presentation | 106/3662 | 165/15509 | 8.18936e-29 | 1.10343e-26 | 6.63582e-27 | HFE/SLC11A1/CD74/AP3D1/FCGR2B/RAB10/ICAM1/PSME1/PYCARD/NOD1/RAB32/CCR7/CD68/AP3B1/ARL8B/CCL21/THBS1/MR1/CD8A/CD1A/CD1C/CD1B/ERAP2/NOD2/TAP1/CCL19/CALR/HLA-DQB1/HLA-DQA1/HLA-DOA/TAP2/HLA-E/HLA-G/TAP2/HLA-DQB1/TAP1/TAP2/HLA-DQA1/HLA-DQB1/HLA-DQA1/HLA-DRA/HLA-B/HLA-E/HLA-A/HLA-A/HLA-G/HLA-DPB1/TAP2/HLA-B/HLA-DQA1/HLA-DPB1/HLA-A/TAP1/HLA-A/HLA-B/HLA-DQA1/HLA-E/HLA-DQB1/HLA-DQA1/TAP2/TAP1/HLA-DPB1/HLA-A/TAP1/HLA-DRA/HLA-DQA1/TAP2/HLA-B/HLA-DRA/HLA-A/HLA-E/HLA-DPB1/HLA-E/HLA-G/TAP1/HLA-DPB1/HLA-DPB1/HLA-DRB4/HLA-DQB1/HLA-DPA1/HLA-DQA1/HLA-A/TAPBP/HLA-DQB1/HLA-DQA1/HLA-B/TAP2/HLA-G/HLA-DQA1/HLA-DQB1/HLA-E/HLA-DRA/HLA-G/HLA-A/HLA-G/HLA-DQA1/HLA-E/HLA-DPB1/HLA-G/HLA-DQA1/TAP2/HLA-DPB1/HLA-DQA1/B2M/HLA-G/HLA-DRA | 106 |
| GO:0050777 | negative regulation of immune response | 135/3662 | 240/15509 | 7.42469e-28 | 9.79111e-26 | 5.8882e-26 | HFE/GRN/PARP3/FOXP3/SPI1/FCGR2B/TBX21/MKRN2/IL4R/ARG2/PTPRC/CD59/HCK/SMAD7/LILRB1/IL27RA/JAK3/AHR/AMBP/PPP3CB/MAPK14/IL12B/IL4/BCL6/CD160/TNFAIP3/ARG1/FOXJ1/NDFIP1/HLX/IL10/FURIN/ARRB2/DUSP10/PARP1/PLK2/CD96/PSMB4/NLRX1/ALOX15/FCRLB/CTLA4/SYK/NOD2/INPP5D/LGALS9/SERPINB9/BANF1/PTPN2/A2M/MICA/YTHDF3/LILRB4/KIR2DL4/CD55/SRC/CR1/ZDHHC18/HLA-E/HLA-G/HLA-B/HLA-E/HLA-A/HLA-A/HLA-G/HLA-B/HLA-A/HLA-A/HLA-B/HLA-E/HLA-A/HLA-B/HLA-A/HLA-E/HLA-E/HLA-G/MICA/HLA-A/HLA-B/MICA/HLA-G/HLA-E/MICA/HLA-G/HLA-A/HLA-G/HLA-E/HLA-G/PTPRC/KIR2DL4/KIR2DL4/KIR2DL4/KIR2DL4/KIR2DL4/LILRB1/KIR2DL4/KIR2DL4/KIR2DL4/KIR2DL4/KIR2DL4/KIR2DL4/KIR2DL4/KIR2DL4/LILRB4/KIR2DL4/HLA-G/LILRB1/KIR2DL4/KIR2DL4/KIR2DL4/LILRB1/KIR2DL4/KIR2DL4/KIR2DL4/KIR2DL4/LILRB1/KIR2DL4/KIR2DL4/KIR2DL4/KIR2DL4/LILRB4/KIR2DL4/LILRB4/KIR2DL4/INPP5D/KIR2DL4/KIR2DL4/KIR2DL4/KIR2DL4/KIR2DL4/KIR2DL4/KIR2DL4/KIR2DL4/KIR2DL4/KIR2DL4 | 135 |
| GO:0002822 | regulation of adaptive immune response based on somatic recombination of immune receptors built from immunoglobulin superfamily domains | 127/3662 | 220/15509 | 9.83664e-28 | 1.27016e-25 | 7.6385e-26 | CD4/BTK/HFE/SLC11A1/TNFRSF1B/PARP3/FOXP3/FCGR2B/TBX21/MLH1/IL4R/PTPRC/P2RX7/MSH2/IL12RB1/CD40/SMAD7/FCER2/LILRB1/IL27RA/CLC/TGFB1/JAK3/AHR/EXOSC3/GATA3/PPP3CB/NSD2/HPX/CD81/IL12B/IL4/BCL6/TNFAIP3/ARG1/CD80/SHLD2/PKN1/IL1B/C3/FOXJ1/NECTIN2/NDFIP1/EPHB2/IL6/HLX/IL10/SLC15A4/IL18/MR1/CD1A/CD1C/CD1B/TNFSF13/NOD2/FADD/CCL19/CD28/LILRB4/CARD9/ZP3/HMGB1/CD55/CR1/TAP2/TNF/HLA-E/HLA-G/TAP2/TAP2/HLA-DRA/TNF/HLA-B/HLA-E/HLA-A/HLA-A/HLA-G/TAP2/HLA-B/LTA/TNF/HLA-A/HLA-A/HLA-B/HLA-E/TAP2/LTA/HLA-A/HLA-DRA/TNF/TAP2/TNF/HLA-B/TNF/HLA-DRA/HLA-A/HLA-E/TNF/HLA-E/LTA/HLA-G/LTA/HLA-A/HLA-B/TAP2/TNF/HLA-G/HLA-E/HLA-DRA/HLA-G/HLA-A/HLA-G/HLA-E/HLA-G/TAP2/LTA/PTPRC/B2M/LILRB1/LILRB4/HLA-G/LILRB1/LILRB1/HLA-DRA/LILRB1/LILRB4/LILRB4 | 127 |
| GO:0002819 | regulation of adaptive immune response | 132/3662 | 234/15509 | 1.99237e-27 | 2.52015e-25 | 1.51557e-25 | CD4/BTK/HFE/SLC11A1/TNFRSF1B/PARP3/FOXP3/FCGR2B/TBX21/MLH1/IL4R/PTPRC/P2RX7/MSH2/IL12RB1/CD40/SMAD7/PYCARD/FCER2/LILRB1/IL27RA/CLC/TGFB1/JAK3/AHR/EXOSC3/GATA3/PPP3CB/NSD2/HPX/CD81/IL12B/IL4/BCL6/CD160/TNFAIP3/ARG1/CD80/SHLD2/PKN1/IL1B/C3/FOXJ1/NECTIN2/NDFIP1/EPHB2/AKIRIN2/IL6/HLX/IL10/SLC15A4/DUSP10/IL18/MR1/CD1A/CD1C/CD1B/ALOX15/TNFSF13/NOD2/FADD/CCL19/CD28/LILRB4/CARD9/ZP3/HMGB1/CD55/CR1/TAP2/TNF/HLA-E/HLA-G/TAP2/TAP2/HLA-DRA/TNF/HLA-B/HLA-E/HLA-A/HLA-A/HLA-G/TAP2/HLA-B/LTA/TNF/HLA-A/HLA-A/HLA-B/HLA-E/TAP2/LTA/HLA-A/HLA-DRA/TNF/TAP2/TNF/HLA-B/TNF/HLA-DRA/HLA-A/HLA-E/TNF/HLA-E/LTA/HLA-G/LTA/HLA-A/HLA-B/TAP2/TNF/HLA-G/HLA-E/HLA-DRA/HLA-G/HLA-A/HLA-G/HLA-E/HLA-G/TAP2/LTA/PTPRC/B2M/LILRB1/LILRB4/HLA-G/LILRB1/LILRB1/HLA-DRA/LILRB1/LILRB4/LILRB4 | 132 |
| GO:0048002 | antigen processing and presentation of peptide antigen | 88/3662 | 128/15509 | 2.33411e-27 | 2.89337e-25 | 1.74002e-25 | HFE/SLC11A1/CD74/FCGR2B/PYCARD/MR1/ERAP2/TAP1/CALR/HLA-DQB1/HLA-DQA1/HLA-DOA/TAP2/HLA-E/HLA-G/TAP2/HLA-DQB1/TAP1/TAP2/HLA-DQA1/HLA-DQB1/HLA-DQA1/HLA-DRA/HLA-B/HLA-E/HLA-A/HLA-A/HLA-G/HLA-DPB1/TAP2/HLA-B/HLA-DQA1/HLA-DPB1/HLA-A/TAP1/HLA-A/HLA-B/HLA-DQA1/HLA-E/HLA-DQB1/HLA-DQA1/TAP2/TAP1/HLA-DPB1/HLA-A/TAP1/HLA-DRA/HLA-DQA1/TAP2/HLA-B/HLA-DRA/HLA-A/HLA-E/HLA-DPB1/HLA-E/HLA-G/TAP1/HLA-DPB1/HLA-DPB1/HLA-DRB4/HLA-DQB1/HLA-DPA1/HLA-DQA1/HLA-A/TAPBP/HLA-DQB1/HLA-DQA1/HLA-B/TAP2/HLA-G/HLA-DQA1/HLA-DQB1/HLA-E/HLA-DRA/HLA-G/HLA-A/HLA-G/HLA-DQA1/HLA-E/HLA-DPB1/HLA-G/HLA-DQA1/TAP2/HLA-DPB1/HLA-DQA1/B2M/HLA-G/HLA-DRA | 88 |
| GO:1902107 | positive regulation of leukocyte differentiation | 112/3662 | 185/15509 | 4.48692e-27 | 5.34806e-25 | 3.21623e-25 | BAD/CD4/BTK/TYROBP/CD74/RUNX3/ARID1B/FOXP3/AP3D1/RHOA/CBFB/GLI2/ACTB/IL4R/PTPRC/IL12RB1/SMARCB1/XBP1/ACIN1/IL7/TGFB1/GATA3/ZMIZ1/SMARCD2/ZBTB16/MDK/IFNG/NEDD9/IL17A/IL12B/IL4/IL5/BCL6/CD86/ZAP70/ID2/ARID1A/MYB/FOXO3/CD80/SOX4/TNFSF9/LIF/RARA/AP3B1/NOTCH2/IL2RA/HLX/IL10/RB1/DUSP10/IL2RG/IL18/POU4F2/POU4F1/PRKCA/KLF10/MMP14/RUNX1/TGFBR2/PF4/SLC9B2/SHH/SYK/BRD7/RAG1/FADD/RHOH/INPP5D/LGALS9/FOS/CCL19/KAT5/STAT5B/CTNNBIP1/KLHL25/CSF1/SOCS1/ZFP36L1/LILRB4/ARID2/HMGB1/PNP/CR1/TNF/HLA-G/HLA-DRA/TNF/HLA-G/TNF/HLA-DRA/TNF/TNF/TNF/HLA-DRA/TNF/HLA-G/TNF/HLA-G/HLA-DRA/HLA-G/HLA-G/HLA-G/PRKDC/PTPRC/SMARCB1/LILRB4/HLA-G/HLA-DRA/LILRB4/LILRB4/INPP5D | 112 |
| GO:1903708 | positive regulation of hemopoiesis | 112/3662 | 185/15509 | 4.48692e-27 | 5.34806e-25 | 3.21623e-25 | BAD/CD4/BTK/TYROBP/CD74/RUNX3/ARID1B/FOXP3/AP3D1/RHOA/CBFB/GLI2/ACTB/IL4R/PTPRC/IL12RB1/SMARCB1/XBP1/ACIN1/IL7/TGFB1/GATA3/ZMIZ1/SMARCD2/ZBTB16/MDK/IFNG/NEDD9/IL17A/IL12B/IL4/IL5/BCL6/CD86/ZAP70/ID2/ARID1A/MYB/FOXO3/CD80/SOX4/TNFSF9/LIF/RARA/AP3B1/NOTCH2/IL2RA/HLX/IL10/RB1/DUSP10/IL2RG/IL18/POU4F2/POU4F1/PRKCA/KLF10/MMP14/RUNX1/TGFBR2/PF4/SLC9B2/SHH/SYK/BRD7/RAG1/FADD/RHOH/INPP5D/LGALS9/FOS/CCL19/KAT5/STAT5B/CTNNBIP1/KLHL25/CSF1/SOCS1/ZFP36L1/LILRB4/ARID2/HMGB1/PNP/CR1/TNF/HLA-G/HLA-DRA/TNF/HLA-G/TNF/HLA-DRA/TNF/TNF/TNF/HLA-DRA/TNF/HLA-G/TNF/HLA-G/HLA-DRA/HLA-G/HLA-G/HLA-G/PRKDC/PTPRC/SMARCB1/LILRB4/HLA-G/HLA-DRA/LILRB4/LILRB4/INPP5D | 112 |
| GO:0045824 | negative regulation of innate immune response | 91/3662 | 138/15509 | 3.65018e-26 | 4.26865e-24 | 2.56709e-24 | GRN/LILRB1/TNFAIP3/ARG1/ARRB2/DUSP10/PARP1/CD96/NLRX1/LGALS9/SERPINB9/BANF1/PTPN2/A2M/MICA/YTHDF3/KIR2DL4/CR1/ZDHHC18/HLA-E/HLA-G/HLA-B/HLA-E/HLA-A/HLA-A/HLA-G/HLA-B/HLA-A/HLA-A/HLA-B/HLA-E/HLA-A/HLA-B/HLA-A/HLA-E/HLA-E/HLA-G/MICA/HLA-A/HLA-B/MICA/HLA-G/HLA-E/MICA/HLA-G/HLA-A/HLA-G/HLA-E/HLA-G/KIR2DL4/KIR2DL4/KIR2DL4/KIR2DL4/KIR2DL4/LILRB1/KIR2DL4/KIR2DL4/KIR2DL4/KIR2DL4/KIR2DL4/KIR2DL4/KIR2DL4/KIR2DL4/KIR2DL4/HLA-G/LILRB1/KIR2DL4/KIR2DL4/KIR2DL4/LILRB1/KIR2DL4/KIR2DL4/KIR2DL4/KIR2DL4/LILRB1/KIR2DL4/KIR2DL4/KIR2DL4/KIR2DL4/KIR2DL4/KIR2DL4/KIR2DL4/KIR2DL4/KIR2DL4/KIR2DL4/KIR2DL4/KIR2DL4/KIR2DL4/KIR2DL4/KIR2DL4/KIR2DL4 | 91 |
| GO:0030099 | myeloid cell differentiation | 182/3662 | 377/15509 | 3.86899e-26 | 4.44074e-24 | 2.67058e-24 | SLC4A1/KMT2E/PAF1/SCIN/PAFAH1B1/CD4/TYROBP/LTF/UFL1/CD74/ALAS1/HMGB3/GAB2/KCNQ1/HIPK2/SPI1/CBFB/TFE3/CDC42/WDR1/ATP6AP1/HOXA9/OSTM1/PIR/CEBPE/MYH9/ACIN1/DHRS2/NFKBIA/MMP9/RASSF2/GATA1/SFRP1/ERCC2/LILRB1/TGFB1/KLF1/JAK3/HOXA5/GATA3/SH3PXD2A/CSF3/ZBTB16/CD81/SLC11A2/SH2B3/IFNG/NEDD9/MAPK14/RHAG/IL17A/HSPA9/IL12B/IL4/IL5/SMAD5/BCL6/STAT1/ID2/EPAS1/MPL/MYB/FOXO3/PTBP3/CSF3R/PTK2B/IAPP/INHBA/THRA/CCR7/PRMT1/ZFP36/LIF/LRRC17/CBFA2T3/EPO/NDFIP1/RARA/PIAS3/AP3B1/TSPAN2/NOTCH2/ABCB10/IREB2/TLR4/IRF4/RB1/CUL4A/SKIC8/IRF8/TNFRSF11A/APP/EPHA2/ARNT/DYRK3/PARP1/LBR/MEIS1/TCTA/PIK3R1/PURB/NCAPG2/POU4F2/POU4F1/PRKCA/GABPA/KLF10/KIT/ALAS2/DMTN/RUNX1/ZNF385A/TAL1/RBM15/TGFBR2/PF4/BAP1/SLC9B2/CASP3/TLR3/CSF2/SFXN1/TNFRSF11B/EPB42/FADD/RBPJ/INPP5D/AHSP/FOS/CEBPB/CCL19/RARG/ESRRA/GPR137/STAT5B/PTPN2/JUN/FAM20C/MAF/CTNNBIP1/PTPN11/ADIPOQ/CSF1R/ANXA2/CSF1/CIB1/SOCS1/ZFP36L1/CDIN1/LILRB4/PRTN3/SRC/NCOA6/MTOR/L3MBTL3/MAFB/TNF/TNF/TNF/TNF/TNF/TNF/TNF/TNF/EIF6/CEBPA/PRKDC/H4C15/H4C14/H4C12/B2M/LILRB1/LILRB4/LILRB1/H4C5/LILRB1/H4C4/PRTN3/LILRB1/LILRB4/LILRB4/INPP5D | 182 |
| GO:0031348 | negative regulation of defense response | 152/3662 | 294/15509 | 6.43371e-26 | 7.25021e-24 | 4.36015e-24 | IGF1/HGF/TNFRSF1B/GRN/FOXP3/SIRT2/VPS35/FCGR2B/MKRN2/ARG2/PTPRC/HCK/RIOK3/ACP5/MEFV/LILRB1/HAMP/GATA3/C1QBP/MDK/MVK/PPARD/MAPK14/IL12B/IL4/ASH1L/TNFAIP3/ARG1/TEK/NR1D1/ZFP36/APOE/NDFIP1/SYT11/IL2RA/NT5E/IL10/CCN3/CYP19A1/PPM1B/TARBP2/RB1/FURIN/ARRB2/SOD1/DUSP10/PARP1/PLK2/CD96/PSMB4/NLRX1/PRKCD/GPER1/SYK/HTRA1/NOD2/LGALS9/SERPINB9/BANF1/PTPN2/A2M/ADIPOQ/MICA/YTHDF3/CNR2/KIR2DL4/PCBP2/SRC/ELANE/CR1/ZDHHC18/HLA-E/HLA-G/MICB/HLA-B/HLA-E/HLA-A/HLA-A/HLA-G/HLA-B/HLA-A/HLA-A/MICB/HLA-B/HLA-E/HLA-A/MICB/HLA-B/HLA-A/HLA-E/HLA-E/HLA-G/MICB/MICA/MICB/HLA-A/HLA-B/MICA/HLA-G/HLA-E/MICA/HLA-G/HLA-A/HLA-G/HLA-E/HLA-G/MICB/PTPRC/KIR2DL4/KIR2DL4/KIR2DL4/KIR2DL4/KIR2DL4/LILRB1/KIR2DL4/KIR2DL4/KIR2DL4/KIR2DL4/KIR2DL4/KIR2DL4/KIR2DL4/KIR2DL4/KIR2DL4/HLA-G/LILRB1/KIR2DL4/KIR2DL4/KIR2DL4/LILRB1/KIR2DL4/KIR2DL4/KIR2DL4/ELANE/KIR2DL4/LILRB1/KIR2DL4/KIR2DL4/KIR2DL4/KIR2DL4/KIR2DL4/KIR2DL4/KIR2DL4/KIR2DL4/KIR2DL4/KIR2DL4/KIR2DL4/KIR2DL4/KIR2DL4/KIR2DL4/KIR2DL4/KIR2DL4/ITCH | 152 |
| GO:0002831 | regulation of response to biotic stimulus | 187/3662 | 396/15509 | 2.2762e-25 | 2.51927e-23 | 1.51504e-23 | TYROBP/LTF/BIRC3/GRN/FOXP3/CYBA/PUM2/SPI1/SIRT2/FCGR2B/UBE2K/XRCC5/ARG2/ZMPSTE24/MAVS/IL12RB1/HCK/RIOK3/TLR8/N4BP1/PYCARD/LILRB1/NOD1/AHR/C1QBP/HPX/IL17A/IL12B/IL4/WNT5A/STAT1/CD160/TNFAIP3/ARG1/IL1B/IRF3/NECTIN2/APOE/TRAF3/TRIM5/POLR3F/SYT11/PTPN22/CD36/AKIRIN2/TLR4/DDX60/PPM1B/HERC5/IL21/SLC15A4/TARBP2/ARRB2/DUSP10/PARP1/NONO/MR1/BMP6/CD96/PRKCA/GBP5/APPL1/NLRX1/SYK/MBL2/HTRA1/TRIM44/NOD2/PRDX2/FADD/POLR3D/LGALS9/TRIM56/CD14/SERPINB9/STAT5B/LEP/BANF1/PTPN2/A2M/PTPN11/PAK2/MICA/SIGIRR/SOCS1/YTHDF3/HEXIM1/CARD9/PLSCR1/KIR2DL4/HMGB1/CD55/DAPK1/PCBP2/SRC/CR1/ZDHHC18/HLA-E/HLA-G/MICB/HLA-B/HLA-E/HLA-A/HLA-A/HLA-G/HLA-B/NCR3/HLA-A/HLA-A/MICB/HLA-B/HLA-E/NCR3/HLA-A/MICB/HLA-B/HLA-A/HLA-E/HLA-E/HLA-G/MICB/MICA/MICB/HLA-A/HLA-B/MICA/HLA-G/HLA-E/MICA/HLA-G/HLA-A/HLA-G/NCR3/HLA-E/NCR3/NCR3/HLA-G/NCR3/MICB/PRKDC/LSM14A/CCL5/KIR2DL4/KIR2DL4/KIR2DL4/KIR2DL4/CCL5/KIR2DL4/LILRB1/KIR2DL4/KIR2DL4/KIR2DL4/KIR2DL4/KIR2DL4/KIR2DL4/KIR2DL4/KIR2DL4/KIR2DL4/HLA-G/LILRB1/MIF/KIR2DL4/KIR2DL4/KIR2DL4/LILRB1/KIR2DL4/KIR2DL4/KIR2DL4/KIR2DL4/LILRB1/KIR2DL4/KIR2DL4/KIR2DL4/KIR2DL4/KIR2DL4/KIR2DL4/KIR2DL4/KIR2DL4/KIR2DL4/KIR2DL4/KIR2DL4/KIR2DL4/KIR2DL4/KIR2DL4/KIR2DL4/KIR2DL4/ITCH | 187 |
| GO:0019884 | antigen processing and presentation of exogenous antigen | 75/3662 | 105/15509 | 3.56882e-25 | 3.88062e-23 | 2.33374e-23 | CD74/AP3D1/FCGR2B/PSME1/AP3B1/MR1/CD1A/CD1C/CD1B/TAP1/HLA-DQB1/HLA-DQA1/HLA-DOA/TAP2/HLA-E/TAP2/HLA-DQB1/TAP1/TAP2/HLA-DQA1/HLA-DQB1/HLA-DQA1/HLA-DRA/HLA-E/HLA-A/HLA-A/HLA-DPB1/TAP2/HLA-DQA1/HLA-DPB1/HLA-A/TAP1/HLA-A/HLA-DQA1/HLA-E/HLA-DQB1/HLA-DQA1/TAP2/TAP1/HLA-DPB1/HLA-A/TAP1/HLA-DRA/HLA-DQA1/TAP2/HLA-DRA/HLA-A/HLA-E/HLA-DPB1/HLA-E/TAP1/HLA-DPB1/HLA-DPB1/HLA-DRB4/HLA-DQB1/HLA-DPA1/HLA-DQA1/HLA-A/HLA-DQB1/HLA-DQA1/TAP2/HLA-DQA1/HLA-DQB1/HLA-E/HLA-DRA/HLA-A/HLA-DQA1/HLA-E/HLA-DPB1/HLA-DQA1/TAP2/HLA-DPB1/HLA-DQA1/B2M/HLA-DRA | 75 |
| GO:0032102 | negative regulation of response to external stimulus | 205/3662 | 453/15509 | 9.25024e-25 | 9.885e-23 | 5.94466e-23 | CD9/LTF/IGF1/HGF/TNFRSF1B/GRN/FOXP3/SIRT2/VPS35/NUCB2/FCGR2B/ST6GAL1/MKRN2/ARG2/PTPRC/APOH/ANGPT2/PDGFB/CHD8/HCK/RIOK3/ACP5/MEFV/PLAT/LILRB1/HAMP/SERPINE1/DVL1/GATA3/WNT3/C1QBP/CCL2/MDK/MVK/SH2B3/PPARD/MAPK14/IL12B/IL4/WNT5A/ASH1L/PADI2/NENF/TNFAIP3/ARG1/SPP1/TEK/NR1D1/ZFP36/APOE/NDFIP1/SYT11/IL2RA/PDGFRA/NT5E/SERPINE2/IL10/CCN3/KIAA0319/THBS1/CYP19A1/PPM1B/FGF2/TARBP2/RB1/BBS4/FURIN/ADAMTS18/ARRB2/SOD1/DUSP10/PARP1/SLIT2/PLK2/NOTCH1/CD96/CXCL13/PSMB4/NLRX1/WNT4/PRKCD/GPER1/NOS3/SYK/HTRA1/NOD2/PRDX2/SEMA4C/LGALS9/SEMA3E/SERPINB9/FGG/FGA/LEP/BANF1/PTPN2/A2M/F2/ADIPOQ/RGMA/ANXA2/MICA/SIGIRR/YTHDF3/CNR2/KIR2DL4/PCBP2/SRC/ELANE/DPP4/CR1/ZDHHC18/TNF/HLA-E/HLA-G/TNF/MICB/HLA-B/HLA-E/HLA-A/HLA-A/HLA-G/HLA-B/TNF/HLA-A/HLA-A/MICB/HLA-B/HLA-E/HLA-A/MICB/TNF/TNF/HLA-B/TNF/HLA-A/HLA-E/TNF/HLA-E/HLA-G/MICB/MICA/MICB/HLA-A/HLA-B/TNF/MICA/HLA-G/HLA-E/MICA/HLA-G/HLA-A/HLA-G/HLA-E/HLA-G/MICB/PTPRC/KIR2DL4/KIR2DL4/KIR2DL4/KIR2DL4/KIR2DL4/LILRB1/KIR2DL4/KIR2DL4/KIR2DL4/KIR2DL4/KIR2DL4/KIR2DL4/KIR2DL4/KIR2DL4/KIR2DL4/HLA-G/LILRB1/MIF/KIR2DL4/KIR2DL4/KIR2DL4/LILRB1/KIR2DL4/KIR2DL4/KIR2DL4/ELANE/WNT3/WNT3/KIR2DL4/LILRB1/KIR2DL4/KIR2DL4/KIR2DL4/KIR2DL4/KIR2DL4/KIR2DL4/KIR2DL4/KIR2DL4/KIR2DL4/KIR2DL4/KIR2DL4/KIR2DL4/KIR2DL4/KIR2DL4/KIR2DL4/KIR2DL4/PTEN/ITCH | 205 |
| GO:0032943 | mononuclear cell proliferation | 157/3662 | 314/15509 | 1.01678e-24 | 1.06813e-22 | 6.42357e-23 | CD38/BTK/TYROBP/CD22/IGF1/SLC11A1/CD74/BTN3A1/TNFRSF1B/FOXP3/FCGR2B/ST6GAL1/ARG2/PTPRC/BAX/P2RX7/IL12RB1/ABL1/CD40/NFATC2/ELF4/CD40LG/PYCARD/IL7/LILRB1/IL27RA/CLC/CD79A/JAK3/PIK3CG/AHR/TNFSF8/PPP3CB/CD81/CCND3/IL12B/IL4/IL5/BCL6/CD86/HES1/IL1A/ZAP70/IGFBP2/MPL/ARG1/GPAM/HELLS/CD80/FLT3/PKN1/CDKN1A/IL1B/TNFSF9/CD70/RAC2/TWSG1/FOXJ1/EPO/NDFIP1/EPHB2/SFTPD/PTPN22/IL2RA/IL6/IL10/TLR4/IL21/SLC7A1/ARMC5/TNFRSF21/MSN/IL18/MS4A1/TNFRSF13C/ICOSLG/WNT4/VCAM1/TGFBR2/SPTA1/CTLA4/PRKCD/CASP3/SHH/SYK/LMO1/PRDX2/FADD/INPP5D/LGALS9/BCL2L1/CEBPB/CCL19/STAT5B/LEP/GLMN/RAG2/CD19/CD28/CSF1/LILRB4/ZP3/HMGB1/CD55/PDCD1LG2/IFNA1/PNP/CR1/HLA-E/HLA-G/PSMB10/HLA-E/HLA-A/HLA-A/HLA-G/HLA-DPB1/HLA-DPB1/HLA-A/HLA-A/HLA-E/HLA-DPB1/HLA-A/HLA-A/HLA-E/HLA-DPB1/HLA-E/HLA-G/HLA-DPB1/HLA-DPB1/HLA-DPA1/HLA-A/HLA-G/HLA-E/HLA-G/HLA-A/HLA-G/HLA-E/HLA-DPB1/HLA-G/HLA-DPB1/TNFRSF13B/PTPRC/CCL5/CD24/CCL5/LILRB1/LILRB4/HLA-G/LILRB1/MIF/LILRB1/LILRB1/LILRB4/LILRB4/INPP5D/PTEN/ITCH | 157 |
| GO:0045088 | regulation of innate immune response | 146/3662 | 285/15509 | 2.03067e-24 | 2.09769e-22 | 1.26151e-22 | TYROBP/BIRC3/GRN/SPI1/FCGR2B/UBE2K/XRCC5/MAVS/HCK/RIOK3/TLR8/N4BP1/PYCARD/LILRB1/HPX/IL12B/WNT5A/CD160/TNFAIP3/ARG1/IRF3/NECTIN2/APOE/TRIM5/POLR3F/PTPN22/AKIRIN2/TLR4/IL21/SLC15A4/ARRB2/DUSP10/PARP1/NONO/CD96/GBP5/APPL1/NLRX1/SYK/MBL2/NOD2/FADD/POLR3D/LGALS9/TRIM56/SERPINB9/STAT5B/LEP/BANF1/PTPN2/A2M/PTPN11/PAK2/MICA/SOCS1/YTHDF3/HEXIM1/CARD9/PLSCR1/KIR2DL4/HMGB1/SRC/CR1/ZDHHC18/HLA-E/HLA-G/HLA-B/HLA-E/HLA-A/HLA-A/HLA-G/HLA-B/NCR3/HLA-A/HLA-A/HLA-B/HLA-E/NCR3/HLA-A/HLA-B/HLA-A/HLA-E/HLA-E/HLA-G/MICA/HLA-A/HLA-B/MICA/HLA-G/HLA-E/MICA/HLA-G/HLA-A/HLA-G/NCR3/HLA-E/NCR3/NCR3/HLA-G/NCR3/PRKDC/LSM14A/CCL5/KIR2DL4/KIR2DL4/KIR2DL4/KIR2DL4/CCL5/KIR2DL4/LILRB1/KIR2DL4/KIR2DL4/KIR2DL4/KIR2DL4/KIR2DL4/KIR2DL4/KIR2DL4/KIR2DL4/KIR2DL4/HLA-G/LILRB1/KIR2DL4/KIR2DL4/KIR2DL4/LILRB1/KIR2DL4/KIR2DL4/KIR2DL4/KIR2DL4/LILRB1/KIR2DL4/KIR2DL4/KIR2DL4/KIR2DL4/KIR2DL4/KIR2DL4/KIR2DL4/KIR2DL4/KIR2DL4/KIR2DL4/KIR2DL4/KIR2DL4/KIR2DL4/KIR2DL4/KIR2DL4/KIR2DL4 | 146 |
| GO:0046651 | lymphocyte proliferation | 154/3662 | 308/15509 | 2.86832e-24 | 2.9144e-22 | 1.75267e-22 | CD38/BTK/TYROBP/CD22/IGF1/SLC11A1/CD74/BTN3A1/TNFRSF1B/FOXP3/FCGR2B/ARG2/PTPRC/BAX/P2RX7/IL12RB1/ABL1/CD40/NFATC2/ELF4/CD40LG/PYCARD/IL7/LILRB1/IL27RA/CLC/CD79A/JAK3/PIK3CG/AHR/TNFSF8/PPP3CB/CD81/CCND3/IL12B/IL4/IL5/BCL6/CD86/HES1/IL1A/ZAP70/IGFBP2/MPL/ARG1/GPAM/HELLS/CD80/FLT3/PKN1/CDKN1A/IL1B/TNFSF9/CD70/RAC2/TWSG1/FOXJ1/EPO/NDFIP1/EPHB2/SFTPD/PTPN22/IL2RA/IL6/IL10/TLR4/IL21/SLC7A1/ARMC5/TNFRSF21/MSN/IL18/MS4A1/TNFRSF13C/ICOSLG/WNT4/VCAM1/TGFBR2/SPTA1/CTLA4/PRKCD/CASP3/SHH/SYK/LMO1/PRDX2/FADD/INPP5D/LGALS9/CEBPB/CCL19/STAT5B/LEP/GLMN/RAG2/CD19/CD28/LILRB4/ZP3/HMGB1/CD55/PDCD1LG2/IFNA1/PNP/CR1/HLA-E/HLA-G/PSMB10/HLA-E/HLA-A/HLA-A/HLA-G/HLA-DPB1/HLA-DPB1/HLA-A/HLA-A/HLA-E/HLA-DPB1/HLA-A/HLA-A/HLA-E/HLA-DPB1/HLA-E/HLA-G/HLA-DPB1/HLA-DPB1/HLA-DPA1/HLA-A/HLA-G/HLA-E/HLA-G/HLA-A/HLA-G/HLA-E/HLA-DPB1/HLA-G/HLA-DPB1/TNFRSF13B/PTPRC/CCL5/CD24/CCL5/LILRB1/LILRB4/HLA-G/LILRB1/MIF/LILRB1/LILRB1/LILRB4/LILRB4/INPP5D/PTEN/ITCH | 154 |
| GO:0043068 | positive regulation of programmed cell death | 212/3662 | 479/15509 | 4.78351e-24 | 4.78197e-22 | 2.87579e-22 | BAD/MAP3K9/SCIN/NOX1/TYROBP/FAS/TNFRSF1B/BAK1/GRN/AIFM2/CCAR1/NGFR/DDX20/MAP2K4/RHOA/HYAL2/SIRT2/TP63/TP73/PTPRC/STK17B/BAX/MMP2/DNM1L/P2RX7/ZNF268/ABL1/GADD45B/MMP9/CD40/MYBL2/BMP7/EEF1A2/RASSF2/SRPX/CD40LG/PYCARD/SFRP1/FCER2/TLE5/LILRB1/PDCD5/GSK3A/GSDME/HOXA5/CASP2/SFRP4/TGFBR1/MAPK8/SEPTIN4/C1QBP/CCL2/MAP2K6/CTSC/ZBTB16/VDR/IFNG/IL12B/PDGFRB/BCL6/WNT5A/ITGA4/PARK7/MFN2/GADD45A/CD160/FASLG/FOXO3/PTPA/IFIT2/CLU/TNFRSF10B/TNFRSF8/IAPP/TNFSF10/INHBA/NR4A1/CDKN1A/SOX4/EEF1E1/RBCK1/BMP2/PLAGL2/BECN1/STYXL1/IRF5/ALDH1A2/AKAP12/TOP2A/MYBBP1A/SERINC3/BTG1/RNF122/NOTCH2/APC/HRK/SRPK2/ITM2C/IL6/IL10/TFAP2A/MTCH1/THBS1/CYP1B1/ARRB2/SMAD4/PMAIP1/SOD1/CCN1/ADCY10/TP53BP2/PARP1/RHOB/TEX261/ARL6IP5/SLIT2/IGFBP3/GSN/NOTCH1/ITGB1/FOXO1/POU4F2/POU4F1/BCL2L11/PRMT2/RPL26/OMA1/PEA15/ATF3/CAPN2/FRZB/INHBB/ERCC3/CTLA4/RYBP/PRKCD/CASP3/TLR3/STK17A/GPER1/CDK5/TP53INP1/SYK/HTRA1/SLC27A4/FADD/INPP5D/LGALS9/PRELID1/ITGAM/KLF11/RARG/ATP2A2/LEP/DDIT3/PTPN2/FOSL1/CDK5R1/JUN/PAK2/PRF1/CXCR2/NQO1/ADIPOQ/PHLDA2/RBM10/CHEK2/FZD9/HMGB1/AKR1C3/TRPV1/DAPK1/IGF2R/SRC/MAP3K5/ATG7/NTRK1/TGM2/TNF/HLA-G/TNF/HLA-G/FIS1/LTA/TNF/LTA/TNF/TNF/TNF/TNF/LTA/HLA-G/LTA/TNF/HLA-G/HLA-G/HLA-G/HLA-G/LTA/PRKDC/PTPRC/TXNIP/CCL5/CCL5/LILRB1/HLA-G/LILRB1/LILRB1/LILRB1/INPP5D/SQSTM1/PTEN | 212 |
| GO:0042098 | T cell proliferation | 126/3662 | 233/15509 | 5.68349e-24 | 5.59147e-22 | 3.36261e-22 | IGF1/SLC11A1/BTN3A1/TNFRSF1B/FOXP3/ARG2/PTPRC/BAX/P2RX7/IL12RB1/ABL1/ELF4/CD40LG/PYCARD/LILRB1/IL27RA/CLC/JAK3/PIK3CG/TNFSF8/PPP3CB/CD81/CCND3/IL12B/IL4/BCL6/CD86/HES1/IL1A/ZAP70/IGFBP2/ARG1/GPAM/CD80/IL1B/TNFSF9/CD70/RAC2/TWSG1/FOXJ1/EPO/NDFIP1/SFTPD/PTPN22/IL2RA/IL6/IL10/IL21/SLC7A1/ARMC5/TNFRSF21/MSN/IL18/TNFRSF13C/ICOSLG/WNT4/VCAM1/TGFBR2/SPTA1/CTLA4/CASP3/SHH/SYK/LMO1/PRDX2/FADD/LGALS9/CEBPB/CCL19/STAT5B/LEP/GLMN/CD28/LILRB4/ZP3/HMGB1/CD55/PDCD1LG2/PNP/CR1/HLA-E/HLA-G/PSMB10/HLA-E/HLA-A/HLA-A/HLA-G/HLA-DPB1/HLA-DPB1/HLA-A/HLA-A/HLA-E/HLA-DPB1/HLA-A/HLA-A/HLA-E/HLA-DPB1/HLA-E/HLA-G/HLA-DPB1/HLA-DPB1/HLA-DPA1/HLA-A/HLA-G/HLA-E/HLA-G/HLA-A/HLA-G/HLA-E/HLA-DPB1/HLA-G/HLA-DPB1/PTPRC/CCL5/CD24/CCL5/LILRB1/LILRB4/HLA-G/LILRB1/LILRB1/LILRB1/LILRB4/LILRB4/PTEN/ITCH | 126 |
| GO:0019883 | antigen processing and presentation of endogenous antigen | 55/3662 | 67/15509 | 6.43186e-24 | 6.22885e-22 | 3.74592e-22 | HFE/CD74/CD1A/CD1C/CD1B/ERAP2/TAP1/TAP2/HLA-E/HLA-G/TAP2/TAP1/TAP2/HLA-DRA/HLA-B/HLA-E/HLA-A/HLA-A/HLA-G/TAP2/HLA-B/HLA-A/TAP1/HLA-A/HLA-B/HLA-E/TAP2/TAP1/HLA-A/TAP1/HLA-DRA/TAP2/HLA-B/HLA-DRA/HLA-A/HLA-E/HLA-E/HLA-G/TAP1/HLA-A/TAPBP/HLA-B/TAP2/HLA-G/HLA-E/HLA-DRA/HLA-G/HLA-A/HLA-G/HLA-E/HLA-G/TAP2/B2M/HLA-G/HLA-DRA | 55 |
| GO:0002824 | positive regulation of adaptive immune response based on somatic recombination of immune receptors built from immunoglobulin superfamily domains | 94/3662 | 152/15509 | 6.71764e-24 | 6.40553e-22 | 3.85217e-22 | CD4/BTK/SLC11A1/FOXP3/TBX21/MLH1/PTPRC/P2RX7/MSH2/IL12RB1/CD40/FCER2/IL27RA/TGFB1/EXOSC3/GATA3/NSD2/HPX/CD81/IL12B/IL4/SHLD2/IL1B/C3/NECTIN2/IL6/IL18/MR1/CD1A/CD1C/CD1B/TNFSF13/NOD2/FADD/CD28/CARD9/ZP3/CD55/TAP2/TNF/HLA-E/HLA-G/TAP2/TAP2/HLA-DRA/TNF/HLA-B/HLA-E/HLA-A/HLA-A/HLA-G/TAP2/HLA-B/LTA/TNF/HLA-A/HLA-A/HLA-B/HLA-E/TAP2/LTA/HLA-A/HLA-DRA/TNF/TAP2/TNF/HLA-B/TNF/HLA-DRA/HLA-A/HLA-E/TNF/HLA-E/LTA/HLA-G/LTA/HLA-A/HLA-B/TAP2/TNF/HLA-G/HLA-E/HLA-DRA/HLA-G/HLA-A/HLA-G/HLA-E/HLA-G/TAP2/LTA/PTPRC/B2M/HLA-G/HLA-DRA | 94 |
| GO:0002821 | positive regulation of adaptive immune response | 96/3662 | 157/15509 | 7.50189e-24 | 7.04496e-22 | 4.23671e-22 | CD4/BTK/SLC11A1/FOXP3/TBX21/MLH1/PTPRC/P2RX7/MSH2/IL12RB1/CD40/PYCARD/FCER2/IL27RA/TGFB1/EXOSC3/GATA3/NSD2/HPX/CD81/IL12B/IL4/SHLD2/IL1B/C3/NECTIN2/AKIRIN2/IL6/IL18/MR1/CD1A/CD1C/CD1B/TNFSF13/NOD2/FADD/CD28/CARD9/ZP3/CD55/TAP2/TNF/HLA-E/HLA-G/TAP2/TAP2/HLA-DRA/TNF/HLA-B/HLA-E/HLA-A/HLA-A/HLA-G/TAP2/HLA-B/LTA/TNF/HLA-A/HLA-A/HLA-B/HLA-E/TAP2/LTA/HLA-A/HLA-DRA/TNF/TAP2/TNF/HLA-B/TNF/HLA-DRA/HLA-A/HLA-E/TNF/HLA-E/LTA/HLA-G/LTA/HLA-A/HLA-B/TAP2/TNF/HLA-G/HLA-E/HLA-DRA/HLA-G/HLA-A/HLA-G/HLA-E/HLA-G/TAP2/LTA/PTPRC/B2M/HLA-G/HLA-DRA | 96 |
| GO:0032103 | positive regulation of response to external stimulus | 212/3662 | 481/15509 | 9.13475e-24 | 8.45033e-22 | 5.08188e-22 | BTK/TYROBP/CD74/GRN/CASR/CYBA/PUM2/F7/KARS1/SPI1/HYAL2/FGFR1/UBE2K/XRCC5/DNM1L/MAVS/APOH/OSM/PDGFB/NFKBIA/HCK/RIOK3/TLR8/ABCC1/PYCARD/PLAT/PRKD2/TGFB1/PIK3CG/PTN/MET/NOD1/HSPB1/SERPINE1/CREB3/CXCL12/C1QBP/CTSC/HPX/MDK/CD81/IFNG/NEDD9/IL17A/SMOC2/IL12B/IL4/PDGFRB/WNT5A/SNX4/PARK7/CD160/ARG1/VAMP8/PGF/PTK2B/CXCR4/IL1B/C3/CCR7/IRF3/KDR/RAC2/NECTIN2/TRIM5/POLR3F/AKIRIN2/IL6/TLR4/CCL21/DDX60/THBS1/IL21/FGF2/SLC15A4/IGF1R/TNFRSF11A/APP/SLIT2/TPBG/NONO/VEGFC/IL18/BMP6/PRKCA/GBP5/CXCL13/IL6R/CAMK2N1/TLR3/SYK/MBL2/NOD2/FADD/CX3CR1/POLR3D/LGALS9/PTK2/CXCL8/TRIM56/CD14/S1PR1/SCG2/CEBPB/IL16/CCL19/STAT5B/LPL/CD28/CALR/F2/PAK2/CXCR2/CSF1R/CCR4/CSF1/HEXIM1/CARD9/PLSCR1/ZP3/KIR2DL4/HMGB1/TLR7/CD47/SRC/TNF/HLA-E/HLA-G/TMSB4X/TNF/HLA-E/HLA-G/ZNF580/NCR3/LTA/TNF/HLA-E/NCR3/LTA/TNF/TNF/TNF/HLA-E/TNF/HLA-E/LTA/HLA-G/LTA/TNF/HLA-G/HLA-E/HLA-G/HLA-G/NCR3/HLA-E/NCR3/NCR3/HLA-G/NCR3/LTA/NEAT1/CEBPA/NAIP/PRKDC/LSM14A/CCL5/KIR2DL4/KIR2DL4/KIR2DL4/KIR2DL4/CCL5/KIR2DL4/KIR2DL4/KIR2DL4/KIR2DL4/CCL4/KIR2DL4/KIR2DL4/KIR2DL4/KIR2DL4/CCL4/KIR2DL4/KIR2DL4/HLA-G/NAIP/MIF/KIR2DL4/KIR2DL4/KIR2DL4/KIR2DL4/KIR2DL4/KIR2DL4/KIR2DL4/CCL4/KIR2DL4/KIR2DL4/ABCC1/KIR2DL4/KIR2DL4/KIR2DL4/KIR2DL4/NAIP/KIR2DL4/KIR2DL4/KIR2DL4/KIR2DL4/KIR2DL4/KIR2DL4/KIR2DL4/KIR2DL4/KIR2DL4/KIR2DL4 | 212 |
| GO:0002483 | antigen processing and presentation of endogenous peptide antigen | 51/3662 | 60/15509 | 1.16583e-23 | 1.06262e-21 | 6.39038e-22 | HFE/ERAP2/TAP1/TAP2/HLA-E/HLA-G/TAP2/TAP1/TAP2/HLA-DRA/HLA-B/HLA-E/HLA-A/HLA-A/HLA-G/TAP2/HLA-B/HLA-A/TAP1/HLA-A/HLA-B/HLA-E/TAP2/TAP1/HLA-A/TAP1/HLA-DRA/TAP2/HLA-B/HLA-DRA/HLA-A/HLA-E/HLA-E/HLA-G/TAP1/HLA-A/TAPBP/HLA-B/TAP2/HLA-G/HLA-E/HLA-DRA/HLA-G/HLA-A/HLA-G/HLA-E/HLA-G/TAP2/B2M/HLA-G/HLA-DRA | 51 |
| GO:0019724 | B cell mediated immunity | 114/3662 | 203/15509 | 1.2356e-23 | 1.10989e-21 | 6.67471e-22 | BTK/CD74/PARP3/FOXP3/FCGR2B/TBX21/MLH1/IL4R/PTPRC/MSH2/CD40/TLR8/CD40LG/IL21R/NBN/FCER2/IL27RA/TGFB1/EXOSC3/C1QBP/NSD2/HPX/CD81/AICDA/IL4/BCL6/CLU/SHLD2/CD70/C3/FOXJ1/NECTIN2/NDFIP1/IL10/SLC15A4/TNFSF13/PRKCD/MBL2/NOD2/INPP5D/LIG4/CD19/CD28/HLA-DQB1/CARD9/ZP3/CD55/HLA-DQA1/CR1/HLA-DOA/TNF/HLA-E/HLA-G/HLA-DQB1/HLA-DQA1/HLA-DQB1/HLA-DQA1/HLA-DRA/TNF/HLA-E/HLA-G/HLA-DPB1/HLA-DQA1/HLA-DPB1/LTA/TNF/HLA-DQA1/HLA-E/HLA-DQB1/HLA-DQA1/LTA/HLA-DPB1/HLA-DRA/HLA-DQA1/TNF/TNF/TNF/HLA-DRA/HLA-E/HLA-DPB1/TNF/HLA-E/LTA/HLA-G/HLA-DPB1/HLA-DPB1/HLA-DRB4/HLA-DQB1/HLA-DPA1/LTA/HLA-DQA1/HLA-DQB1/HLA-DQA1/TNF/HLA-G/HLA-DQA1/HLA-DQB1/HLA-E/HLA-DRA/HLA-G/HLA-G/HLA-DQA1/HLA-E/HLA-DPB1/HLA-G/HLA-DQA1/HLA-DPB1/LTA/HLA-DQA1/PTPRC/B2M/HLA-G/HLA-DRA/INPP5D | 114 |
| GO:0032944 | regulation of mononuclear cell proliferation | 135/3662 | 259/15509 | 1.38449e-23 | 1.22587e-21 | 7.37214e-22 | CD38/BTK/TYROBP/CD22/IGF1/CD74/TNFRSF1B/FOXP3/FCGR2B/ST6GAL1/ARG2/PTPRC/IL12RB1/CD40/NFATC2/CD40LG/PYCARD/IL7/LILRB1/IL27RA/CLC/JAK3/AHR/TNFSF8/CD81/IL12B/IL4/IL5/BCL6/CD86/HES1/IL1A/ZAP70/IGFBP2/MPL/ARG1/GPAM/CD80/PKN1/CDKN1A/IL1B/TNFSF9/CD70/RAC2/TWSG1/FOXJ1/EPO/NDFIP1/EPHB2/SFTPD/PTPN22/IL2RA/IL6/IL10/TLR4/IL21/SLC7A1/TNFRSF21/IL18/TNFRSF13C/ICOSLG/VCAM1/TGFBR2/SPTA1/CTLA4/CASP3/SHH/SYK/LMO1/FADD/INPP5D/LGALS9/BCL2L1/CEBPB/CCL19/STAT5B/LEP/GLMN/CD28/CSF1/LILRB4/ZP3/HMGB1/CD55/PDCD1LG2/PNP/CR1/HLA-E/HLA-G/HLA-E/HLA-A/HLA-A/HLA-G/HLA-DPB1/HLA-DPB1/HLA-A/HLA-A/HLA-E/HLA-DPB1/HLA-A/HLA-A/HLA-E/HLA-DPB1/HLA-E/HLA-G/HLA-DPB1/HLA-DPB1/HLA-DPA1/HLA-A/HLA-G/HLA-E/HLA-G/HLA-A/HLA-G/HLA-E/HLA-DPB1/HLA-G/HLA-DPB1/TNFRSF13B/PTPRC/CCL5/CD24/CCL5/LILRB1/LILRB4/HLA-G/LILRB1/MIF/LILRB1/LILRB1/LILRB4/LILRB4/INPP5D/PTEN/ITCH | 135 |
| GO:0070661 | leukocyte proliferation | 166/3662 | 346/15509 | 1.44511e-23 | 1.26152e-21 | 7.58656e-22 | CD38/BTK/TYROBP/CD22/IGF1/SLC11A1/CD74/BTN3A1/TNFRSF1B/FOXP3/FCGR2B/ST6GAL1/ARG2/PTPRC/BAX/P2RX7/IL5RA/IL12RB1/ABL1/CD40/NFATC2/ELF4/CD40LG/PYCARD/IL7/LILRB1/IL27RA/CLC/CD79A/JAK3/PIK3CG/AHR/TNFSF8/PPP3CB/CD81/CCND3/IL12B/IL4/IL5/BCL6/CD86/HES1/IL1A/ZAP70/IGFBP2/MPL/TNFAIP3/ARG1/GPAM/HELLS/CLU/CD80/FLT3/PKN1/CDKN1A/IL1B/TNFSF9/CD70/RAC2/TWSG1/FOXJ1/EPO/NDFIP1/EPHB2/SFTPD/PTPN22/IL2RA/IL6/IL10/TLR4/IL21/SLC7A1/ARMC5/TNFRSF21/MSN/IL18/HHEX/MS4A1/KIT/TNFRSF13C/ICOSLG/WNT4/VCAM1/TGFBR2/SPTA1/CTLA4/BAP1/PRKCD/CASP3/CSF2/SHH/SYK/LMO1/PRDX2/FADD/INPP5D/LGALS9/PTK2/BCL2L1/CEBPB/CCL19/STAT5B/LEP/GLMN/RAG2/CD19/CD28/CSF1R/CSF1/LILRB4/ZP3/HMGB1/CD55/PDCD1LG2/IFNA1/PNP/CR1/HLA-E/HLA-G/PSMB10/HLA-E/HLA-A/HLA-A/HLA-G/HLA-DPB1/HLA-DPB1/HLA-A/HLA-A/HLA-E/HLA-DPB1/HLA-A/HLA-A/HLA-E/HLA-DPB1/HLA-E/HLA-G/HLA-DPB1/HLA-DPB1/HLA-DPA1/HLA-A/HLA-G/HLA-E/HLA-G/HLA-A/HLA-G/HLA-E/HLA-DPB1/HLA-G/HLA-DPB1/TNFRSF13B/PTPRC/CCL5/CD24/CCL5/LILRB1/LILRB4/HLA-G/LILRB1/MIF/LILRB1/LILRB1/LILRB4/LILRB4/INPP5D/PTEN/ITCH | 166 |
| GO:0002717 | positive regulation of natural killer cell mediated immunity | 64/3662 | 86/15509 | 2.73975e-23 | 2.35847e-21 | 1.41834e-21 | IL12B/CD160/NECTIN2/IL21/STAT5B/KIR2DL4/HLA-E/HLA-G/HLA-E/HLA-G/NCR3/HLA-E/NCR3/HLA-E/HLA-E/HLA-G/HLA-G/HLA-E/HLA-G/HLA-G/NCR3/HLA-E/NCR3/NCR3/HLA-G/NCR3/KIR2DL4/KIR2DL4/KIR2DL4/KIR2DL4/KIR2DL4/KIR2DL4/KIR2DL4/KIR2DL4/KIR2DL4/KIR2DL4/KIR2DL4/KIR2DL4/KIR2DL4/KIR2DL4/HLA-G/KIR2DL4/KIR2DL4/KIR2DL4/KIR2DL4/KIR2DL4/KIR2DL4/KIR2DL4/KIR2DL4/KIR2DL4/KIR2DL4/KIR2DL4/KIR2DL4/KIR2DL4/KIR2DL4/KIR2DL4/KIR2DL4/KIR2DL4/KIR2DL4/KIR2DL4/KIR2DL4/KIR2DL4/KIR2DL4/KIR2DL4 | 64 |
| GO:0043065 | positive regulation of apoptotic process | 206/3662 | 467/15509 | 3.56866e-23 | 3.02994e-21 | 1.82215e-21 | BAD/MAP3K9/SCIN/NOX1/TYROBP/FAS/TNFRSF1B/BAK1/GRN/AIFM2/CCAR1/NGFR/DDX20/MAP2K4/RHOA/HYAL2/SIRT2/TP63/TP73/PTPRC/STK17B/BAX/MMP2/DNM1L/P2RX7/ZNF268/ABL1/GADD45B/MMP9/CD40/MYBL2/BMP7/EEF1A2/RASSF2/SRPX/CD40LG/PYCARD/SFRP1/TLE5/LILRB1/PDCD5/GSK3A/GSDME/HOXA5/CASP2/SFRP4/TGFBR1/MAPK8/SEPTIN4/C1QBP/CCL2/MAP2K6/CTSC/ZBTB16/VDR/IFNG/IL12B/PDGFRB/BCL6/WNT5A/ITGA4/PARK7/MFN2/GADD45A/CD160/FASLG/FOXO3/PTPA/IFIT2/CLU/TNFRSF10B/TNFRSF8/IAPP/TNFSF10/INHBA/NR4A1/SOX4/EEF1E1/RBCK1/BMP2/PLAGL2/BECN1/STYXL1/IRF5/ALDH1A2/AKAP12/TOP2A/MYBBP1A/SERINC3/BTG1/RNF122/NOTCH2/APC/HRK/SRPK2/ITM2C/IL6/IL10/TFAP2A/MTCH1/THBS1/CYP1B1/ARRB2/SMAD4/PMAIP1/SOD1/CCN1/ADCY10/TP53BP2/RHOB/TEX261/ARL6IP5/SLIT2/IGFBP3/GSN/NOTCH1/ITGB1/FOXO1/POU4F2/POU4F1/BCL2L11/PRMT2/RPL26/OMA1/PEA15/ATF3/CAPN2/FRZB/INHBB/ERCC3/CTLA4/RYBP/PRKCD/CASP3/TLR3/STK17A/GPER1/CDK5/TP53INP1/HTRA1/SLC27A4/FADD/INPP5D/LGALS9/PRELID1/ITGAM/KLF11/RARG/ATP2A2/LEP/DDIT3/PTPN2/FOSL1/CDK5R1/JUN/PAK2/CXCR2/NQO1/ADIPOQ/PHLDA2/RBM10/CHEK2/FZD9/HMGB1/AKR1C3/TRPV1/DAPK1/IGF2R/SRC/MAP3K5/ATG7/TGM2/TNF/HLA-G/TNF/HLA-G/FIS1/LTA/TNF/LTA/TNF/TNF/TNF/TNF/LTA/HLA-G/LTA/TNF/HLA-G/HLA-G/HLA-G/HLA-G/LTA/PRKDC/PTPRC/TXNIP/CCL5/CCL5/LILRB1/HLA-G/LILRB1/LILRB1/LILRB1/INPP5D/SQSTM1/PTEN | 206 |
| GO:0002456 | T cell mediated immunity | 92/3662 | 150/15509 | 4.76025e-23 | 3.98703e-21 | 2.39773e-21 | HFE/TNFRSF1B/FOXP3/FCGR2B/TBX21/PTPRC/P2RX7/ICAM1/IL12RB1/SMAD7/LILRB1/CLC/AHR/GATA3/PPP3CB/CTSC/CD81/IL12B/IL4/ARG1/IL1B/CD70/NECTIN2/IL6/IL18/MR1/CD8A/CD1A/CD1C/CD1B/NOD2/FADD/PRF1/MICA/BTN3A2/LILRB4/ZP3/HMGB1/CD55/TAP2/HLA-E/HLA-G/TAP2/TAP2/HLA-DRA/HLA-B/HLA-E/HLA-A/HLA-A/HLA-G/TAP2/HLA-B/HLA-A/HLA-A/HLA-B/HLA-E/TAP2/HLA-A/HLA-DRA/TAP2/HLA-B/HLA-DRA/HLA-A/HLA-E/HLA-E/HLA-G/MICA/HLA-A/HLA-B/TAP2/MICA/HLA-G/HLA-E/HLA-DRA/MICA/HLA-G/HLA-A/HLA-G/HLA-E/HLA-G/TAP2/PTPRC/B2M/LILRB1/LILRB4/HLA-G/LILRB1/LILRB1/HLA-DRA/LILRB1/LILRB4/LILRB4 | 92 |
| GO:0002709 | regulation of T cell mediated immunity | 82/3662 | 127/15509 | 8.43779e-23 | 6.97299e-21 | 4.19343e-21 | HFE/TNFRSF1B/FOXP3/FCGR2B/TBX21/PTPRC/P2RX7/IL12RB1/SMAD7/LILRB1/CLC/AHR/GATA3/PPP3CB/CD81/IL12B/IL4/ARG1/IL1B/NECTIN2/IL6/IL18/MR1/CD1A/CD1C/CD1B/NOD2/FADD/LILRB4/ZP3/HMGB1/CD55/TAP2/HLA-E/HLA-G/TAP2/TAP2/HLA-DRA/HLA-B/HLA-E/HLA-A/HLA-A/HLA-G/TAP2/HLA-B/HLA-A/HLA-A/HLA-B/HLA-E/TAP2/HLA-A/HLA-DRA/TAP2/HLA-B/HLA-DRA/HLA-A/HLA-E/HLA-E/HLA-G/HLA-A/HLA-B/TAP2/HLA-G/HLA-E/HLA-DRA/HLA-G/HLA-A/HLA-G/HLA-E/HLA-G/TAP2/PTPRC/B2M/LILRB1/LILRB4/HLA-G/LILRB1/LILRB1/HLA-DRA/LILRB1/LILRB4/LILRB4 | 82 |
| GO:0070663 | regulation of leukocyte proliferation | 142/3662 | 283/15509 | 1.16877e-22 | 9.53164e-21 | 5.73216e-21 | CD38/BTK/TYROBP/CD22/IGF1/CD74/TNFRSF1B/FOXP3/FCGR2B/ST6GAL1/ARG2/PTPRC/IL5RA/IL12RB1/CD40/NFATC2/CD40LG/PYCARD/IL7/LILRB1/IL27RA/CLC/JAK3/AHR/TNFSF8/CD81/IL12B/IL4/IL5/BCL6/CD86/HES1/IL1A/ZAP70/IGFBP2/MPL/TNFAIP3/ARG1/GPAM/CD80/PKN1/CDKN1A/IL1B/TNFSF9/CD70/RAC2/TWSG1/FOXJ1/EPO/NDFIP1/EPHB2/SFTPD/PTPN22/IL2RA/IL6/IL10/TLR4/IL21/SLC7A1/TNFRSF21/IL18/HHEX/KIT/TNFRSF13C/ICOSLG/VCAM1/TGFBR2/SPTA1/CTLA4/CASP3/CSF2/SHH/SYK/LMO1/FADD/INPP5D/LGALS9/PTK2/BCL2L1/CEBPB/CCL19/STAT5B/LEP/GLMN/CD28/CSF1R/CSF1/LILRB4/ZP3/HMGB1/CD55/PDCD1LG2/PNP/CR1/HLA-E/HLA-G/HLA-E/HLA-A/HLA-A/HLA-G/HLA-DPB1/HLA-DPB1/HLA-A/HLA-A/HLA-E/HLA-DPB1/HLA-A/HLA-A/HLA-E/HLA-DPB1/HLA-E/HLA-G/HLA-DPB1/HLA-DPB1/HLA-DPA1/HLA-A/HLA-G/HLA-E/HLA-G/HLA-A/HLA-G/HLA-E/HLA-DPB1/HLA-G/HLA-DPB1/TNFRSF13B/PTPRC/CCL5/CD24/CCL5/LILRB1/LILRB4/HLA-G/LILRB1/MIF/LILRB1/LILRB1/LILRB4/LILRB4/INPP5D/PTEN/ITCH | 142 |
| GO:0002478 | antigen processing and presentation of exogenous peptide antigen | 68/3662 | 96/15509 | 1.30207e-22 | 1.04808e-20 | 6.30298e-21 | CD74/FCGR2B/TAP1/HLA-DQB1/HLA-DQA1/HLA-DOA/TAP2/HLA-E/TAP2/HLA-DQB1/TAP1/TAP2/HLA-DQA1/HLA-DQB1/HLA-DQA1/HLA-DRA/HLA-E/HLA-A/HLA-A/HLA-DPB1/TAP2/HLA-DQA1/HLA-DPB1/HLA-A/TAP1/HLA-A/HLA-DQA1/HLA-E/HLA-DQB1/HLA-DQA1/TAP2/TAP1/HLA-DPB1/HLA-A/TAP1/HLA-DRA/HLA-DQA1/TAP2/HLA-DRA/HLA-A/HLA-E/HLA-DPB1/HLA-E/TAP1/HLA-DPB1/HLA-DPB1/HLA-DRB4/HLA-DQB1/HLA-DPA1/HLA-DQA1/HLA-A/HLA-DQB1/HLA-DQA1/TAP2/HLA-DQA1/HLA-DQB1/HLA-E/HLA-DRA/HLA-A/HLA-DQA1/HLA-E/HLA-DPB1/HLA-DQA1/TAP2/HLA-DPB1/HLA-DQA1/B2M/HLA-DRA | 68 |
| GO:2000774 | positive regulation of cellular senescence | 49/3662 | 58/15509 | 1.5396e-22 | 1.22339e-20 | 7.35724e-21 | ARG2/EEF1E1/KIR2DL4/HLA-G/HLA-G/HLA-G/HLA-G/HLA-G/HLA-G/HLA-G/KIR2DL4/B2M/KIR2DL4/KIR2DL4/KIR2DL4/KIR2DL4/KIR2DL4/KIR2DL4/KIR2DL4/KIR2DL4/KIR2DL4/KIR2DL4/KIR2DL4/KIR2DL4/KIR2DL4/HLA-G/KIR2DL4/KIR2DL4/KIR2DL4/KIR2DL4/KIR2DL4/KIR2DL4/KIR2DL4/KIR2DL4/KIR2DL4/KIR2DL4/KIR2DL4/KIR2DL4/KIR2DL4/KIR2DL4/KIR2DL4/KIR2DL4/KIR2DL4/KIR2DL4/KIR2DL4/KIR2DL4/KIR2DL4/KIR2DL4/KIR2DL4 | 49 |
| GO:0050670 | regulation of lymphocyte proliferation | 132/3662 | 256/15509 | 1.57958e-22 | 1.23927e-20 | 7.45278e-21 | CD38/BTK/TYROBP/CD22/IGF1/CD74/TNFRSF1B/FOXP3/FCGR2B/ARG2/PTPRC/IL12RB1/CD40/NFATC2/CD40LG/PYCARD/IL7/LILRB1/IL27RA/CLC/JAK3/AHR/TNFSF8/CD81/IL12B/IL4/IL5/BCL6/CD86/HES1/IL1A/ZAP70/IGFBP2/MPL/ARG1/GPAM/CD80/PKN1/CDKN1A/IL1B/TNFSF9/CD70/RAC2/TWSG1/FOXJ1/EPO/NDFIP1/EPHB2/SFTPD/PTPN22/IL2RA/IL6/IL10/TLR4/IL21/SLC7A1/TNFRSF21/IL18/TNFRSF13C/ICOSLG/VCAM1/TGFBR2/SPTA1/CTLA4/CASP3/SHH/SYK/LMO1/FADD/INPP5D/LGALS9/CEBPB/CCL19/STAT5B/LEP/GLMN/CD28/LILRB4/ZP3/HMGB1/CD55/PDCD1LG2/PNP/CR1/HLA-E/HLA-G/HLA-E/HLA-A/HLA-A/HLA-G/HLA-DPB1/HLA-DPB1/HLA-A/HLA-A/HLA-E/HLA-DPB1/HLA-A/HLA-A/HLA-E/HLA-DPB1/HLA-E/HLA-G/HLA-DPB1/HLA-DPB1/HLA-DPA1/HLA-A/HLA-G/HLA-E/HLA-G/HLA-A/HLA-G/HLA-E/HLA-DPB1/HLA-G/HLA-DPB1/TNFRSF13B/PTPRC/CCL5/CD24/CCL5/LILRB1/LILRB4/HLA-G/LILRB1/MIF/LILRB1/LILRB1/LILRB4/LILRB4/INPP5D/PTEN/ITCH | 132 |
| GO:0002573 | myeloid leukocyte differentiation | 114/3662 | 208/15509 | 1.89329e-22 | 1.46682e-20 | 8.82123e-21 | PAFAH1B1/CD4/TYROBP/LTF/CD74/GAB2/SPI1/TFE3/CDC42/ATP6AP1/OSTM1/PIR/CEBPE/MYH9/ACIN1/DHRS2/MMP9/RASSF2/GATA1/SFRP1/LILRB1/TGFB1/GATA3/SH3PXD2A/CSF3/CD81/IFNG/NEDD9/MAPK14/IL17A/IL12B/IL4/IL5/ID2/IAPP/INHBA/CCR7/LIF/LRRC17/CBFA2T3/NDFIP1/RARA/PIAS3/AP3B1/TSPAN2/NOTCH2/IREB2/TLR4/IRF4/RB1/CUL4A/TNFRSF11A/APP/EPHA2/PARP1/LBR/TCTA/PIK3R1/POU4F2/POU4F1/PRKCA/KLF10/KIT/RUNX1/TAL1/TGFBR2/PF4/BAP1/SLC9B2/TLR3/CSF2/TNFRSF11B/FADD/RBPJ/INPP5D/FOS/CEBPB/CCL19/ESRRA/GPR137/PTPN2/JUN/FAM20C/CTNNBIP1/ADIPOQ/CSF1R/ANXA2/CSF1/SOCS1/ZFP36L1/LILRB4/PRTN3/SRC/MTOR/L3MBTL3/MAFB/TNF/TNF/TNF/TNF/TNF/TNF/TNF/TNF/CEBPA/LILRB1/LILRB4/LILRB1/LILRB1/PRTN3/LILRB1/LILRB4/LILRB4/INPP5D | 114 |
| GO:1903131 | mononuclear cell differentiation | 194/3662 | 436/15509 | 2.03098e-22 | 1.55408e-20 | 9.34594e-21 | BAD/TMEM98/CD79B/ST3GAL1/CD4/BTK/CD74/RUNX3/HMGB3/BAK1/ARID1B/FOXP3/PRDM1/AP3D1/SPI1/KLF6/RHOA/CBFB/TCF3/FCGR2B/TBX21/GLI2/ACTB/IL4R/PTPRC/BAX/PIR/HECTD1/MSH2/IL12RB1/ABL1/SMARCB1/XBP1/MYH9/ACIN1/DHRS2/SMAD7/GATA1/CD40LG/SFRP1/IL7/LYL1/LILRB1/CD79A/KDELR1/JAK3/EZH2/TNFSF8/GATA3/PPP3CB/ZMIZ1/SMARCD2/ZBTB16/MDK/POU2AF1/IFNG/AICDA/IL12B/IL4/BCL6/CD86/IL1A/ZAP70/ITGA4/ID2/LEPR/ARID1A/MYB/FOXO3/EGR1/PTK2B/CD80/FLT3/INHBA/SOX4/RUNX2/IL1B/TNFSF9/CCR7/BCL11B/FOXJ1/NDFIP1/RARA/AP3B1/PTPN22/NOTCH2/IL2RA/IL6/HLX/IL10/IRF4/IL21/ARMC5/IRF8/SOD1/DUSP10/DCAF1/PIK3R1/IL2RG/ZEB1/ITGB1/IL18/ZFP36L2/HHEX/MR1/MERTK/CD8A/MS4A1/MMP14/KIT/RUNX1/IL6R/WNT4/VCAM1/TGFBR2/CTLA4/CSF2/SHH/SYK/BRD7/RAG1/PRDX2/FADD/RBPJ/RHOH/INPP5D/LGALS9/PRELID1/FOS/CEBPB/CCL19/KAT5/CCR9/STAT5B/LIG4/LEP/RAG2/PTPN2/CD19/JUN/CD28/CTNNBIP1/CSF1R/KLHL25/CSF1/SOCS1/PBX1/ZFP36L1/LILRB4/FZD9/ARID2/HMGB1/PAX5/PRTN3/IFNA1/ENTPD7/NTRK1/NRARP/MTOR/PNP/CR1/MAFB/HLA-DOA/HLA-G/HLA-DRA/HLA-B/HLA-G/HLA-B/HLA-B/HLA-DRA/HLA-B/HLA-DRA/HLA-G/HLA-B/HLA-G/HLA-DRA/HLA-G/HLA-G/HLA-G/PRKDC/PTPRC/B2M/LILRB1/SMARCB1/LILRB4/HLA-G/LILRB1/LILRB1/HLA-DRA/PRTN3/LILRB1/LILRB4/LILRB4/INPP5D | 194 |
| GO:0019885 | antigen processing and presentation of endogenous peptide antigen via MHC class I | 46/3662 | 53/15509 | 2.93731e-22 | 2.22017e-20 | 1.33517e-20 | HFE/ERAP2/TAP1/TAP2/HLA-E/HLA-G/TAP2/TAP1/TAP2/HLA-B/HLA-E/HLA-A/HLA-A/HLA-G/TAP2/HLA-B/HLA-A/TAP1/HLA-A/HLA-B/HLA-E/TAP2/TAP1/HLA-A/TAP1/TAP2/HLA-B/HLA-A/HLA-E/HLA-E/HLA-G/TAP1/HLA-A/TAPBP/HLA-B/TAP2/HLA-G/HLA-E/HLA-G/HLA-A/HLA-G/HLA-E/HLA-G/TAP2/B2M/HLA-G | 46 |
| GO:0042129 | regulation of T cell proliferation | 112/3662 | 204/15509 | 3.6903e-22 | 2.75572e-20 | 1.65724e-20 | IGF1/TNFRSF1B/FOXP3/ARG2/PTPRC/IL12RB1/CD40LG/PYCARD/LILRB1/IL27RA/CLC/JAK3/TNFSF8/CD81/IL12B/IL4/BCL6/CD86/HES1/IL1A/ZAP70/IGFBP2/ARG1/GPAM/CD80/IL1B/TNFSF9/CD70/RAC2/TWSG1/FOXJ1/EPO/NDFIP1/SFTPD/PTPN22/IL2RA/IL6/IL10/IL21/SLC7A1/TNFRSF21/IL18/TNFRSF13C/ICOSLG/VCAM1/TGFBR2/SPTA1/CTLA4/CASP3/SHH/SYK/LMO1/FADD/LGALS9/CEBPB/CCL19/STAT5B/LEP/GLMN/CD28/LILRB4/ZP3/HMGB1/CD55/PDCD1LG2/PNP/CR1/HLA-E/HLA-G/HLA-E/HLA-A/HLA-A/HLA-G/HLA-DPB1/HLA-DPB1/HLA-A/HLA-A/HLA-E/HLA-DPB1/HLA-A/HLA-A/HLA-E/HLA-DPB1/HLA-E/HLA-G/HLA-DPB1/HLA-DPB1/HLA-DPA1/HLA-A/HLA-G/HLA-E/HLA-G/HLA-A/HLA-G/HLA-E/HLA-DPB1/HLA-G/HLA-DPB1/PTPRC/CCL5/CD24/CCL5/LILRB1/LILRB4/HLA-G/LILRB1/LILRB1/LILRB1/LILRB4/LILRB4/PTEN/ITCH | 112 |
| GO:0001913 | T cell mediated cytotoxicity | 66/3662 | 94/15509 | 1.20059e-21 | 8.85863e-20 | 5.32743e-20 | FCGR2B/PTPRC/P2RX7/IL12RB1/LILRB1/PPP3CB/CTSC/IL12B/NECTIN2/MR1/CD1A/CD1C/CD1B/FADD/PRF1/MICA/TAP2/HLA-E/HLA-G/TAP2/TAP2/HLA-DRA/HLA-B/HLA-E/HLA-A/HLA-A/HLA-G/TAP2/HLA-B/HLA-A/HLA-A/HLA-B/HLA-E/TAP2/HLA-A/HLA-DRA/TAP2/HLA-B/HLA-DRA/HLA-A/HLA-E/HLA-E/HLA-G/MICA/HLA-A/HLA-B/TAP2/MICA/HLA-G/HLA-E/HLA-DRA/MICA/HLA-G/HLA-A/HLA-G/HLA-E/HLA-G/TAP2/PTPRC/B2M/LILRB1/HLA-G/LILRB1/LILRB1/HLA-DRA/LILRB1 | 66 |
| GO:0002237 | response to molecule of bacterial origin | 158/3662 | 335/15509 | 1.54295e-21 | 1.12508e-19 | 6.76604e-20 | UPF1/MPO/PAF1/SELE/BTK/LTF/SLC11A1/CPS1/TNFRSF1B/FOXP3/SPI1/FGFR2/RHOA/SIRT2/FCGR2B/IL12RB2/OPRK1/APOB/CHMP5/P2RX7/CEBPE/ABL1/XBP1/CTSG/PABPN1/PCK2/NFKBIA/HCK/GATA1/ACP5/PYCARD/LILRB1/TGFB1/HAMP/SERPINE1/MAPK8/CSF3/RPS6KB1/CCL2/CYP27B1/AICDA/PPARD/MAPK14/IL12B/CD86/WNT5A/IL1A/FASLG/TNFAIP3/ARG1/CD80/NR4A1/IL1B/CCR7/NR1D1/IRF3/ZFP36/IRF5/CD68/EPO/ASS1/AKAP12/RARA/TRIM5/EPHB2/PTPN22/CD36/AKIRIN2/EDNRB/IL6/IL10/TLR4/IL18BP/SMAD6/CYP1A1/IRF8/TNFRSF11A/DUSP10/REN/ALAD/NOTCH1/IL18/BMP6/CD96/PRKCA/CXCL13/ADAMTS13/CCR5/GFI1/VCAM1/MAPKAPK2/IL24/CAPN2/PF4/CASP3/CSF2/NOS3/NOD2/PRDX2/CX3CR1/ADAM9/TNIP2/LGALS9/PTAFR/CXCL8/FOS/CD14/PRKCE/CEBPB/RELA/CNP/SELP/F2R/IRAK1/CSF1/PDE4B/SIGIRR/CARD9/CNR2/HMGB1/CD55/SRC/SHPK/ELANE/PDCD1LG2/TAP2/TNF/TAP2/TAP2/TNF/TAP2/LTA/TNF/TAP2/LTA/TNF/TAP2/TNF/TNF/TNF/LTA/LTA/TAP2/TNF/TAP2/LTA/CCL5/CD24/B2M/CCL5/PRPF8/LILRB1/LILRB1/MIF/LILRB1/ELANE/LILRB1/ADAMTS13 | 158 |
| GO:0045621 | positive regulation of lymphocyte differentiation | 81/3662 | 129/15509 | 2.16932e-21 | 1.56343e-19 | 9.40217e-20 | BAD/BTK/CD74/RUNX3/ARID1B/FOXP3/AP3D1/RHOA/CBFB/GLI2/ACTB/IL4R/PTPRC/IL12RB1/SMARCB1/XBP1/IL7/GATA3/ZMIZ1/SMARCD2/ZBTB16/MDK/IFNG/IL12B/IL4/BCL6/CD86/ZAP70/ARID1A/MYB/FOXO3/CD80/SOX4/TNFSF9/RARA/AP3B1/IL2RA/HLX/IL10/DUSP10/IL2RG/IL18/MMP14/RUNX1/TGFBR2/SHH/SYK/BRD7/RAG1/RHOH/INPP5D/LGALS9/CCL19/KAT5/STAT5B/KLHL25/SOCS1/LILRB4/ARID2/PNP/CR1/HLA-G/HLA-DRA/HLA-G/HLA-DRA/HLA-DRA/HLA-G/HLA-G/HLA-DRA/HLA-G/HLA-G/HLA-G/PRKDC/PTPRC/SMARCB1/LILRB4/HLA-G/HLA-DRA/LILRB4/LILRB4/INPP5D | 81 |
| GO:0001914 | regulation of T cell mediated cytotoxicity | 60/3662 | 82/15509 | 2.7827e-21 | 1.98244e-19 | 1.1922e-19 | FCGR2B/PTPRC/P2RX7/IL12RB1/LILRB1/PPP3CB/IL12B/NECTIN2/MR1/CD1A/CD1C/CD1B/FADD/TAP2/HLA-E/HLA-G/TAP2/TAP2/HLA-DRA/HLA-B/HLA-E/HLA-A/HLA-A/HLA-G/TAP2/HLA-B/HLA-A/HLA-A/HLA-B/HLA-E/TAP2/HLA-A/HLA-DRA/TAP2/HLA-B/HLA-DRA/HLA-A/HLA-E/HLA-E/HLA-G/HLA-A/HLA-B/TAP2/HLA-G/HLA-E/HLA-DRA/HLA-G/HLA-A/HLA-G/HLA-E/HLA-G/TAP2/PTPRC/B2M/LILRB1/HLA-G/LILRB1/LILRB1/HLA-DRA/LILRB1 | 60 |
| GO:0001916 | positive regulation of T cell mediated cytotoxicity | 53/3662 | 68/15509 | 4.00402e-21 | 2.8201e-19 | 1.69596e-19 | PTPRC/P2RX7/IL12RB1/IL12B/NECTIN2/MR1/CD1A/CD1C/CD1B/FADD/TAP2/HLA-E/HLA-G/TAP2/TAP2/HLA-DRA/HLA-B/HLA-E/HLA-A/HLA-A/HLA-G/TAP2/HLA-B/HLA-A/HLA-A/HLA-B/HLA-E/TAP2/HLA-A/HLA-DRA/TAP2/HLA-B/HLA-DRA/HLA-A/HLA-E/HLA-E/HLA-G/HLA-A/HLA-B/TAP2/HLA-G/HLA-E/HLA-DRA/HLA-G/HLA-A/HLA-G/HLA-E/HLA-G/TAP2/PTPRC/B2M/HLA-G/HLA-DRA | 53 |
| GO:0045582 | positive regulation of T cell differentiation | 75/3662 | 116/15509 | 5.05333e-21 | 3.51916e-19 | 2.11636e-19 | BAD/CD74/RUNX3/ARID1B/FOXP3/AP3D1/RHOA/CBFB/GLI2/ACTB/IL4R/PTPRC/IL12RB1/SMARCB1/XBP1/IL7/GATA3/ZMIZ1/SMARCD2/ZBTB16/MDK/IFNG/IL12B/IL4/BCL6/CD86/ZAP70/ARID1A/MYB/FOXO3/CD80/SOX4/TNFSF9/RARA/AP3B1/IL2RA/HLX/DUSP10/IL2RG/IL18/RUNX1/TGFBR2/SHH/SYK/BRD7/RAG1/RHOH/LGALS9/CCL19/KAT5/STAT5B/KLHL25/SOCS1/LILRB4/ARID2/PNP/CR1/HLA-G/HLA-DRA/HLA-G/HLA-DRA/HLA-DRA/HLA-G/HLA-G/HLA-DRA/HLA-G/HLA-G/HLA-G/PTPRC/SMARCB1/LILRB4/HLA-G/HLA-DRA/LILRB4/LILRB4 | 75 |
| GO:0031343 | positive regulation of cell killing | 71/3662 | 107/15509 | 6.03099e-21 | 4.15334e-19 | 2.49775e-19 | TYROBP/SPI1/PTPRC/P2RX7/IL12RB1/FCER2/MAPK8/IFNG/IL12B/CD160/ARG1/NECTIN2/IL21/MR1/CD1A/CD1C/CD1B/SYK/FADD/ITGAM/STAT5B/PRF1/TAP2/HLA-E/HLA-G/TAP2/TAP2/HLA-DRA/HLA-B/HLA-E/HLA-A/HLA-A/HLA-G/TAP2/HLA-B/NCR3/HLA-A/HLA-A/HLA-B/HLA-E/NCR3/TAP2/HLA-A/HLA-DRA/TAP2/HLA-B/HLA-DRA/HLA-A/HLA-E/HLA-E/HLA-G/HLA-A/HLA-B/TAP2/HLA-G/HLA-E/HLA-DRA/HLA-G/HLA-A/HLA-G/NCR3/HLA-E/NCR3/NCR3/HLA-G/TAP2/NCR3/PTPRC/B2M/HLA-G/HLA-DRA | 71 |
| GO:0002484 | antigen processing and presentation of endogenous peptide antigen via MHC class I via ER pathway | 36/3662 | 38/15509 | 9.94809e-21 | 6.77563e-19 | 4.07475e-19 | TAP2/HLA-E/HLA-G/TAP2/TAP2/HLA-B/HLA-E/HLA-A/HLA-A/HLA-G/TAP2/HLA-B/HLA-A/HLA-A/HLA-B/HLA-E/TAP2/HLA-A/TAP2/HLA-B/HLA-A/HLA-E/HLA-E/HLA-G/HLA-A/HLA-B/TAP2/HLA-G/HLA-E/HLA-G/HLA-A/HLA-G/HLA-E/HLA-G/TAP2/HLA-G | 36 |
| GO:0090398 | cellular senescence | 86/3662 | 144/15509 | 1.52336e-20 | 1.02628e-18 | 6.17187e-19 | WNT16/MAP2K4/SPI1/TP63/SIRT6/ARG2/ZMPSTE24/MAPKAPK5/ABL1/MAPK8/BMPR1A/ZMIZ1/MAP2K6/FBXO5/MAPK14/BCL6/NEK4/ID2/CDKN1A/EEF1E1/HMGA1/BRCA2/IGF1R/ULK3/PLK2/HMGA2/LMNA/PRKCD/TERT/KAT5/HRAS/CALR/NPM1/H2AX/KIR2DL4/MAP3K5/ZNF277/HLA-G/HLA-G/HLA-G/HLA-G/HLA-G/HLA-G/HLA-G/KIR2DL4/B2M/KIR2DL4/KIR2DL4/KIR2DL4/KIR2DL4/KIR2DL4/KIR2DL4/AKT3/KIR2DL4/KIR2DL4/KIR2DL4/KIR2DL4/KIR2DL4/KIR2DL4/KIR2DL4/HLA-G/MIF/KIR2DL4/KIR2DL4/KIR2DL4/KIR2DL4/KIR2DL4/KIR2DL4/KIR2DL4/KIR2DL4/KIR2DL4/KIR2DL4/KIR2DL4/KIR2DL4/KIR2DL4/KIR2DL4/KIR2DL4/KIR2DL4/KIR2DL4/KIR2DL4/KIR2DL4/KIR2DL4/KIR2DL4/KIR2DL4/KIR2DL4/PTEN | 86 |
| GO:0031349 | positive regulation of defense response | 154/3662 | 330/15509 | 1.84493e-20 | 1.22753e-18 | 7.38213e-19 | BTK/TYROBP/GRN/CYBA/KARS1/SPI1/HYAL2/UBE2K/XRCC5/MAVS/OSM/NFKBIA/HCK/RIOK3/TLR8/ABCC1/PYCARD/PIK3CG/NOD1/SERPINE1/CTSC/HPX/MDK/CD81/IFNG/IL17A/IL12B/WNT5A/SNX4/PARK7/CD160/ARG1/VAMP8/IL1B/C3/CCR7/IRF3/NECTIN2/TRIM5/POLR3F/AKIRIN2/IL6/TLR4/IL21/SLC15A4/TNFRSF11A/APP/NONO/IL18/GBP5/CAMK2N1/TLR3/SYK/MBL2/NOD2/FADD/POLR3D/TRIM56/CEBPB/IL16/STAT5B/LPL/CD28/PAK2/HEXIM1/CARD9/PLSCR1/ZP3/KIR2DL4/HMGB1/TLR7/CD47/SRC/TNF/HLA-E/HLA-G/TNF/HLA-E/HLA-G/NCR3/LTA/TNF/HLA-E/NCR3/LTA/TNF/TNF/TNF/HLA-E/TNF/HLA-E/LTA/HLA-G/LTA/TNF/HLA-G/HLA-E/HLA-G/HLA-G/NCR3/HLA-E/NCR3/NCR3/HLA-G/NCR3/LTA/NEAT1/CEBPA/NAIP/PRKDC/LSM14A/CCL5/KIR2DL4/KIR2DL4/KIR2DL4/KIR2DL4/CCL5/KIR2DL4/KIR2DL4/KIR2DL4/KIR2DL4/KIR2DL4/KIR2DL4/KIR2DL4/KIR2DL4/KIR2DL4/KIR2DL4/HLA-G/NAIP/KIR2DL4/KIR2DL4/KIR2DL4/KIR2DL4/KIR2DL4/KIR2DL4/KIR2DL4/KIR2DL4/KIR2DL4/ABCC1/KIR2DL4/KIR2DL4/KIR2DL4/KIR2DL4/NAIP/KIR2DL4/KIR2DL4/KIR2DL4/KIR2DL4/KIR2DL4/KIR2DL4/KIR2DL4/KIR2DL4/KIR2DL4/KIR2DL4 | 154 |
| GO:0016064 | immunoglobulin mediated immune response | 105/3662 | 193/15509 | 1.86169e-20 | 1.22753e-18 | 7.38213e-19 | BTK/CD74/PARP3/FOXP3/FCGR2B/TBX21/MLH1/IL4R/PTPRC/MSH2/CD40/TLR8/CD40LG/IL21R/NBN/FCER2/IL27RA/TGFB1/EXOSC3/C1QBP/NSD2/HPX/CD81/AICDA/IL4/BCL6/CLU/SHLD2/C3/FOXJ1/NECTIN2/NDFIP1/IL10/SLC15A4/TNFSF13/PRKCD/MBL2/NOD2/INPP5D/LIG4/CD19/CD28/HLA-DQB1/CARD9/ZP3/CD55/HLA-DQA1/CR1/HLA-DOA/TNF/HLA-E/HLA-DQB1/HLA-DQA1/HLA-DQB1/HLA-DQA1/HLA-DRA/TNF/HLA-E/HLA-DPB1/HLA-DQA1/HLA-DPB1/LTA/TNF/HLA-DQA1/HLA-E/HLA-DQB1/HLA-DQA1/LTA/HLA-DPB1/HLA-DRA/HLA-DQA1/TNF/TNF/TNF/HLA-DRA/HLA-E/HLA-DPB1/TNF/HLA-E/LTA/HLA-DPB1/HLA-DPB1/HLA-DRB4/HLA-DQB1/HLA-DPA1/LTA/HLA-DQA1/HLA-DQB1/HLA-DQA1/TNF/HLA-DQA1/HLA-DQB1/HLA-E/HLA-DRA/HLA-DQA1/HLA-E/HLA-DPB1/HLA-DQA1/HLA-DPB1/LTA/HLA-DQA1/PTPRC/B2M/HLA-DRA/INPP5D | 105 |
| GO:0045619 | regulation of lymphocyte differentiation | 106/3662 | 197/15509 | 3.72978e-20 | 2.43339e-18 | 1.4634e-18 | BAD/BTK/CD74/RUNX3/HMGB3/ARID1B/FOXP3/PRDM1/AP3D1/RHOA/CBFB/TBX21/GLI2/ACTB/IL4R/PTPRC/IL12RB1/ABL1/SMARCB1/XBP1/SMAD7/SFRP1/IL7/JAK3/GATA3/ZMIZ1/SMARCD2/ZBTB16/MDK/IFNG/IL12B/IL4/BCL6/CD86/ZAP70/ID2/ARID1A/MYB/FOXO3/CD80/INHBA/SOX4/TNFSF9/FOXJ1/NDFIP1/RARA/AP3B1/IL2RA/HLX/IL10/IRF4/SOD1/DUSP10/IL2RG/ZEB1/IL18/ZFP36L2/MMP14/RUNX1/TGFBR2/CTLA4/SHH/SYK/BRD7/RAG1/PRDX2/RHOH/INPP5D/LGALS9/PRELID1/CCL19/KAT5/STAT5B/RAG2/PTPN2/CD28/KLHL25/SOCS1/ZFP36L1/LILRB4/ARID2/HMGB1/NRARP/PNP/CR1/HLA-DOA/HLA-G/HLA-DRA/HLA-G/HLA-DRA/HLA-DRA/HLA-G/HLA-G/HLA-DRA/HLA-G/HLA-G/HLA-G/PRKDC/PTPRC/SMARCB1/LILRB4/HLA-G/HLA-DRA/LILRB4/LILRB4/INPP5D | 106 |
| GO:0045637 | regulation of myeloid cell differentiation | 108/3662 | 203/15509 | 5.18648e-20 | 3.34852e-18 | 2.01374e-18 | PAF1/SCIN/CD4/TYROBP/LTF/CD74/HMGB3/SPI1/TFE3/HOXA9/ACIN1/NFKBIA/RASSF2/GATA1/SFRP1/LILRB1/TGFB1/HOXA5/CSF3/ZBTB16/IFNG/NEDD9/MAPK14/IL17A/HSPA9/IL12B/IL4/IL5/STAT1/ID2/MPL/MYB/FOXO3/CSF3R/PTK2B/IAPP/INHBA/PRMT1/ZFP36/LIF/LRRC17/NDFIP1/RARA/PIAS3/NOTCH2/ABCB10/TLR4/RB1/CUL4A/SKIC8/ARNT/MEIS1/TCTA/PIK3R1/PURB/POU4F2/POU4F1/PRKCA/GABPA/KLF10/RUNX1/TAL1/RBM15/PF4/SLC9B2/TLR3/TNFRSF11B/FADD/INPP5D/FOS/CEBPB/RARG/ESRRA/GPR137/STAT5B/PTPN2/CTNNBIP1/ADIPOQ/CSF1/CIB1/ZFP36L1/LILRB4/MTOR/MAFB/TNF/TNF/TNF/TNF/TNF/TNF/TNF/TNF/EIF6/PRKDC/H4C15/H4C14/H4C12/B2M/LILRB1/LILRB4/LILRB1/H4C5/LILRB1/H4C4/LILRB1/LILRB4/LILRB4/INPP5D | 108 |
| GO:0030098 | lymphocyte differentiation | 170/3662 | 382/15509 | 8.62681e-20 | 5.51227e-18 | 3.31498e-18 | BAD/TMEM98/CD79B/ST3GAL1/CD4/BTK/CD74/RUNX3/HMGB3/BAK1/ARID1B/FOXP3/PRDM1/AP3D1/SPI1/KLF6/RHOA/CBFB/TCF3/FCGR2B/TBX21/GLI2/ACTB/IL4R/PTPRC/BAX/HECTD1/MSH2/IL12RB1/ABL1/SMARCB1/XBP1/SMAD7/CD40LG/SFRP1/IL7/LYL1/CD79A/KDELR1/JAK3/EZH2/TNFSF8/GATA3/PPP3CB/ZMIZ1/SMARCD2/ZBTB16/MDK/POU2AF1/IFNG/AICDA/IL12B/IL4/BCL6/CD86/IL1A/ZAP70/ITGA4/ID2/LEPR/ARID1A/MYB/FOXO3/EGR1/PTK2B/CD80/FLT3/INHBA/SOX4/RUNX2/IL1B/TNFSF9/CCR7/BCL11B/FOXJ1/NDFIP1/RARA/AP3B1/PTPN22/NOTCH2/IL2RA/IL6/HLX/IL10/IRF4/IL21/ARMC5/IRF8/SOD1/DUSP10/DCAF1/PIK3R1/IL2RG/ZEB1/ITGB1/IL18/ZFP36L2/HHEX/MR1/MERTK/CD8A/MS4A1/MMP14/KIT/RUNX1/IL6R/WNT4/VCAM1/TGFBR2/CTLA4/SHH/SYK/BRD7/RAG1/PRDX2/FADD/RBPJ/RHOH/INPP5D/LGALS9/PRELID1/CCL19/KAT5/CCR9/STAT5B/LIG4/LEP/RAG2/PTPN2/CD19/CD28/KLHL25/SOCS1/PBX1/ZFP36L1/LILRB4/FZD9/ARID2/HMGB1/PAX5/IFNA1/ENTPD7/NTRK1/NRARP/MTOR/PNP/CR1/MAFB/HLA-DOA/HLA-G/HLA-DRA/HLA-G/HLA-DRA/HLA-DRA/HLA-G/HLA-G/HLA-DRA/HLA-G/HLA-G/HLA-G/PRKDC/PTPRC/B2M/SMARCB1/LILRB4/HLA-G/HLA-DRA/LILRB4/LILRB4/INPP5D | 170 |
| GO:0006968 | cellular defense response | 65/3662 | 97/15509 | 1.231e-19 | 7.78542e-18 | 4.68201e-18 | TYROBP/GNLY/PTK2B/BECN1/ITGB1/CCR5/CX3CR1/RELA/CCR9/FOSL1/PRF1/CXCR2/KIR2DL4/HLA-G/HLA-G/HLA-G/HLA-G/HLA-G/HLA-G/HLA-G/KIR2DL4/KIR2DL4/KIR2DL4/KIR2DL4/KIR2DL4/KIR2DL4/KIR2DL4/KIR2DL4/KIR2DL4/KIR2DL4/KIR2DS3/KIR2DL4/KIR2DL4/KIR2DL4/KIR2DL4/HLA-G/KIR2DL4/KIR2DL4/KIR2DL4/KIR2DS3/KIR2DS3/KIR2DL4/KIR2DL4/KIR2DL4/KIR2DS3/KIR2DL4/KIR2DL4/KIR2DL4/KIR2DL4/KIR2DL4/KIR2DS3/KIR2DL4/KIR2DL4/KIR2DL4/KIR2DL4/KIR2DL4/KIR2DL4/KIR2DS3/KIR2DL4/KIR2DL4/KIR2DL4/KIR2DL4/KIR2DL4/KIR2DL4/KIR2DS3 | 65 |
| GO:0019221 | cytokine-mediated signaling pathway | 192/3662 | 451/15509 | 1.45675e-19 | 9.12014e-18 | 5.48469e-18 | BAD/ADIPOR2/PAFAH1B1/CD4/CD74/BIRC3/FAS/CD44/TNFRSF1B/TNFRSF17/TRAF1/ZC3H15/SPI1/SP100/PRKACA/IL4R/UBE2K/PTPRC/IL12RB2/MAVS/IL5RA/IL12RB1/OSM/PDGFB/CTSG/NFKBIA/BIRC7/HCK/CCL22/CCL17/PYCARD/IL21R/IL7/LILRB1/IL27RA/JAK3/CXCL12/CSF3/CCL2/HPX/KRT18/SH2B3/IFNG/IL17A/IL12B/IL5/LIFR/WNT5A/IL1A/CCL20/DOK1/STAT1/LEPR/PADI2/MPL/TNFAIP3/ARG1/FOXO3/CSF3R/GPR75/EGR1/PTK2B/CXCR4/FLT3/CNTFR/H2BC11/RNF113A/IL1B/CD70/CCR7/IRF3/STAT5A/IRF5/EPO/PXDN/EDA2R/TRAF3/PIAS3/IL2RA/IL6/TANK/IL1RN/IL11RA/CCL21/BBS4/SMAD4/TNFRSF11A/CNOT9/SLIT2/IL2RG/UGCG/NOTCH1/COMMD7/IL18/CXCL13/KIT/APPL1/ADIPOR1/TNFRSF13C/CXCR5/IL6R/CCR5/JAK1/GFI1/RBM15/CXCR1/PF4/CSF2/SYK/WBP1L/TRIM44/FADD/NKIRAS2/CX3CR1/TNIP2/CXCL8/LIMS1/TRIM56/CCL11/CCL19/RELA/CCR9/STAT5B/LEP/FZD4/PTPN2/PTPN11/CXCR2/ADIPOQ/CSF1R/PLCB1/TRAIP/CCR4/IRAK1/SLIT3/CSF1/CIB1/SIGIRR/IL3RA/SOCS1/PRKN/YTHDF3/IFITM1/CXCR3/LILRB4/EPOR/IL1RAP/SRC/NKIRAS1/IFNA1/CSNK2B/TNF/TMSB4X/CRLF2/TNF/ACKR1/CHUK/CPNE1/TNF/CSNK2B/CSNK2B/TNF/TNF/CSNK2B/TNF/TNF/TNF/CSNK2B/IL10RB/CEBPA/NAIP/LSM14A/PTPRC/CCL5/CD24/CCL5/LILRB1/CCL4/CCL18/CCL4/LILRB4/NAIP/LILRB1/LILRB1/LILRB1/CCL4/CCL18/CCL18/LILRB4/LILRB4/NAIP/PRKACA | 192 |
| GO:2000772 | regulation of cellular senescence | 63/3662 | 93/15509 | 1.89678e-19 | 1.17562e-17 | 7.07e-18 | SIRT6/ARG2/ZMPSTE24/ABL1/BMPR1A/FBXO5/BCL6/NEK4/EEF1E1/PLK2/HMGA2/TERT/KIR2DL4/ZNF277/HLA-G/HLA-G/HLA-G/HLA-G/HLA-G/HLA-G/HLA-G/KIR2DL4/B2M/KIR2DL4/KIR2DL4/KIR2DL4/KIR2DL4/KIR2DL4/KIR2DL4/AKT3/KIR2DL4/KIR2DL4/KIR2DL4/KIR2DL4/KIR2DL4/KIR2DL4/KIR2DL4/HLA-G/MIF/KIR2DL4/KIR2DL4/KIR2DL4/KIR2DL4/KIR2DL4/KIR2DL4/KIR2DL4/KIR2DL4/KIR2DL4/KIR2DL4/KIR2DL4/KIR2DL4/KIR2DL4/KIR2DL4/KIR2DL4/KIR2DL4/KIR2DL4/KIR2DL4/KIR2DL4/KIR2DL4/KIR2DL4/KIR2DL4/KIR2DL4/PTEN | 63 |
| GO:0001912 | positive regulation of leukocyte mediated cytotoxicity | 66/3662 | 100/15509 | 2.23016e-19 | 1.36857e-17 | 8.23031e-18 | TYROBP/SPI1/PTPRC/P2RX7/IL12RB1/IL12B/CD160/ARG1/NECTIN2/IL21/MR1/CD1A/CD1C/CD1B/FADD/ITGAM/STAT5B/TAP2/HLA-E/HLA-G/TAP2/TAP2/HLA-DRA/HLA-B/HLA-E/HLA-A/HLA-A/HLA-G/TAP2/HLA-B/NCR3/HLA-A/HLA-A/HLA-B/HLA-E/NCR3/TAP2/HLA-A/HLA-DRA/TAP2/HLA-B/HLA-DRA/HLA-A/HLA-E/HLA-E/HLA-G/HLA-A/HLA-B/TAP2/HLA-G/HLA-E/HLA-DRA/HLA-G/HLA-A/HLA-G/NCR3/HLA-E/NCR3/NCR3/HLA-G/TAP2/NCR3/PTPRC/B2M/HLA-G/HLA-DRA | 66 |
| GO:0045089 | positive regulation of innate immune response | 99/3662 | 182/15509 | 2.33408e-19 | 1.4183e-17 | 8.5294e-18 | TYROBP/SPI1/UBE2K/XRCC5/MAVS/HCK/RIOK3/TLR8/PYCARD/HPX/IL12B/WNT5A/CD160/IRF3/NECTIN2/TRIM5/POLR3F/AKIRIN2/TLR4/IL21/SLC15A4/NONO/GBP5/SYK/MBL2/NOD2/FADD/POLR3D/TRIM56/STAT5B/PAK2/HEXIM1/CARD9/PLSCR1/KIR2DL4/HMGB1/SRC/HLA-E/HLA-G/HLA-E/HLA-G/NCR3/HLA-E/NCR3/HLA-E/HLA-E/HLA-G/HLA-G/HLA-E/HLA-G/HLA-G/NCR3/HLA-E/NCR3/NCR3/HLA-G/NCR3/PRKDC/LSM14A/CCL5/KIR2DL4/KIR2DL4/KIR2DL4/KIR2DL4/CCL5/KIR2DL4/KIR2DL4/KIR2DL4/KIR2DL4/KIR2DL4/KIR2DL4/KIR2DL4/KIR2DL4/KIR2DL4/KIR2DL4/HLA-G/KIR2DL4/KIR2DL4/KIR2DL4/KIR2DL4/KIR2DL4/KIR2DL4/KIR2DL4/KIR2DL4/KIR2DL4/KIR2DL4/KIR2DL4/KIR2DL4/KIR2DL4/KIR2DL4/KIR2DL4/KIR2DL4/KIR2DL4/KIR2DL4/KIR2DL4/KIR2DL4/KIR2DL4/KIR2DL4/KIR2DL4 | 99 |
| GO:0002711 | positive regulation of T cell mediated immunity | 63/3662 | 94/15509 | 4.43313e-19 | 2.66763e-17 | 1.60426e-17 | FOXP3/TBX21/PTPRC/P2RX7/IL12RB1/GATA3/CD81/IL12B/IL4/IL1B/NECTIN2/IL6/IL18/MR1/CD1A/CD1C/CD1B/FADD/ZP3/CD55/TAP2/HLA-E/HLA-G/TAP2/TAP2/HLA-DRA/HLA-B/HLA-E/HLA-A/HLA-A/HLA-G/TAP2/HLA-B/HLA-A/HLA-A/HLA-B/HLA-E/TAP2/HLA-A/HLA-DRA/TAP2/HLA-B/HLA-DRA/HLA-A/HLA-E/HLA-E/HLA-G/HLA-A/HLA-B/TAP2/HLA-G/HLA-E/HLA-DRA/HLA-G/HLA-A/HLA-G/HLA-E/HLA-G/TAP2/PTPRC/B2M/HLA-G/HLA-DRA | 63 |
| GO:0046634 | regulation of alpha-beta T cell activation | 79/3662 | 132/15509 | 4.62205e-19 | 2.75456e-17 | 1.65655e-17 | HFE/RUNX3/FOXP3/PRDM1/AP3D1/RHOA/CBFB/TBX21/IL4R/ARG2/PTPRC/IL12RB1/SMAD7/LILRB1/JAK3/GATA3/ZBTB16/CD81/IFNG/IL12B/IL4/BCL6/CD86/ZAP70/CD160/MYB/CD80/TWSG1/NDFIP1/RARA/AP3B1/PTPN22/IL2RA/HLX/IRF4/IL2RG/IL18/RUNX1/TGFBR2/SHH/SYK/LGALS9/CCL19/CD28/KLHL25/SOCS1/LILRB4/HMGB1/CD55/PNP/HLA-E/HLA-DRA/HLA-E/HLA-A/HLA-A/HLA-A/HLA-A/HLA-E/HLA-A/HLA-DRA/HLA-DRA/HLA-A/HLA-E/HLA-E/HLA-A/HLA-E/HLA-DRA/HLA-A/HLA-E/PTPRC/LILRB1/LILRB4/LILRB1/LILRB1/HLA-DRA/LILRB1/LILRB4/LILRB4/ITCH | 79 |
| GO:0032946 | positive regulation of mononuclear cell proliferation | 90/3662 | 160/15509 | 5.262e-19 | 3.10608e-17 | 1.86794e-17 | CD38/BTK/IGF1/CD74/FOXP3/ST6GAL1/PTPRC/IL12RB1/CD40/NFATC2/CD40LG/PYCARD/IL7/IL27RA/JAK3/CD81/IL12B/IL4/IL5/BCL6/CD86/HES1/IL1A/ZAP70/IGFBP2/MPL/GPAM/CD80/CDKN1A/IL1B/TNFSF9/CD70/EPO/EPHB2/PTPN22/IL2RA/IL6/TLR4/IL21/SLC7A1/IL18/TNFRSF13C/ICOSLG/VCAM1/TGFBR2/SPTA1/SHH/SYK/FADD/LGALS9/BCL2L1/CCL19/STAT5B/LEP/CD28/CSF1/ZP3/HMGB1/CD55/PDCD1LG2/PNP/HLA-E/HLA-E/HLA-A/HLA-A/HLA-DPB1/HLA-DPB1/HLA-A/HLA-A/HLA-E/HLA-DPB1/HLA-A/HLA-A/HLA-E/HLA-DPB1/HLA-E/HLA-DPB1/HLA-DPB1/HLA-DPA1/HLA-A/HLA-E/HLA-A/HLA-E/HLA-DPB1/HLA-DPB1/PTPRC/CCL5/CD24/CCL5/MIF | 90 |
| GO:0032496 | response to lipopolysaccharide | 144/3662 | 310/15509 | 5.50794e-19 | 3.22059e-17 | 1.9368e-17 | UPF1/MPO/PAF1/SELE/BTK/LTF/SLC11A1/CPS1/TNFRSF1B/FOXP3/SPI1/FGFR2/RHOA/IL12RB2/OPRK1/APOB/CHMP5/P2RX7/CEBPE/ABL1/XBP1/CTSG/PABPN1/PCK2/NFKBIA/HCK/GATA1/ACP5/PYCARD/LILRB1/TGFB1/HAMP/SERPINE1/MAPK8/CSF3/RPS6KB1/CCL2/CYP27B1/AICDA/PPARD/MAPK14/IL12B/CD86/WNT5A/IL1A/FASLG/TNFAIP3/ARG1/CD80/NR4A1/IL1B/CCR7/NR1D1/IRF3/ZFP36/CD68/EPO/ASS1/AKAP12/RARA/TRIM5/EPHB2/PTPN22/CD36/AKIRIN2/EDNRB/IL6/IL10/TLR4/IL18BP/SMAD6/CYP1A1/IRF8/TNFRSF11A/DUSP10/REN/ALAD/NOTCH1/IL18/BMP6/CD96/PRKCA/CXCL13/ADAMTS13/CCR5/GFI1/VCAM1/MAPKAPK2/IL24/CAPN2/PF4/CASP3/CSF2/NOS3/NOD2/PRDX2/CX3CR1/ADAM9/TNIP2/LGALS9/PTAFR/CXCL8/FOS/CD14/PRKCE/CEBPB/RELA/CNP/SELP/F2R/IRAK1/CSF1/PDE4B/SIGIRR/CNR2/HMGB1/CD55/SRC/SHPK/ELANE/PDCD1LG2/TNF/TNF/LTA/TNF/LTA/TNF/TNF/TNF/TNF/LTA/LTA/TNF/LTA/CCL5/CCL5/PRPF8/LILRB1/LILRB1/MIF/LILRB1/ELANE/LILRB1/ADAMTS13 | 144 |
| GO:0045580 | regulation of T cell differentiation | 93/3662 | 168/15509 | 5.92645e-19 | 3.43291e-17 | 2.06449e-17 | BAD/CD74/RUNX3/ARID1B/FOXP3/PRDM1/AP3D1/RHOA/CBFB/TBX21/GLI2/ACTB/IL4R/PTPRC/IL12RB1/ABL1/SMARCB1/XBP1/SMAD7/IL7/JAK3/GATA3/ZMIZ1/SMARCD2/ZBTB16/MDK/IFNG/IL12B/IL4/BCL6/CD86/ZAP70/ARID1A/MYB/FOXO3/CD80/SOX4/TNFSF9/FOXJ1/RARA/AP3B1/IL2RA/HLX/IRF4/SOD1/DUSP10/IL2RG/ZEB1/IL18/RUNX1/TGFBR2/CTLA4/SHH/SYK/BRD7/RAG1/PRDX2/RHOH/LGALS9/PRELID1/CCL19/KAT5/STAT5B/RAG2/PTPN2/CD28/KLHL25/SOCS1/LILRB4/ARID2/HMGB1/NRARP/PNP/CR1/HLA-DOA/HLA-G/HLA-DRA/HLA-G/HLA-DRA/HLA-DRA/HLA-G/HLA-G/HLA-DRA/HLA-G/HLA-G/HLA-G/PTPRC/SMARCB1/LILRB4/HLA-G/HLA-DRA/LILRB4/LILRB4 | 93 |
| GO:0071216 | cellular response to biotic stimulus | 117/3662 | 233/15509 | 6.28229e-19 | 3.60534e-17 | 2.16819e-17 | UPF1/PAF1/BTK/LTF/TNFRSF1B/HSPA5/SPI1/RHOA/SIRT2/SMC1A/FCGR2B/OPRK1/GSK3B/ZMPSTE24/CHMP5/CEBPE/ABL1/XBP1/CTSG/PABPN1/NFKBIA/HCK/GATA1/PYCARD/LILRB1/TGFB1/HAMP/SERPINE1/MAPK8/CSF3/CCDC47/CCL2/AICDA/PPARD/MAPK14/IL12B/CD86/WNT5A/IL1A/TNFAIP3/ARG1/CD80/IL1B/NR1D1/IRF3/ZFP36/CD68/ASS1/RARA/TRIM5/EPHB2/PTPN22/NOTCH2/CD36/EDNRB/IL6/IL10/TLR4/IGFBPL1/IRF8/TMCO1/NOTCH1/IL18/BCL2L11/BMP6/PRKCA/EME1/CXCL13/PPP1R15B/ADAMTS13/CCR5/GFI1/IL24/CAPN2/PF4/CSF2/NOS3/SYK/NOD2/PRDX2/CX3CR1/ADAM9/TNIP2/PTAFR/CXCL8/CD14/PRKCE/EIF2AK3/CEBPB/RELA/DDIT3/IRAK1/PDE4B/SIGIRR/HMGB1/CD55/SRC/SHPK/PDCD1LG2/TNF/TNF/TNF/TNF/TNF/TNF/TNF/TNF/TXNIP/CCL5/CCL5/PRPF8/LILRB1/LILRB1/MIF/LILRB1/LILRB1/ADAMTS13 | 117 |
| GO:0070665 | positive regulation of leukocyte proliferation | 96/3662 | 176/15509 | 6.35732e-19 | 3.61492e-17 | 2.17395e-17 | CD38/BTK/IGF1/CD74/FOXP3/ST6GAL1/PTPRC/IL5RA/IL12RB1/CD40/NFATC2/CD40LG/PYCARD/IL7/IL27RA/JAK3/CD81/IL12B/IL4/IL5/BCL6/CD86/HES1/IL1A/ZAP70/IGFBP2/MPL/GPAM/CD80/CDKN1A/IL1B/TNFSF9/CD70/RAC2/EPO/EPHB2/PTPN22/IL2RA/IL6/TLR4/IL21/SLC7A1/IL18/KIT/TNFRSF13C/ICOSLG/VCAM1/TGFBR2/SPTA1/CSF2/SHH/SYK/FADD/LGALS9/PTK2/BCL2L1/CCL19/STAT5B/LEP/CD28/CSF1R/CSF1/ZP3/HMGB1/CD55/PDCD1LG2/PNP/HLA-E/HLA-E/HLA-A/HLA-A/HLA-DPB1/HLA-DPB1/HLA-A/HLA-A/HLA-E/HLA-DPB1/HLA-A/HLA-A/HLA-E/HLA-DPB1/HLA-E/HLA-DPB1/HLA-DPB1/HLA-DPA1/HLA-A/HLA-E/HLA-A/HLA-E/HLA-DPB1/HLA-DPB1/PTPRC/CCL5/CD24/CCL5/MIF | 96 |
| GO:0042102 | positive regulation of T cell proliferation | 74/3662 | 121/15509 | 1.05372e-18 | 5.93722e-17 | 3.57054e-17 | IGF1/FOXP3/PTPRC/IL12RB1/CD40LG/PYCARD/IL27RA/JAK3/CD81/IL12B/IL4/CD86/HES1/IL1A/ZAP70/IGFBP2/GPAM/CD80/IL1B/TNFSF9/CD70/EPO/PTPN22/IL2RA/IL6/IL21/SLC7A1/IL18/TNFRSF13C/ICOSLG/VCAM1/TGFBR2/SPTA1/SHH/SYK/FADD/LGALS9/CCL19/STAT5B/LEP/CD28/ZP3/HMGB1/CD55/PDCD1LG2/PNP/HLA-E/HLA-E/HLA-A/HLA-A/HLA-DPB1/HLA-DPB1/HLA-A/HLA-A/HLA-E/HLA-DPB1/HLA-A/HLA-A/HLA-E/HLA-DPB1/HLA-E/HLA-DPB1/HLA-DPB1/HLA-DPA1/HLA-A/HLA-E/HLA-A/HLA-E/HLA-DPB1/HLA-DPB1/PTPRC/CCL5/CD24/CCL5 | 74 |
| GO:0002377 | immunoglobulin production | 94/3662 | 173/15509 | 2.08982e-18 | 1.16691e-16 | 7.01758e-17 | BTK/CD22/PARP3/FOXP3/TCF3/FCGR2B/TBX21/MLH1/IL4R/PTPRC/MSH2/XBP1/CD40/CD40LG/NBN/IL27RA/GPI/TGFB1/EXOSC3/NSD2/HPX/AICDA/IL4/IL5/BCL6/CD86/SHLD2/PKN1/NDFIP1/EPHB2/IL6/IL10/IL21/SLC15A4/TMBIM6/TNFSF13/LIG4/CD28/HLA-DQB1/HLA-DQA1/CR1/HLA-DOA/TNF/HLA-E/HLA-DQB1/HLA-DQA1/HLA-DQB1/HLA-DQA1/HLA-DRA/TNF/HLA-E/HLA-DPB1/HLA-DQA1/HLA-DPB1/TNF/HLA-DQA1/HLA-E/HLA-DQB1/HLA-DQA1/HLA-DPB1/HLA-DRA/HLA-DQA1/TNF/TNF/TNF/HLA-DRA/HLA-E/HLA-DPB1/TNF/HLA-E/HLA-DPB1/HLA-DPB1/HLA-DRB4/HLA-DQB1/HLA-DPA1/HLA-DQA1/HLA-DQB1/HLA-DQA1/TNF/HLA-DQA1/HLA-DQB1/HLA-E/HLA-DRA/HLA-DQA1/HLA-E/HLA-DPB1/HLA-DQA1/HLA-DPB1/PRKDC/HLA-DQA1/PTPRC/B2M/HLA-DRA/GPI | 94 |
| GO:0032609 | interferon-gamma production | 81/3662 | 141/15509 | 5.41543e-18 | 2.97034e-16 | 1.78631e-16 | SLC11A1/BTN3A1/FOXP3/IL12RB2/IL12RB1/ABL1/TLR8/PYCARD/LILRB1/IL27RA/GATA3/C1QBP/IL12B/PDE4D/WNT5A/CD160/CD244/INHBA/IL1B/CCR7/RARA/PTPN22/IL10/TLR4/IL21/IRF8/IL18/CD96/TLR3/NOD2/FADD/LGALS9/CD14/HRAS/DDIT3/PDE4B/BTN3A2/LILRB4/ZP3/HMGB1/TLR7/CD47/PDCD1LG2/CR1/TNF/TNF/HLA-A/HLA-A/HLA-DPB1/HLA-DPB1/LTA/TNF/HLA-A/HLA-A/LTA/HLA-DPB1/HLA-A/TNF/TNF/TNF/HLA-A/HLA-DPB1/TNF/LTA/HLA-DPB1/HLA-DPB1/HLA-DPA1/LTA/HLA-A/TNF/HLA-A/HLA-DPB1/HLA-DPB1/LTA/LILRB1/LILRB4/LILRB1/LILRB1/LILRB1/LILRB4/LILRB4 | 81 |
| GO:0032649 | regulation of interferon-gamma production | 81/3662 | 141/15509 | 5.41543e-18 | 2.97034e-16 | 1.78631e-16 | SLC11A1/BTN3A1/FOXP3/IL12RB2/IL12RB1/ABL1/TLR8/PYCARD/LILRB1/IL27RA/GATA3/C1QBP/IL12B/PDE4D/WNT5A/CD160/CD244/INHBA/IL1B/CCR7/RARA/PTPN22/IL10/TLR4/IL21/IRF8/IL18/CD96/TLR3/NOD2/FADD/LGALS9/CD14/HRAS/DDIT3/PDE4B/BTN3A2/LILRB4/ZP3/HMGB1/TLR7/CD47/PDCD1LG2/CR1/TNF/TNF/HLA-A/HLA-A/HLA-DPB1/HLA-DPB1/LTA/TNF/HLA-A/HLA-A/LTA/HLA-DPB1/HLA-A/TNF/TNF/TNF/HLA-A/HLA-DPB1/TNF/LTA/HLA-DPB1/HLA-DPB1/HLA-DPA1/LTA/HLA-A/TNF/HLA-A/HLA-DPB1/HLA-DPB1/LTA/LILRB1/LILRB4/LILRB1/LILRB1/LILRB1/LILRB4/LILRB4 | 81 |
| GO:0050671 | positive regulation of lymphocyte proliferation | 87/3662 | 157/15509 | 7.38883e-18 | 4.01719e-16 | 2.41587e-16 | CD38/BTK/IGF1/CD74/FOXP3/PTPRC/IL12RB1/CD40/NFATC2/CD40LG/PYCARD/IL7/IL27RA/JAK3/CD81/IL12B/IL4/IL5/BCL6/CD86/HES1/IL1A/ZAP70/IGFBP2/MPL/GPAM/CD80/CDKN1A/IL1B/TNFSF9/CD70/EPO/EPHB2/PTPN22/IL2RA/IL6/TLR4/IL21/SLC7A1/IL18/TNFRSF13C/ICOSLG/VCAM1/TGFBR2/SPTA1/SHH/SYK/FADD/LGALS9/CCL19/STAT5B/LEP/CD28/ZP3/HMGB1/CD55/PDCD1LG2/PNP/HLA-E/HLA-E/HLA-A/HLA-A/HLA-DPB1/HLA-DPB1/HLA-A/HLA-A/HLA-E/HLA-DPB1/HLA-A/HLA-A/HLA-E/HLA-DPB1/HLA-E/HLA-DPB1/HLA-DPB1/HLA-DPA1/HLA-A/HLA-E/HLA-A/HLA-E/HLA-DPB1/HLA-DPB1/PTPRC/CCL5/CD24/CCL5/MIF | 87 |
| GO:0046635 | positive regulation of alpha-beta T cell activation | 59/3662 | 89/15509 | 1.31443e-17 | 7.08423e-16 | 4.26033e-16 | RUNX3/FOXP3/AP3D1/RHOA/CBFB/IL4R/PTPRC/IL12RB1/ZBTB16/CD81/IFNG/IL12B/CD86/ZAP70/CD160/MYB/CD80/RARA/AP3B1/PTPN22/HLX/IL2RG/IL18/RUNX1/TGFBR2/SHH/SYK/LGALS9/CCL19/CD28/KLHL25/SOCS1/LILRB4/CD55/PNP/HLA-E/HLA-DRA/HLA-E/HLA-A/HLA-A/HLA-A/HLA-A/HLA-E/HLA-A/HLA-DRA/HLA-DRA/HLA-A/HLA-E/HLA-E/HLA-A/HLA-E/HLA-DRA/HLA-A/HLA-E/PTPRC/LILRB4/HLA-DRA/LILRB4/LILRB4 | 59 |
| GO:0042270 | protection from natural killer cell mediated cytotoxicity | 29/3662 | 30/15509 | 1.41052e-17 | 7.53654e-16 | 4.53234e-16 | SERPINB9/HLA-E/HLA-G/HLA-B/HLA-E/HLA-A/HLA-A/HLA-G/HLA-B/HLA-A/HLA-A/HLA-B/HLA-E/HLA-A/HLA-B/HLA-A/HLA-E/HLA-E/HLA-G/HLA-A/HLA-B/HLA-G/HLA-E/HLA-G/HLA-A/HLA-G/HLA-E/HLA-G/HLA-G | 29 |
| GO:0032729 | positive regulation of interferon-gamma production | 63/3662 | 99/15509 | 2.28839e-17 | 1.21226e-15 | 7.29032e-16 | SLC11A1/BTN3A1/IL12RB2/IL12RB1/ABL1/TLR8/PYCARD/LILRB1/IL27RA/IL12B/PDE4D/WNT5A/CD160/CD244/IL1B/PTPN22/TLR4/IL21/IRF8/IL18/TLR3/FADD/LGALS9/CD14/HRAS/PDE4B/BTN3A2/ZP3/TLR7/TNF/TNF/HLA-A/HLA-A/HLA-DPB1/HLA-DPB1/LTA/TNF/HLA-A/HLA-A/LTA/HLA-DPB1/HLA-A/TNF/TNF/TNF/HLA-A/HLA-DPB1/TNF/LTA/HLA-DPB1/HLA-DPB1/HLA-DPA1/LTA/HLA-A/TNF/HLA-A/HLA-DPB1/HLA-DPB1/LTA/LILRB1/LILRB1/LILRB1/LILRB1 | 63 |
| GO:0002833 | positive regulation of response to biotic stimulus | 110/3662 | 222/15509 | 2.49369e-17 | 1.30982e-15 | 7.87705e-16 | TYROBP/GRN/CYBA/PUM2/SPI1/UBE2K/XRCC5/MAVS/HCK/RIOK3/TLR8/PYCARD/HPX/IL17A/IL12B/WNT5A/CD160/ARG1/IRF3/NECTIN2/TRIM5/POLR3F/AKIRIN2/TLR4/DDX60/IL21/SLC15A4/NONO/MR1/BMP6/PRKCA/GBP5/SYK/MBL2/NOD2/FADD/POLR3D/TRIM56/CD14/STAT5B/PAK2/HEXIM1/CARD9/PLSCR1/KIR2DL4/HMGB1/SRC/HLA-E/HLA-G/HLA-E/HLA-G/NCR3/HLA-E/NCR3/HLA-E/HLA-E/HLA-G/HLA-G/HLA-E/HLA-G/HLA-G/NCR3/HLA-E/NCR3/NCR3/HLA-G/NCR3/PRKDC/LSM14A/CCL5/KIR2DL4/KIR2DL4/KIR2DL4/KIR2DL4/CCL5/KIR2DL4/KIR2DL4/KIR2DL4/KIR2DL4/KIR2DL4/KIR2DL4/KIR2DL4/KIR2DL4/KIR2DL4/KIR2DL4/HLA-G/MIF/KIR2DL4/KIR2DL4/KIR2DL4/KIR2DL4/KIR2DL4/KIR2DL4/KIR2DL4/KIR2DL4/KIR2DL4/KIR2DL4/KIR2DL4/KIR2DL4/KIR2DL4/KIR2DL4/KIR2DL4/KIR2DL4/KIR2DL4/KIR2DL4/KIR2DL4/KIR2DL4/KIR2DL4/KIR2DL4/KIR2DL4 | 110 |
| GO:0043410 | positive regulation of MAPK cascade | 187/3662 | 459/15509 | 1.07183e-16 | 5.58253e-15 | 3.35724e-15 | WNT16/DHX33/NOX1/SPAG9/MAPK8IP2/CD4/IGF1/CD74/HGF/CD44/CASR/FLT4/EIF2AK2/TRAF1/HIPK2/MAP2K4/SPI1/FGFR2/ROCK1/FGFR3/NDST1/CDC42/EPHA8/FCGR2B/TRAF4/FGFR1/TP73/PTPRC/OPRK1/NOX4/P2RX7/ICAM1/ABL1/GADD45B/OSM/PDGFB/CD40/BIRC7/RASSF2/FLT1/CCL22/CCL17/NDRG4/AXIN1/PYCARD/CSK/PRKD2/TGFB1/PIK3CG/GSDME/NOD1/EZH2/TGFBR1/ACTA2/DKK1/CCL2/MAP2K6/LAMTOR3/CD81/FZD10/PDGFRB/WNT5A/IL1A/CCL20/GADD45A/NENF/TEK/PTK2B/IAPP/FLT3/INHBA/IL1B/BMP2/CCR7/PRMT1/KDR/LIF/AJUBA/SHC2/APOE/EPO/GDF15/AKAP12/EDA2R/TRAF3/TRIM5/CHI3L1/PTPN22/NOTCH2/PDGFRA/CD36/SPRY2/IL6/TLR4/CCL21/THBS1/PLCE1/FGF2/EGF/MAP3K12/IGF1R/ARRB2/TNFRSF11A/SOD1/APP/ARL6IP5/PDGFC/TPBG/EGFR/IGFBP3/NTRK2/NOTCH1/MBIP/PRKCA/NODAL/KIT/SHC1/DVL3/ALOX15/TLR3/GPER1/SYK/FRS2/NOD2/PRDX2/ADAM9/SEMA4C/LGALS9/EFNA1/ADRB2/CDH2/ALK/PRKCE/LPAR3/FGG/FGA/CCL11/CCL19/CSPG4/LEP/HRAS/FZD4/JUN/ERN1/PTPN11/F2R/CSF1R/PLCB1/ADRA2C/IRAK1/CIB1/CDK10/CARD9/WNT7B/HMGB1/PPIA/SRC/MAP3K5/ELANE/NTRK1/TNF/DOK6/TNF/TNF/TNF/TNF/TNF/TNF/TNF/NAIP/ITGB3/GH1/PTPRC/CCL5/CD24/CCL5/CCL4/CCL18/CCL4/NAIP/MIF/ELANE/CCL4/CCL18/CCL18/NAIP/PTEN | 187 |
| GO:0002474 | antigen processing and presentation of peptide antigen via MHC class I | 48/3662 | 67/15509 | 1.1129e-16 | 5.74814e-15 | 3.45683e-15 | HFE/MR1/ERAP2/TAP1/CALR/TAP2/HLA-E/HLA-G/TAP2/TAP1/TAP2/HLA-B/HLA-E/HLA-A/HLA-A/HLA-G/TAP2/HLA-B/HLA-A/TAP1/HLA-A/HLA-B/HLA-E/TAP2/TAP1/HLA-A/TAP1/TAP2/HLA-B/HLA-A/HLA-E/HLA-E/HLA-G/TAP1/HLA-A/TAPBP/HLA-B/TAP2/HLA-G/HLA-E/HLA-G/HLA-A/HLA-G/HLA-E/HLA-G/TAP2/B2M/HLA-G | 48 |
| GO:0030217 | T cell differentiation | 127/3662 | 277/15509 | 2.43878e-16 | 1.24922e-14 | 7.51259e-15 | BAD/TMEM98/CD4/CD74/RUNX3/ARID1B/FOXP3/PRDM1/AP3D1/SPI1/RHOA/CBFB/TBX21/GLI2/ACTB/IL4R/PTPRC/IL12RB1/ABL1/SMARCB1/XBP1/SMAD7/IL7/KDELR1/JAK3/TNFSF8/GATA3/PPP3CB/ZMIZ1/SMARCD2/ZBTB16/MDK/IFNG/IL12B/IL4/BCL6/CD86/IL1A/ZAP70/LEPR/ARID1A/MYB/FOXO3/EGR1/CD80/SOX4/RUNX2/IL1B/TNFSF9/CCR7/BCL11B/FOXJ1/RARA/AP3B1/PTPN22/IL2RA/IL6/HLX/IRF4/IL21/ARMC5/SOD1/DUSP10/PIK3R1/IL2RG/ZEB1/IL18/ZFP36L2/MR1/CD8A/KIT/RUNX1/IL6R/WNT4/TGFBR2/CTLA4/SHH/SYK/BRD7/RAG1/PRDX2/FADD/RHOH/LGALS9/PRELID1/CCL19/KAT5/CCR9/STAT5B/LIG4/LEP/RAG2/PTPN2/CD28/KLHL25/SOCS1/ZFP36L1/LILRB4/ARID2/HMGB1/ENTPD7/NRARP/MTOR/PNP/CR1/MAFB/HLA-DOA/HLA-G/HLA-DRA/HLA-G/HLA-DRA/HLA-DRA/HLA-G/HLA-G/HLA-DRA/HLA-G/HLA-G/HLA-G/PRKDC/PTPRC/B2M/SMARCB1/LILRB4/HLA-G/HLA-DRA/LILRB4/LILRB4 | 127 |
| GO:0033674 | positive regulation of kinase activity | 187/3662 | 463/15509 | 3.03026e-16 | 1.53947e-14 | 9.25811e-15 | BAD/DBF4/CD4/LTF/IGF1/SLC11A1/CD74/FLT4/EPHA3/ATP2B4/ERBB3/TIE1/FGFR2/RHOA/FGFR3/CDC42/EPHA8/MARK2/TRAF4/FGFR1/XRCC5/EPHA6/PTPRC/DUSP12/DLG3/PIBF1/NOX4/TPX2/P2RX7/GCN1/CCNK/CDC6/HSP90AB1/ABL1/PDGFB/TCL1A/CD40/ADNP/EEF1A2/CDC25B/RASSF2/CD40LG/FLT1/AXIN1/CSK/NBN/TGFB1/PIK3CG/MET/EZH2/BMPR1A/DKK1/MAP2K6/UNC119/LAMTOR3/AREG/CCND1/CD81/CALCA/FZD10/IFNG/NEDD9/CCND3/HBEGF/IL12B/IL4/RAD50/PPP2CA/PDGFRB/CD86/WNT5A/MOB1A/PARK7/PKD2/TEK/EGR1/CLU/TNFRSF10B/PTK2B/FLT3/CDKN1A/IL1B/BMP2/CCR7/ATG14/KDR/AJUBA/EPO/CHI3L1/EPHB2/CCNB1/PSRC1/PDGFRA/BORA/SPRY2/TLR4/CCL21/THBS1/FGF2/CENPE/EGF/MAP3K12/IGF1R/TNFRSF11A/EPHA2/CCN1/CALM2/EPHA5/PDGFC/EGFR/VLDLR/NTRK2/HMGA2/VEGFC/IL18/CACUL1/RANBP2/MERTK/KIT/CALM3/IL6R/MRNIP/DVL3/DBF4B/TGFBR2/PRKCD/RICTOR/TLR3/CDK5/SYK/NOD2/ADAM9/EFNA1/ADRB2/PTK2/GPRC5C/ALK/MOB3A/CCL19/CKS1B/DAG1/LEP/HRAS/FZD4/CDK5R1/CD19/ERN1/F2/PAK2/ADIPOQ/NPM1/CSF1R/EPHB3/ADRA2C/IRAK1/CSF1/CIB1/SOCS1/ROR1/PPIA/SRC/MAP3K5/ELANE/NTRK1/MTOR/TNF/DAXX/DAXX/TNF/TNF/DAXX/TNF/TNF/TNF/DAXX/TNF/DAXX/TNF/ITGB3/GH1/PTPRC/CCL5/CD24/CCL5/EPHB6/MIF/ELANE | 187 |
| GO:0002381 | immunoglobulin production involved in immunoglobulin-mediated immune response | 62/3662 | 101/15509 | 5.22433e-16 | 2.63255e-14 | 1.58317e-14 | BTK/PARP3/FOXP3/TBX21/MLH1/PTPRC/MSH2/CD40/CD40LG/NBN/IL27RA/TGFB1/EXOSC3/NSD2/AICDA/IL4/BCL6/SHLD2/NDFIP1/IL10/SLC15A4/TNFSF13/LIG4/CD28/HLA-DQB1/HLA-DQA1/HLA-DOA/HLA-DQB1/HLA-DQA1/HLA-DQB1/HLA-DQA1/HLA-DRA/HLA-DPB1/HLA-DQA1/HLA-DPB1/HLA-DQA1/HLA-DQB1/HLA-DQA1/HLA-DPB1/HLA-DRA/HLA-DQA1/HLA-DRA/HLA-DPB1/HLA-DPB1/HLA-DPB1/HLA-DRB4/HLA-DQB1/HLA-DPA1/HLA-DQA1/HLA-DQB1/HLA-DQA1/HLA-DQA1/HLA-DQB1/HLA-DRA/HLA-DQA1/HLA-DPB1/HLA-DQA1/HLA-DPB1/HLA-DQA1/PTPRC/B2M/HLA-DRA | 62 |
| GO:0002486 | antigen processing and presentation of endogenous peptide antigen via MHC class I via ER pathway, TAP-independent | 28/3662 | 30/15509 | 6.74063e-16 | 3.36923e-14 | 2.0262e-14 | HLA-E/HLA-G/HLA-B/HLA-E/HLA-A/HLA-A/HLA-G/HLA-B/HLA-A/HLA-A/HLA-B/HLA-E/HLA-A/HLA-B/HLA-A/HLA-E/HLA-E/HLA-G/HLA-A/HLA-B/HLA-G/HLA-E/HLA-G/HLA-A/HLA-G/HLA-E/HLA-G/HLA-G | 28 |
| GO:0032615 | interleukin-12 production | 51/3662 | 76/15509 | 9.65769e-16 | 4.75066e-14 | 2.85697e-14 | PIBF1/MAST2/CD40/TLR8/CD40LG/ACP5/MEFV/LILRB1/JAK3/C1QBP/MDK/IFNG/MAPK14/IL17A/IL12B/CCR7/IRF5/CD36/IL10/TLR4/THBS1/IRF8/ARRB2/TLR3/SYK/NOD2/LGALS9/IL16/CCL19/RELA/LEP/PLCB1/HMGB1/CD47/HLA-G/HLA-B/HLA-G/HLA-B/HLA-B/HLA-B/HLA-G/HLA-B/HLA-G/HLA-G/HLA-G/HLA-G/LILRB1/HLA-G/LILRB1/LILRB1/LILRB1 | 51 |
| GO:0032655 | regulation of interleukin-12 production | 51/3662 | 76/15509 | 9.65769e-16 | 4.75066e-14 | 2.85697e-14 | PIBF1/MAST2/CD40/TLR8/CD40LG/ACP5/MEFV/LILRB1/JAK3/C1QBP/MDK/IFNG/MAPK14/IL17A/IL12B/CCR7/IRF5/CD36/IL10/TLR4/THBS1/IRF8/ARRB2/TLR3/SYK/NOD2/LGALS9/IL16/CCL19/RELA/LEP/PLCB1/HMGB1/CD47/HLA-G/HLA-B/HLA-G/HLA-B/HLA-B/HLA-B/HLA-G/HLA-B/HLA-G/HLA-G/HLA-G/HLA-G/LILRB1/HLA-G/LILRB1/LILRB1/LILRB1 | 51 |
| GO:1903707 | negative regulation of hemopoiesis | 64/3662 | 107/15509 | 1.08915e-15 | 5.3154e-14 | 3.19659e-14 | LTF/SNAI2/CD74/RUNX3/HMGB3/FOXP3/CBFB/FCGR2B/TBX21/IL4R/SMAD7/SFRP1/LILRB1/JAK3/MDK/HSPA9/IL4/BCL6/ID2/IAPP/INHBA/LRRC17/FOXJ1/RARA/PIAS3/HLX/TLR4/CUL4A/TCTA/PIK3R1/RUNX1/CTLA4/TLR3/SHH/TNFRSF11B/PRDX2/INPP5D/GPR137/RAG2/PTPN2/ADIPOQ/SOCS1/LILRB4/HMGB1/NRARP/CR1/MAFB/HLA-G/HLA-G/HLA-G/HLA-G/HLA-G/HLA-G/HLA-G/CEBPA/LILRB1/LILRB4/HLA-G/LILRB1/LILRB1/LILRB1/LILRB4/LILRB4/INPP5D | 64 |
| GO:0002761 | regulation of myeloid leukocyte differentiation | 69/3662 | 121/15509 | 2.61319e-15 | 1.26536e-13 | 7.60962e-14 | CD4/TYROBP/LTF/CD74/TFE3/ACIN1/RASSF2/SFRP1/LILRB1/TGFB1/IFNG/NEDD9/IL17A/IL12B/IL4/IL5/ID2/IAPP/INHBA/LIF/LRRC17/NDFIP1/RARA/PIAS3/NOTCH2/TLR4/RB1/CUL4A/TCTA/PIK3R1/POU4F2/POU4F1/PRKCA/KLF10/RUNX1/PF4/SLC9B2/TLR3/TNFRSF11B/FADD/INPP5D/FOS/CEBPB/ESRRA/GPR137/PTPN2/CTNNBIP1/ADIPOQ/CSF1/ZFP36L1/LILRB4/MTOR/MAFB/TNF/TNF/TNF/TNF/TNF/TNF/TNF/TNF/LILRB1/LILRB4/LILRB1/LILRB1/LILRB1/LILRB4/LILRB4/INPP5D | 69 |
| GO:0030316 | osteoclast differentiation | 63/3662 | 106/15509 | 2.79904e-15 | 1.34484e-13 | 8.08763e-14 | PAFAH1B1/TYROBP/LTF/GAB2/TFE3/ATP6AP1/OSTM1/RASSF2/SFRP1/LILRB1/SH3PXD2A/CD81/IFNG/NEDD9/MAPK14/IL17A/IL12B/IL4/IAPP/LRRC17/PIAS3/NOTCH2/IREB2/TLR4/TNFRSF11A/EPHA2/TCTA/PIK3R1/POU4F2/POU4F1/KLF10/SLC9B2/TLR3/TNFRSF11B/INPP5D/FOS/CEBPB/ESRRA/GPR137/FAM20C/CSF1R/ANXA2/CSF1/LILRB4/SRC/MTOR/MAFB/TNF/TNF/TNF/TNF/TNF/TNF/TNF/TNF/LILRB1/LILRB4/LILRB1/LILRB1/LILRB1/LILRB4/LILRB4/INPP5D | 63 |
| GO:0071222 | cellular response to lipopolysaccharide | 98/3662 | 200/15509 | 3.45055e-15 | 1.64512e-13 | 9.89345e-14 | UPF1/PAF1/LTF/TNFRSF1B/SPI1/RHOA/OPRK1/CHMP5/CEBPE/ABL1/XBP1/CTSG/PABPN1/NFKBIA/HCK/GATA1/PYCARD/LILRB1/TGFB1/HAMP/SERPINE1/MAPK8/CSF3/CCL2/AICDA/PPARD/MAPK14/IL12B/CD86/WNT5A/IL1A/TNFAIP3/ARG1/CD80/IL1B/NR1D1/IRF3/ZFP36/CD68/ASS1/RARA/TRIM5/EPHB2/PTPN22/CD36/EDNRB/IL6/IL10/TLR4/IRF8/IL18/BMP6/PRKCA/CXCL13/ADAMTS13/CCR5/GFI1/IL24/CAPN2/PF4/CSF2/NOS3/NOD2/PRDX2/CX3CR1/ADAM9/TNIP2/PTAFR/CXCL8/CD14/PRKCE/CEBPB/RELA/IRAK1/PDE4B/SIGIRR/HMGB1/CD55/SRC/SHPK/PDCD1LG2/TNF/TNF/TNF/TNF/TNF/TNF/TNF/TNF/CCL5/CCL5/PRPF8/LILRB1/LILRB1/MIF/LILRB1/LILRB1/ADAMTS13 | 98 |
| GO:0071219 | cellular response to molecule of bacterial origin | 100/3662 | 206/15509 | 3.93079e-15 | 1.84802e-13 | 1.11137e-13 | UPF1/PAF1/LTF/TNFRSF1B/SPI1/RHOA/SIRT2/FCGR2B/OPRK1/CHMP5/CEBPE/ABL1/XBP1/CTSG/PABPN1/NFKBIA/HCK/GATA1/PYCARD/LILRB1/TGFB1/HAMP/SERPINE1/MAPK8/CSF3/CCL2/AICDA/PPARD/MAPK14/IL12B/CD86/WNT5A/IL1A/TNFAIP3/ARG1/CD80/IL1B/NR1D1/IRF3/ZFP36/CD68/ASS1/RARA/TRIM5/EPHB2/PTPN22/CD36/EDNRB/IL6/IL10/TLR4/IRF8/IL18/BMP6/PRKCA/CXCL13/ADAMTS13/CCR5/GFI1/IL24/CAPN2/PF4/CSF2/NOS3/NOD2/PRDX2/CX3CR1/ADAM9/TNIP2/PTAFR/CXCL8/CD14/PRKCE/CEBPB/RELA/IRAK1/PDE4B/SIGIRR/HMGB1/CD55/SRC/SHPK/PDCD1LG2/TNF/TNF/TNF/TNF/TNF/TNF/TNF/TNF/CCL5/CCL5/PRPF8/LILRB1/LILRB1/MIF/LILRB1/LILRB1/ADAMTS13 | 100 |
| GO:0018212 | peptidyl-tyrosine modification | 153/3662 | 365/15509 | 3.93577e-15 | 1.84802e-13 | 1.11137e-13 | BAZ1B/DYRK4/CD4/BTK/MVP/CLK1/IGF1/CNTN1/CD74/HGF/CD44/FLT4/EPHA3/EIF2AK2/HIPK2/ERBB3/MAP2K4/TIE1/FGFR2/PKM/HYAL2/FGFR3/EPHA8/FGFR1/EPHA6/PTPRC/IL12RB2/DLG3/PIBF1/NOX4/ABL1/OSM/PDGFB/CD40/ADNP/HCK/GATA1/FLT1/CSK/EHD4/SFRP1/IL7/TGFB1/JAK3/MET/CSF3/MAP2K6/UNC119/AREG/HPX/CD81/SH2B3/IFNG/NEDD9/HBEGF/IL12B/IL4/IL5/PPP2CA/PDGFRB/HES1/NCL/ZAP70/PDCL3/STK16/TEK/PTK2B/CD80/FLT3/DYRK2/KDR/LIF/EPO/VPS25/EPHB2/LRP4/PDGFRA/CD36/IL6/ABI2/IL21/EGF/IGF1R/ARRB2/SCYL1/APP/EPHA2/ABL2/DYRK3/EPHA5/PDGFC/EGFR/NCAPG2/NTRK2/IL18/BMP6/MERTK/KIT/DMTN/ITGB2/SHC1/IL6R/JAK1/IL24/PRKCD/RICTOR/IL3/CSF2/SYK/WEE1/ZNF592/NOD2/EFNA1/PTK2/TPST1/ALK/PRKCE/CSPG4/LEP/PTPN2/CHMP6/PTPN11/PAK2/ADIPOQ/CSF1R/EPHB3/SOCS1/ROR1/NF2/LILRB4/SRC/NTRK1/MTOR/TNF/TNF/TNF/TNF/TNF/TNF/TNF/TNF/ITGB3/GH1/PECAM1/PTPRC/CCL5/CD24/CCL5/EPHB6/LILRB4/MIF/LILRB4/LILRB4 | 153 |
| GO:0031400 | negative regulation of protein modification process | 181/3662 | 454/15509 | 4.03882e-15 | 1.88215e-13 | 1.13189e-13 | KDM1A/SPAG9/AASS/CRY1/MVP/UFL1/HGF/BAK1/FOXP3/ATP2B4/IPO5/KDM4A/SPI1/ROCK1/HYAL2/SIRT2/FBLN1/PTPRC/GSK3B/PIBF1/TMED2/PPP1R15A/BAX/RTRAF/DNMT3B/FKBP1A/ABL1/GADD45B/SMARCB1/GSKIP/BMP7/RASSF2/PPP1R16B/SMAD7/N4BP1/PARD6A/TSC2/PYCARD/SFRP1/TGFB1/HSPB1/ENG/DVL1/DKK1/CHORDC1/CORO1C/SH2B3/IFNG/FBXO5/ZNF451/PDE4D/PPP2CA/MACROH2A1/KAT2B/PRKAR2A/KDM3A/PARK7/GADD45A/P3H1/CDC20/TNFAIP3/PTPA/MASTL/TARDBP/CRY2/PKN1/LRP1/CDKN1A/SOX4/IL1B/BMP2/ATG14/STYXL1/CDKN1C/APOE/CEP85/DNMT1/VPS25/PIAS3/PER2/PRKAA1/EPHB2/MEN1/PTPN22/APC/MICAL1/NIBAN1/SPRY2/SORL1/SMAD6/TARBP2/RB1/WARS1/ARRB2/ENSA/DUSP10/CALM2/SPOPL/CTDSP1/SLIT2/BOD1/IGFBP3/NCAPG2/OGT/C9orf72/PARD3/HHEX/CNKSR3/UCHL1/GNAQ/SKI/PPP1R15B/DMTN/CTBP1/CALM3/TBC1D24/CAMK2N1/PRKCD/DUSP7/CASP3/CDK5/TRIM44/NXN/DDIT4/PKIG/RGS14/PRKCE/RELA/GLMN/CTDSP2/BANF1/PTPN2/CHMP6/JUN/SVBP/PLEC/TAF7/PAK2/ADIPOQ/NPM1/ADGRB1/SLC8A1/NOG/CIB1/INPP5J/SOCS1/PRKN/NF2/LILRB4/HEXIM1/SPRY4/NOC2L/PAX5/PPIA/WDR5/SPRED2/TNF/PPP1R11/AKT1S1/IPO7/TNF/TNF/TNF/TNF/TNF/TNF/TNF/DBNDD2/CEBPA/PRKDC/PTPRC/CDKN1C/SMARCB1/LILRB4/LILRB4/LILRB4/LRP6/SQSTM1/PTEN/TINF2/CHORDC1 | 181 |
| GO:1902106 | negative regulation of leukocyte differentiation | 61/3662 | 102/15509 | 5.14262e-15 | 2.37865e-13 | 1.43048e-13 | LTF/CD74/RUNX3/HMGB3/FOXP3/CBFB/FCGR2B/TBX21/IL4R/SMAD7/SFRP1/LILRB1/JAK3/MDK/IL4/BCL6/ID2/IAPP/INHBA/LRRC17/FOXJ1/RARA/PIAS3/HLX/TLR4/CUL4A/TCTA/PIK3R1/RUNX1/CTLA4/TLR3/SHH/TNFRSF11B/PRDX2/INPP5D/GPR137/RAG2/PTPN2/ADIPOQ/SOCS1/LILRB4/HMGB1/NRARP/CR1/MAFB/HLA-G/HLA-G/HLA-G/HLA-G/HLA-G/HLA-G/HLA-G/LILRB1/LILRB4/HLA-G/LILRB1/LILRB1/LILRB1/LILRB4/LILRB4/INPP5D | 61 |
| GO:0018108 | peptidyl-tyrosine phosphorylation | 152/3662 | 363/15509 | 5.40384e-15 | 2.48096e-13 | 1.49201e-13 | BAZ1B/DYRK4/CD4/BTK/MVP/CLK1/IGF1/CNTN1/CD74/HGF/CD44/FLT4/EPHA3/EIF2AK2/HIPK2/ERBB3/MAP2K4/TIE1/FGFR2/PKM/HYAL2/FGFR3/EPHA8/FGFR1/EPHA6/PTPRC/IL12RB2/DLG3/PIBF1/NOX4/ABL1/OSM/PDGFB/CD40/ADNP/HCK/GATA1/FLT1/CSK/EHD4/SFRP1/IL7/TGFB1/JAK3/MET/CSF3/MAP2K6/UNC119/AREG/HPX/CD81/SH2B3/IFNG/NEDD9/HBEGF/IL12B/IL4/IL5/PPP2CA/PDGFRB/HES1/NCL/ZAP70/PDCL3/STK16/TEK/PTK2B/CD80/FLT3/DYRK2/KDR/LIF/EPO/VPS25/EPHB2/LRP4/PDGFRA/CD36/IL6/ABI2/IL21/EGF/IGF1R/ARRB2/SCYL1/APP/EPHA2/ABL2/DYRK3/EPHA5/PDGFC/EGFR/NCAPG2/NTRK2/IL18/BMP6/MERTK/KIT/DMTN/ITGB2/SHC1/IL6R/JAK1/IL24/PRKCD/RICTOR/IL3/CSF2/SYK/WEE1/ZNF592/NOD2/EFNA1/PTK2/ALK/PRKCE/CSPG4/LEP/PTPN2/CHMP6/PTPN11/PAK2/ADIPOQ/CSF1R/EPHB3/SOCS1/ROR1/NF2/LILRB4/SRC/NTRK1/MTOR/TNF/TNF/TNF/TNF/TNF/TNF/TNF/TNF/ITGB3/GH1/PECAM1/PTPRC/CCL5/CD24/CCL5/EPHB6/LILRB4/MIF/LILRB4/LILRB4 | 152 |
| GO:0002396 | MHC protein complex assembly | 39/3662 | 52/15509 | 6.69071e-15 | 3.02693e-13 | 1.82035e-13 | CALR/HLA-DQB1/HLA-DQA1/HLA-DOA/HLA-DQB1/HLA-DQA1/HLA-DQB1/HLA-DQA1/HLA-DRA/HLA-DPB1/HLA-DQA1/HLA-DPB1/HLA-DQA1/HLA-DQB1/HLA-DQA1/HLA-DPB1/HLA-DRA/HLA-DQA1/HLA-DRA/HLA-DPB1/HLA-DPB1/HLA-DPB1/HLA-DRB4/HLA-DQB1/HLA-DPA1/HLA-DQA1/TAPBP/HLA-DQB1/HLA-DQA1/HLA-DQA1/HLA-DQB1/HLA-DRA/HLA-DQA1/HLA-DPB1/HLA-DQA1/HLA-DPB1/HLA-DQA1/B2M/HLA-DRA | 39 |
| GO:0002501 | peptide antigen assembly with MHC protein complex | 39/3662 | 52/15509 | 6.69071e-15 | 3.02693e-13 | 1.82035e-13 | CALR/HLA-DQB1/HLA-DQA1/HLA-DOA/HLA-DQB1/HLA-DQA1/HLA-DQB1/HLA-DQA1/HLA-DRA/HLA-DPB1/HLA-DQA1/HLA-DPB1/HLA-DQA1/HLA-DQB1/HLA-DQA1/HLA-DPB1/HLA-DRA/HLA-DQA1/HLA-DRA/HLA-DPB1/HLA-DPB1/HLA-DPB1/HLA-DRB4/HLA-DQB1/HLA-DPA1/HLA-DQA1/TAPBP/HLA-DQB1/HLA-DQA1/HLA-DQA1/HLA-DQB1/HLA-DRA/HLA-DQA1/HLA-DPB1/HLA-DQA1/HLA-DPB1/HLA-DQA1/B2M/HLA-DRA | 39 |
| GO:0048872 | homeostasis of number of cells | 122/3662 | 272/15509 | 7.16518e-15 | 3.2181e-13 | 1.93531e-13 | SLC4A1/KMT2E/BTK/UFL1/CD74/ALAS1/FAS/BAK1/TNFRSF17/FOXP3/KCNQ1/HIPK2/SPI1/BAX/P2RX7/ABL1/MTHFD1/ACIN1/RASSF2/GATA1/IL7/ERCC2/GPI/KLF1/JAK3/HAMP/HOXA5/ZNHIT1/EZH2/GATA3/PPP3CB/SEPTIN4/HOXB6/SLC11A2/SH2B3/MAPK14/RHAG/HSPA9/SMAD5/BCL6/STAT1/ID2/EPAS1/MPL/PRDX1/TNFAIP3/MYB/FOXO3/PTBP3/GPAM/FLT3/INHBA/PKN1/SOX4/THRA/CCR7/PRMT1/ZFP36/EPO/AP3B1/KRAS/IL2RA/ABCB10/IL6/IREB2/CCN3/SLC15A4/RB1/PMAIP1/SOD1/ARNT/DYRK3/UBAP2L/NCAPG2/NOTCH1/BCL2L11/MERTK/KIT/TSC22D3/XKR8/FANCC/ALAS2/DMTN/TAL1/SPTA1/BAP1/CASP3/SFXN1/NOS3/RAG1/LMO1/EPB42/PRDX2/FADD/CX3CR1/INPP5D/LGALS9/AHSP/CDH2/STAT5B/PTPN2/PTPN11/CXCR2/F2R/RPS17/CCR4/CSF1/PDE4B/ZFP36L1/CDIN1/CARD9/HMGB1/L3MBTL3/MAFB/GIGYF2/TNFRSF13B/PRKDC/B2M/AKT3/MIF/INPP5D/GPI | 122 |
| GO:0002399 | MHC class II protein complex assembly | 37/3662 | 48/15509 | 7.30258e-15 | 3.23296e-13 | 1.94424e-13 | HLA-DQB1/HLA-DQA1/HLA-DOA/HLA-DQB1/HLA-DQA1/HLA-DQB1/HLA-DQA1/HLA-DRA/HLA-DPB1/HLA-DQA1/HLA-DPB1/HLA-DQA1/HLA-DQB1/HLA-DQA1/HLA-DPB1/HLA-DRA/HLA-DQA1/HLA-DRA/HLA-DPB1/HLA-DPB1/HLA-DPB1/HLA-DRB4/HLA-DQB1/HLA-DPA1/HLA-DQA1/HLA-DQB1/HLA-DQA1/HLA-DQA1/HLA-DQB1/HLA-DRA/HLA-DQA1/HLA-DPB1/HLA-DQA1/HLA-DPB1/HLA-DQA1/B2M/HLA-DRA | 37 |
| GO:0002503 | peptide antigen assembly with MHC class II protein complex | 37/3662 | 48/15509 | 7.30258e-15 | 3.23296e-13 | 1.94424e-13 | HLA-DQB1/HLA-DQA1/HLA-DOA/HLA-DQB1/HLA-DQA1/HLA-DQB1/HLA-DQA1/HLA-DRA/HLA-DPB1/HLA-DQA1/HLA-DPB1/HLA-DQA1/HLA-DQB1/HLA-DQA1/HLA-DPB1/HLA-DRA/HLA-DQA1/HLA-DRA/HLA-DPB1/HLA-DPB1/HLA-DPB1/HLA-DRB4/HLA-DQB1/HLA-DPA1/HLA-DQA1/HLA-DQB1/HLA-DQA1/HLA-DQA1/HLA-DQB1/HLA-DRA/HLA-DQA1/HLA-DPB1/HLA-DQA1/HLA-DPB1/HLA-DQA1/B2M/HLA-DRA | 37 |
| GO:0048659 | smooth muscle cell proliferation | 77/3662 | 144/15509 | 8.00093e-15 | 3.51701e-13 | 2.11507e-13 | NOX1/IGF1/CYBA/FGFR2/RHOA/NOTCH3/XRCC5/MMP2/PDGFB/MMP9/NDRG4/TGFB1/BMPR1A/RPS6KB1/IFNG/PPARD/HBEGF/IL12B/PDGFRB/STAT1/ID2/HDAC1/MFN2/TNFAIP3/NR4A3/GNA13/CDKN1A/BMP2/APOE/DNMT1/IL6/IL10/TLR4/CCN3/THBS1/FGF2/IGF1R/GNA12/IGFBP3/TCF7L2/IL18/GJA1/ADAMTS1/LDLRAP1/IL6R/TGFBR2/TERT/GPER1/NOS3/NDRG2/FRS2/PTAFR/S1PR1/DDIT3/JUN/CTNNBIP1/ERN1/ADIPOQ/RBM10/IRAK1/SRC/MAP3K5/ELANE/TNF/TNF/TNF/TNF/TNF/TNF/TNF/TNF/PRKDC/ITGB3/CCL5/CCL5/ELANE/PTEN | 77 |
| GO:0002475 | antigen processing and presentation via MHC class Ib | 29/3662 | 33/15509 | 8.8953e-15 | 3.88261e-13 | 2.33493e-13 | AP3D1/AP3B1/CD1A/CD1C/CD1B/TAP2/HLA-E/HLA-G/TAP2/TAP2/HLA-E/HLA-G/TAP2/HLA-E/TAP2/TAP2/HLA-E/HLA-E/HLA-G/TAP2/HLA-G/HLA-E/HLA-G/HLA-G/HLA-E/HLA-G/TAP2/B2M/HLA-G | 29 |
| GO:2001233 | regulation of apoptotic signaling pathway | 140/3662 | 328/15509 | 1.04715e-14 | 4.53863e-13 | 2.72945e-13 | BAD/KDM1A/NOX1/MAPK8IP2/IGF1/SNAI2/CD74/HGF/FAS/CD44/BAK1/HERPUD1/TRAF1/NGFR/TMEM161A/SP100/HYAL2/CSNK2A2/TP63/FGFR1/PTPRC/GSK3B/BAX/DNM1L/ICAM1/TMEM14A/XBP1/MMP9/SRPX/GATA1/PYCARD/EYA1/SFRP1/IL7/URI1/GSDME/CASP2/HSPB1/SERPINE1/TGFBR1/CREB3/CXCL12/UNC5B/PPIF/SEPTIN4/RPS6KB1/CTSC/PTPMT1/EYA4/IL4/IL1A/PARK7/HDAC1/TNFAIP3/HELLS/CLU/TNFSF10/INHBA/EEF1E1/IL1B/RBCK1/PLAGL2/BECN1/TRAP1/STYXL1/BCL2L2/EPO/PSME3/SERINC3/ITM2C/THBS1/BCL2L10/ITGAV/COL2A1/TMBIM6/RB1/ARRB2/PMAIP1/SOD1/PARP1/NONO/TCF7L2/BCL2L11/NR4A2/FAIM/LMNA/ZNF385A/RPL26/WNT4/PEA15/ATF3/INHBB/PF4/PRKCD/TERT/CSF2/GPER1/NOS3/FXN/PRDX2/FADD/CX3CR1/PRELID1/TRIAP1/BCL2L1/FGG/FGA/SCG2/EIF2AK3/RELA/DDIT3/PTPN2/BDNF/GRINA/PAK2/PTTG1IP/NOG/PRKN/MUC1/ASAH2/FZD9/NOC2L/PPIA/SRC/TNF/TNF/NDUFS3/FIS1/MAGEA3/TNF/TNF/TNF/TNF/TNF/TNF/PTPRC/AATF/MIF/PCGF2/PTEN | 140 |
| GO:0002262 | myeloid cell homeostasis | 80/3662 | 154/15509 | 2.01522e-14 | 8.67385e-13 | 5.2163e-13 | SLC4A1/KMT2E/BTK/UFL1/ALAS1/BAK1/FOXP3/KCNQ1/HIPK2/SPI1/BAX/MTHFD1/ACIN1/GATA1/ERCC2/GPI/KLF1/JAK3/HAMP/HOXA5/GATA3/HOXB6/SLC11A2/SH2B3/MAPK14/RHAG/HSPA9/SMAD5/BCL6/STAT1/ID2/EPAS1/MPL/PRDX1/MYB/FOXO3/PTBP3/INHBA/THRA/PRMT1/ZFP36/EPO/ABCB10/IL6/IREB2/SLC15A4/RB1/SOD1/ARNT/DYRK3/NCAPG2/BCL2L11/MERTK/KIT/XKR8/FANCC/ALAS2/DMTN/TAL1/BAP1/CASP3/SFXN1/EPB42/INPP5D/AHSP/STAT5B/PTPN2/CXCR2/RPS17/CSF1/PDE4B/ZFP36L1/CDIN1/HMGB1/L3MBTL3/MAFB/PRKDC/B2M/INPP5D/GPI | 80 |
| GO:0048660 | regulation of smooth muscle cell proliferation | 75/3662 | 141/15509 | 2.57911e-14 | 1.10244e-12 | 6.62987e-13 | NOX1/IGF1/CYBA/FGFR2/RHOA/NOTCH3/XRCC5/MMP2/PDGFB/MMP9/NDRG4/TGFB1/BMPR1A/RPS6KB1/IFNG/PPARD/HBEGF/IL12B/PDGFRB/STAT1/ID2/HDAC1/MFN2/TNFAIP3/NR4A3/GNA13/CDKN1A/BMP2/APOE/DNMT1/IL6/IL10/TLR4/THBS1/FGF2/IGF1R/GNA12/IGFBP3/TCF7L2/IL18/GJA1/ADAMTS1/LDLRAP1/IL6R/TGFBR2/TERT/GPER1/NOS3/NDRG2/FRS2/PTAFR/S1PR1/JUN/CTNNBIP1/ERN1/ADIPOQ/RBM10/IRAK1/SRC/MAP3K5/ELANE/TNF/TNF/TNF/TNF/TNF/TNF/TNF/TNF/PRKDC/ITGB3/CCL5/CCL5/ELANE/PTEN | 75 |
| GO:0002437 | inflammatory response to antigenic stimulus | 53/3662 | 85/15509 | 2.72316e-14 | 1.15604e-12 | 6.95221e-13 | BTK/KARS1/FCGR2B/MKRN2/IL5RA/HCK/GATA3/CD81/MAPK14/IL12B/PARK7/C3/CCR7/CD68/NOTCH2/IL2RA/IL10/IL1RN/FURIN/PLK2/NOTCH1/PSMB4/SYK/NOD2/RBPJ/A2M/CD28/CXCR2/ZP3/HMGB1/SRC/ELANE/TNF/HLA-E/TNF/HLA-E/LTA/TNF/HLA-E/LTA/TNF/TNF/TNF/HLA-E/TNF/HLA-E/LTA/LTA/TNF/HLA-E/HLA-E/LTA/ELANE | 53 |
| GO:0002863 | positive regulation of inflammatory response to antigenic stimulus | 28/3662 | 32/15509 | 3.33407e-14 | 1.40575e-12 | 8.45396e-13 | BTK/KARS1/CD81/PARK7/C3/CCR7/CD28/ZP3/TNF/HLA-E/TNF/HLA-E/LTA/TNF/HLA-E/LTA/TNF/TNF/TNF/HLA-E/TNF/HLA-E/LTA/LTA/TNF/HLA-E/HLA-E/LTA | 28 |
| GO:0034612 | response to tumor necrosis factor | 107/3662 | 233/15509 | 4.87722e-14 | 2.0425e-12 | 1.22833e-12 | SELE/BIRC3/FAS/TNFRSF1B/YTHDC2/TNFRSF17/CYBA/TRAF1/HYAL2/UBE2K/APOB/TCL1A/PCK2/NFKBIA/CD40/BIRC7/CCL22/CCL17/PYCARD/SFRP1/ASAH1/HAMP/GSDME/GATA3/RPS6KB1/CCL2/CALCA/KRT18/MAPK14/HES1/CCL20/STAT1/TNFAIP3/FOXO3/PTK2B/H2BC11/CD70/NR1D1/ZFP36/ASS1/AKAP12/EDA2R/TRAF3/PIAS3/CHI3L1/ADAMTS7/TANK/CCL21/IL18BP/THBS1/CYP1B1/TNFRSF11A/AFF3/TNFRSF21/COMMD7/ZFP36L2/TNFRSF13C/ADAMTS13/VCAM1/CASP3/GPER1/SYK/GPD1/NKIRAS2/ADAM9/CXCL8/LIMS1/FOS/CD14/CCL11/CCL19/RELA/PTPN2/ADIPOQ/TRAIP/CIB1/PRKN/ZFP36L1/TRPV1/MAP3K5/NKIRAS1/MBP/TNF/TMSB4X/TNF/CHUK/CPNE1/TNF/TNF/TNF/TNF/TNF/TNF/CEBPA/NAIP/CCL5/CCL5/PRPF8/CCL4/CCL18/CCL4/NAIP/CCL4/CCL18/CCL18/NAIP/ADAMTS13 | 107 |
| GO:0001525 | angiogenesis | 190/3662 | 494/15509 | 5.04159e-14 | 2.09717e-12 | 1.2612e-12 | ITGA2B/ADIPOR2/NOX1/E2F2/DCN/HGF/RNH1/GRN/SARS1/FLT4/ATP2B4/EPN1/NGFR/HIPK2/TIE1/FGFR2/SP100/PKM/RHOA/ROCK1/NOTCH3/MCAM/SIRT6/MMP2/APOH/ANGPT2/AGO1/ABL1/XBP1/MYH9/CD40/POFUT1/PPP1R16B/FLT1/TJP1/SFRP1/PRKD2/PIK3CG/HOXA5/HSPB1/SERPINE1/TGFBR1/ENG/UNC5B/CCL2/MDK/MAPK14/SMOC2/IL12B/PDGFRB/AMOTL2/WNT5A/IL1A/NCL/FN1/STAT1/PDCL3/EPAS1/LEPR/GADD45A/WARS2/CD160/FASLG/NRP2/TNFAIP3/PGF/GNA13/TEK/PTK2B/CXCR4/RECK/NR4A1/IL1B/C3/ID1/RRAS/KDR/PXDN/CHI3L1/EPHB2/BTG1/LOXL2/NOTCH2/PDGFRA/CEMIP2/SRPK2/GLUL/SPRY2/IL6/CCM2/IL10/CCN3/THBS1/CYP1B1/ITGAV/FGF2/ENPEP/EGF/WARS1/ITGAX/EPHA2/CCN1/RHOB/MEIS1/SLIT2/PLK2/NOTCH1/HMGA2/ITGB1/VEGFC/IL18/HHEX/DDAH1/PRKCA/ADAMTS1/CXCL13/NODAL/MMP14/RUNX1/SHC1/EMC10/PLCD3/JAK1/RBM15/TGFBR2/PF4/AIMP1/NAA15/AGGF1/TLR3/TERT/SHH/NOS3/SYK/CYBB/ANPEP/STIM1/RBPJ/CX3CR1/EFNA1/PTK2/CXCL8/SEMA3E/S1PR1/SCG2/EIF2AK3/CCL11/BSG/EGFL7/DAG1/CSPG4/RNF213/LEP/JUN/CXCR2/SETD2/ADGRB1/EPHB3/ANXA2/COL18A1/FOXO4/CIB1/HGS/THBS2/CXCR3/PARVA/NRARP/FKBPL/TNF/HLA-G/TNF/HLA-G/TNF/TNF/TNF/TNF/TNF/HLA-G/TNF/HLA-G/HLA-G/HLA-G/HLA-G/PDCD6/YJEFN3/ITGB3/AKT3/HLA-G/TJP1/PTEN | 190 |
| GO:0097191 | extrinsic apoptotic signaling pathway | 100/3662 | 213/15509 | 5.86655e-14 | 2.42406e-12 | 1.45779e-12 | BAD/IGF1/SNAI2/HGF/FAS/TNFRSF1B/BAK1/TRAF1/ERBB3/SPI1/SP100/HYAL2/FGFR3/FGFR1/PTPRC/GSK3B/BAX/P2RX7/ICAM1/MKNK2/SRPX/GATA1/PYCARD/EYA1/SFRP1/IL7/TGFB1/GSK3A/CASP2/SERPINE1/TGFBR1/UNC5B/RPS6KB1/KRT18/IFNG/EYA4/IL4/IL1A/PARK7/FASLG/TNFAIP3/FOXO3/TNFRSF10B/TNFSF10/INHBA/IL1B/CD70/RBCK1/BCL2L2/PSME3/NGF/ITM2C/THBS1/BCL2L10/ITGAV/COL2A1/BCL2A1/PMAIP1/PIK3R1/TCF7L2/BAG3/BCL2L11/FAIM/IL6R/LMNA/PEA15/ATF3/PF4/ZDHHC3/TLR3/TERT/CSF2/GPER1/NOS3/PRDX2/FADD/BCL2L1/FGG/FGA/SCG2/RELA/PAK2/CIB1/DAPK1/SRC/TNF/DAXX/DAXX/TNF/TNF/DAXX/TNF/TNF/TNF/DAXX/TNF/DAXX/TNF/PTPRC/PTEN | 100 |
| GO:0002764 | immune response-regulating signaling pathway | 176/3662 | 449/15509 | 6.07597e-14 | 2.49396e-12 | 1.49983e-12 | CD38/CD79B/BTK/TYROBP/CD22/LTF/BIRC3/BTN3A1/FOXP3/CYBA/PUM2/MAP2K4/FCGR2B/PTPRC/WDFY1/LAT2/BAX/SPG21/ESR1/BAG6/ABL1/NFKBIA/CD40/NFATC2/HCK/RIOK3/TLR8/MEFV/PYCARD/CSK/KCNN4/LILRB1/PRKD2/CD79A/CD33/NOD1/GATA3/MAPK8/C1QBP/MAP2K6/LPXN/CD81/PDE4D/ZAP70/CD160/TNFAIP3/NR4A3/EIF2B2/RBCK1/CCR7/NR1D1/IRF3/NECTIN2/TRAF3/AP3B1/PTPN22/CD36/TLR4/IRF4/DDX60/SLC15A4/CMTM3/ARRB2/TNFRSF21/CD8A/MS4A1/KIT/APPL1/SPPL3/ICOSLG/NLRX1/CLPB/GFI1/MAPKAPK2/CTLA4/PRKCD/TLR3/SYK/MBL2/BTNL9/NOD2/TNIP2/INPP5D/PTK2/CD14/PRKCE/RELA/HRAS/PTPN2/CD19/CD28/HLA-DQB1/LACC1/PAK2/CACNB4/IRAK1/PDE4B/BTN3A2/LILRB4/PLSCR1/HMGB1/TLR7/CD47/SRC/CR1/BAG6/TNF/HLA-G/HLA-DQB1/HLA-DQB1/TNF/MICB/HLA-A/HLA-A/HLA-G/HLA-DPB1/NCR3/HLA-DPB1/TNF/HLA-A/HLA-A/MICB/NCR3/HLA-DQB1/HLA-DPB1/HLA-A/MICB/TNF/BAG6/TNF/TNF/HLA-A/HLA-DPB1/BAG6/TNF/HLA-G/HLA-DPB1/HLA-DPB1/MICB/HLA-DQB1/MICB/HLA-A/HLA-DQB1/TNF/HLA-G/HLA-DQB1/BAG6/BAG6/HLA-G/HLA-A/HLA-G/NCR3/HLA-DPB1/NCR3/NCR3/HLA-G/HLA-DPB1/NCR3/MICB/NAIP/LSM14A/PTPRC/IKBKG/CD24/LILRB1/LILRB4/HLA-G/NAIP/LILRB1/LILRB1/LILRB1/LILRB4/LILRB4/NAIP/INPP5D/ITCH | 176 |
| GO:0002712 | regulation of B cell mediated immunity | 50/3662 | 79/15509 | 6.22251e-14 | 2.52073e-12 | 1.51592e-12 | BTK/PARP3/FOXP3/FCGR2B/TBX21/MLH1/PTPRC/MSH2/CD40/FCER2/IL27RA/TGFB1/EXOSC3/NSD2/HPX/IL4/BCL6/SHLD2/C3/FOXJ1/NECTIN2/NDFIP1/IL10/SLC15A4/TNFSF13/NOD2/CD28/CD55/CR1/TNF/HLA-E/TNF/HLA-E/LTA/TNF/HLA-E/LTA/TNF/TNF/TNF/HLA-E/TNF/HLA-E/LTA/LTA/TNF/HLA-E/HLA-E/LTA/PTPRC | 50 |
| GO:0002889 | regulation of immunoglobulin mediated immune response | 50/3662 | 79/15509 | 6.22251e-14 | 2.52073e-12 | 1.51592e-12 | BTK/PARP3/FOXP3/FCGR2B/TBX21/MLH1/PTPRC/MSH2/CD40/FCER2/IL27RA/TGFB1/EXOSC3/NSD2/HPX/IL4/BCL6/SHLD2/C3/FOXJ1/NECTIN2/NDFIP1/IL10/SLC15A4/TNFSF13/NOD2/CD28/CD55/CR1/TNF/HLA-E/TNF/HLA-E/LTA/TNF/HLA-E/LTA/TNF/TNF/TNF/HLA-E/TNF/HLA-E/LTA/LTA/TNF/HLA-E/HLA-E/LTA/PTPRC | 50 |
| GO:0002476 | antigen processing and presentation of endogenous peptide antigen via MHC class Ib | 23/3662 | 24/15509 | 6.73783e-14 | 2.71176e-12 | 1.6308e-12 | TAP2/HLA-E/HLA-G/TAP2/TAP2/HLA-E/HLA-G/TAP2/HLA-E/TAP2/TAP2/HLA-E/HLA-E/HLA-G/TAP2/HLA-G/HLA-E/HLA-G/HLA-G/HLA-E/HLA-G/TAP2/HLA-G | 23 |
| GO:0033002 | muscle cell proliferation | 95/3662 | 199/15509 | 7.00766e-14 | 2.80216e-12 | 1.68517e-12 | NOX1/IGF1/HGF/CYBA/FGFR2/RHOA/NOTCH3/TP73/XRCC5/MMP2/ABL1/PDGFB/MMP9/NDRG4/TGFB1/TGFBR1/BMPR1A/RPS6KB1/IFNG/PPARD/MAPK14/HBEGF/IL12B/PDGFRB/KPNA1/STAT1/ID2/HDAC1/MFN2/TNFAIP3/NR4A3/GNA13/CDKN1A/BMP2/APOE/DNMT1/IL6/IL10/TLR4/CCN3/THBS1/FGF2/IGF1R/GNA12/IGFBP3/NOTCH1/TCF7L2/IL18/GJA1/ADAMTS1/SKI/LDLRAP1/RUNX1/IL6R/SELENON/TGFBR2/TERT/SHH/GPER1/NOS3/NDRG2/FRS2/RBPJ/PTAFR/ZFPM2/CDK1/FOS/S1PR1/DDIT3/JUN/CTNNBIP1/ERN1/ADIPOQ/RBM10/NKX2-5/NOG/IRAK1/ARID2/SRC/MAP3K5/ELANE/TNF/TNF/TNF/TNF/TNF/TNF/TNF/TNF/PRKDC/ITGB3/CCL5/CCL5/ELANE/PTEN | 95 |
| GO:0002637 | regulation of immunoglobulin production | 52/3662 | 84/15509 | 7.28511e-14 | 2.89443e-12 | 1.74066e-12 | BTK/CD22/PARP3/FOXP3/FCGR2B/TBX21/MLH1/IL4R/PTPRC/MSH2/XBP1/CD40/CD40LG/IL27RA/GPI/TGFB1/EXOSC3/NSD2/HPX/IL4/IL5/BCL6/CD86/SHLD2/PKN1/NDFIP1/EPHB2/IL6/IL10/IL21/SLC15A4/TMBIM6/TNFSF13/CD28/CR1/TNF/HLA-E/TNF/HLA-E/TNF/HLA-E/TNF/TNF/TNF/HLA-E/TNF/HLA-E/TNF/HLA-E/HLA-E/PTPRC/GPI | 52 |
| GO:0045670 | regulation of osteoclast differentiation | 49/3662 | 77/15509 | 8.13993e-14 | 3.21346e-12 | 1.93252e-12 | TYROBP/LTF/TFE3/RASSF2/SFRP1/LILRB1/IFNG/NEDD9/IL17A/IL12B/IL4/IAPP/LRRC17/PIAS3/NOTCH2/TLR4/TCTA/PIK3R1/POU4F2/POU4F1/KLF10/SLC9B2/TLR3/TNFRSF11B/INPP5D/FOS/CEBPB/ESRRA/GPR137/CSF1/LILRB4/MTOR/MAFB/TNF/TNF/TNF/TNF/TNF/TNF/TNF/TNF/LILRB1/LILRB4/LILRB1/LILRB1/LILRB1/LILRB4/LILRB4/INPP5D | 49 |
| GO:0010563 | negative regulation of phosphorus metabolic process | 154/3662 | 381/15509 | 1.24708e-13 | 4.89201e-12 | 2.94197e-12 | SLC4A1/SPAG9/MVP/HGF/BAK1/IPO5/ROCK1/HYAL2/SIRT2/SIRT6/FBLN1/PTPRC/GSK3B/PIBF1/TMED2/PPP1R15A/BAX/RTRAF/FKBP1A/ABL1/GADD45B/PIK3IP1/PDGFB/GSKIP/BMP7/RASSF2/PPP1R16B/SMAD7/PARD6A/TSC2/PYCARD/CSK/SFRP1/URI1/TGFB1/GSK3A/HSPB1/ENG/DVL1/DKK1/CHORDC1/CORO1C/SH2B3/IFNG/PDE4D/PPP2CA/MACROH2A1/KAT2B/PRKAR2A/PARK7/GADD45A/TNFAIP3/PTPA/MASTL/TARDBP/CRY2/INHBA/PKN1/LRP1/CDKN1A/IL1B/BMP2/ATG14/STYXL1/AJUBA/CDKN1C/CBFA2T3/APOE/CEP85/VPS25/EPHB2/MEN1/PTPN22/APC/MICAL1/NIBAN1/SPRY2/SORL1/SMAD6/TARBP2/RB1/WARS1/ARRB2/ENSA/DUSP10/PARP1/CALM2/CTDSP1/SLIT2/BOD1/IGFBP3/NCAPG2/C9orf72/PARD3/HHEX/CNKSR3/UCHL1/GNAQ/PPP1R15B/DMTN/CALM3/CAMK2N1/PRKCD/DUSP7/CASP3/DDIT4/PKIG/RGS14/CTDSP2/PTPN2/CHMP6/ANKLE2/JUN/PLEC/TAF7/PAK2/ADIPOQ/NPM1/SLC8A1/NOG/CIB1/INPP5J/SOCS1/PRKN/NF2/LILRB4/HEXIM1/SPRY4/PPIA/SPRED2/TNF/PPP1R11/AKT1S1/IPO7/TNF/FIS1/TNF/TNF/TNF/TNF/TNF/TNF/DBNDD2/CEBPA/PRKDC/PTPRC/CDKN1C/LILRB4/PIP4K2B/LILRB4/LILRB4/LRP6/PTEN/CHORDC1 | 154 |
| GO:0043491 | protein kinase B signaling | 92/3662 | 192/15509 | 1.3154e-13 | 5.12756e-12 | 3.08363e-12 | IGF1/F7/HYAL2/SIRT2/MKRN2/FGFR1/LRP2/NOX4/HSP90AB1/OSM/RASD2/CD40/TSC2/TGFB1/PIK3CG/MET/TGFBR1/ENG/GATA3/CSF3/RPS6KB1/C1QBP/CCL2/SH2B3/HBEGF/PPP2CA/PARK7/SFRP5/TEK/IAPP/IL1B/CCR7/RRAS/KDR/GDF15/SESN2/CHI3L1/SPRY2/CCL21/THBS1/FGF2/EGF/IGF1R/ARRB2/EPHA2/TPBG/EGFR/NTRK2/TCF7L2/SESN3/ITGB1/IL18/MERTK/THEM4/RICTOR/GPER1/CX3CR1/PTK2/OTUD3/CCL19/DAG1/LEP/DDIT3/CD28/CIB1/ZFP36L1/MAGI2/AKR1C3/SRC/NTRK1/MTOR/TNF/HLA-G/TNF/HLA-G/CPNE1/TNF/TNF/TNF/TNF/TNF/HLA-G/TNF/HLA-G/HLA-G/HLA-G/HLA-G/PDCD6/CCL5/CCL5/HLA-G/PTEN | 92 |
| GO:0002428 | antigen processing and presentation of peptide antigen via MHC class Ib | 24/3662 | 26/15509 | 1.65994e-13 | 6.43019e-12 | 3.86701e-12 | TAP2/HLA-E/HLA-G/TAP2/TAP2/HLA-E/HLA-G/TAP2/HLA-E/TAP2/TAP2/HLA-E/HLA-E/HLA-G/TAP2/HLA-G/HLA-E/HLA-G/HLA-G/HLA-E/HLA-G/TAP2/B2M/HLA-G | 24 |
| GO:0046631 | alpha-beta T cell activation | 90/3662 | 187/15509 | 1.75334e-13 | 6.74982e-12 | 4.05922e-12 | TMEM98/HFE/RUNX3/FOXP3/PRDM1/AP3D1/RHOA/CBFB/TBX21/IL4R/ARG2/PTPRC/IL12RB1/ABL1/SMAD7/ELF4/LILRB1/JAK3/TNFSF8/GATA3/ZBTB16/CD81/IFNG/IL12B/IL4/BCL6/CD86/ZAP70/CD160/MYB/CD80/BCL11B/TWSG1/NDFIP1/RARA/AP3B1/PTPN22/IL2RA/IL6/HLX/IRF4/IL21/ARMC5/IL2RG/IL18/RUNX1/IL6R/TGFBR2/SHH/SYK/LGALS9/CCL19/CD28/KLHL25/SOCS1/LILRB4/HMGB1/CD55/ENTPD7/MTOR/PNP/HLA-E/HLA-DRA/HLA-E/HLA-A/HLA-A/HLA-A/HLA-A/HLA-E/HLA-A/HLA-DRA/HLA-DRA/HLA-A/HLA-E/HLA-E/HLA-A/HLA-E/HLA-DRA/HLA-A/HLA-E/PTPRC/LILRB1/LILRB4/LILRB1/LILRB1/HLA-DRA/LILRB1/LILRB4/LILRB4/ITCH | 90 |
| GO:0048661 | positive regulation of smooth muscle cell proliferation | 53/3662 | 88/15509 | 2.09477e-13 | 8.01445e-12 | 4.81975e-12 | NOX1/IGF1/CYBA/FGFR2/NOTCH3/MMP2/PDGFB/MMP9/TGFB1/BMPR1A/RPS6KB1/HBEGF/PDGFRB/STAT1/ID2/HDAC1/MFN2/NR4A3/DNMT1/IL6/IL10/TLR4/THBS1/FGF2/IGF1R/IL18/GJA1/ADAMTS1/LDLRAP1/IL6R/TGFBR2/TERT/FRS2/PTAFR/S1PR1/JUN/ERN1/IRAK1/SRC/MAP3K5/ELANE/TNF/TNF/TNF/TNF/TNF/TNF/TNF/TNF/ITGB3/CCL5/CCL5/ELANE | 53 |
| GO:0045936 | negative regulation of phosphate metabolic process | 153/3662 | 380/15509 | 2.18462e-13 | 8.30691e-12 | 4.99563e-12 | SLC4A1/SPAG9/MVP/HGF/BAK1/IPO5/ROCK1/HYAL2/SIRT2/SIRT6/FBLN1/PTPRC/GSK3B/PIBF1/TMED2/PPP1R15A/BAX/RTRAF/FKBP1A/ABL1/GADD45B/PIK3IP1/PDGFB/GSKIP/BMP7/RASSF2/PPP1R16B/SMAD7/PARD6A/TSC2/PYCARD/CSK/SFRP1/URI1/TGFB1/HSPB1/ENG/DVL1/DKK1/CHORDC1/CORO1C/SH2B3/IFNG/PDE4D/PPP2CA/MACROH2A1/KAT2B/PRKAR2A/PARK7/GADD45A/TNFAIP3/PTPA/MASTL/TARDBP/CRY2/INHBA/PKN1/LRP1/CDKN1A/IL1B/BMP2/ATG14/STYXL1/AJUBA/CDKN1C/CBFA2T3/APOE/CEP85/VPS25/EPHB2/MEN1/PTPN22/APC/MICAL1/NIBAN1/SPRY2/SORL1/SMAD6/TARBP2/RB1/WARS1/ARRB2/ENSA/DUSP10/PARP1/CALM2/CTDSP1/SLIT2/BOD1/IGFBP3/NCAPG2/C9orf72/PARD3/HHEX/CNKSR3/UCHL1/GNAQ/PPP1R15B/DMTN/CALM3/CAMK2N1/PRKCD/DUSP7/CASP3/DDIT4/PKIG/RGS14/CTDSP2/PTPN2/CHMP6/ANKLE2/JUN/PLEC/TAF7/PAK2/ADIPOQ/NPM1/SLC8A1/NOG/CIB1/INPP5J/SOCS1/PRKN/NF2/LILRB4/HEXIM1/SPRY4/PPIA/SPRED2/TNF/PPP1R11/AKT1S1/IPO7/TNF/FIS1/TNF/TNF/TNF/TNF/TNF/TNF/DBNDD2/CEBPA/PRKDC/PTPRC/CDKN1C/LILRB4/PIP4K2B/LILRB4/LILRB4/LRP6/PTEN/CHORDC1 | 153 |
| GO:0014068 | positive regulation of phosphatidylinositol 3-kinase signaling | 50/3662 | 81/15509 | 2.58014e-13 | 9.75102e-12 | 5.86409e-12 | WNT16/DCN/IGF1/HGF/ERBB3/FGFR1/OSM/PDGFB/FLT1/UNC5B/CSF3/PPARD/PDGFRB/FN1/TEK/CAT/FLT3/BECN1/KDR/PDGFRA/FGF2/EGF/IGF1R/PDGFC/NTRK2/IL18/KIT/GPER1/PTK2/SEMA3E/SELP/LEP/CD28/F2/F2R/ROR1/PRR5/SRC/NTRK1/TNF/TNF/TNF/TNF/TNF/TNF/TNF/TNF/GH1/CCL5/CCL5 | 50 |
| GO:0046637 | regulation of alpha-beta T cell differentiation | 46/3662 | 72/15509 | 3.79861e-13 | 1.4269e-11 | 8.58111e-12 | RUNX3/FOXP3/PRDM1/AP3D1/RHOA/CBFB/TBX21/IL4R/IL12RB1/SMAD7/JAK3/GATA3/ZBTB16/IFNG/IL12B/IL4/BCL6/CD86/ZAP70/MYB/CD80/RARA/AP3B1/HLX/IRF4/IL2RG/IL18/RUNX1/TGFBR2/SHH/SYK/LGALS9/CCL19/KLHL25/SOCS1/LILRB4/HMGB1/PNP/HLA-DRA/HLA-DRA/HLA-DRA/HLA-DRA/LILRB4/HLA-DRA/LILRB4/LILRB4 | 46 |
| GO:0071356 | cellular response to tumor necrosis factor | 99/3662 | 216/15509 | 4.98598e-13 | 1.86163e-11 | 1.11955e-11 | BIRC3/FAS/TNFRSF1B/TNFRSF17/CYBA/TRAF1/HYAL2/UBE2K/APOB/TCL1A/PCK2/NFKBIA/CD40/BIRC7/CCL22/CCL17/PYCARD/SFRP1/ASAH1/HAMP/GSDME/GATA3/CCL2/CALCA/KRT18/MAPK14/HES1/CCL20/STAT1/TNFAIP3/FOXO3/PTK2B/H2BC11/CD70/NR1D1/ZFP36/ASS1/AKAP12/EDA2R/TRAF3/PIAS3/CHI3L1/ADAMTS7/TANK/CCL21/IL18BP/THBS1/CYP1B1/TNFRSF11A/TNFRSF21/COMMD7/ZFP36L2/TNFRSF13C/ADAMTS13/VCAM1/GPER1/SYK/GPD1/NKIRAS2/CXCL8/LIMS1/FOS/CCL11/CCL19/RELA/PTPN2/ADIPOQ/TRAIP/CIB1/PRKN/ZFP36L1/TRPV1/MAP3K5/NKIRAS1/TNF/TMSB4X/TNF/CHUK/CPNE1/TNF/TNF/TNF/TNF/TNF/TNF/CEBPA/NAIP/CCL5/CCL5/PRPF8/CCL4/CCL18/CCL4/NAIP/CCL4/CCL18/CCL18/NAIP/ADAMTS13 | 99 |
| GO:2001187 | positive regulation of CD8-positive, alpha-beta T cell activation | 23/3662 | 25/15509 | 6.52647e-13 | 2.42222e-11 | 1.45668e-11 | RUNX3/CBFB/PTPN22/RUNX1/LILRB4/HLA-E/HLA-E/HLA-A/HLA-A/HLA-A/HLA-A/HLA-E/HLA-A/HLA-A/HLA-E/HLA-E/HLA-A/HLA-E/HLA-A/HLA-E/LILRB4/LILRB4/LILRB4 | 23 |
| GO:0070997 | neuron death | 140/3662 | 343/15509 | 6.84905e-13 | 2.52681e-11 | 1.51958e-11 | BAD/TYROBP/FAS/TNFRSF1B/GRN/HSPA5/NGFR/HIPK2/ERBB3/MAP2K4/RHOA/ROCK1/INPP5A/VPS35/FCGR2B/TP63/PICALM/GSK3B/BAX/SLC23A2/KDM2B/AARS1/MSH2/HSP90AB1/ABL1/MYBL2/ADNP/CHMP4B/IL27RA/GPI/GSK3A/CASP2/AIMP2/GATA3/UNC5B/DKK1/CSF3/CCL2/ZPR1/CCND1/MDK/IFNG/WNT5A/PARK7/FASLG/NENF/FOXO3/NR4A3/GPR75/EGR1/CLU/PTK2B/CNTFR/TMTC4/MAX/ELK1/KDR/APOE/EPO/KRAS/NGF/SRPK2/IL10/STXBP1/TLR4/TFAP2A/SORL1/MAP3K12/TMBIM6/RB1/ST8SIA2/MEAK7/ARRB2/SOD1/APP/PARP1/ARL6IP5/TNFRSF21/NONO/NTRK2/THRB/POU4F1/BCL2L11/NR4A2/BTG2/ITGB2/TBC1D24/CAPN2/CASP3/TERT/FOXQ1/CDK5/NSMF/FADD/DDIT4/CX3CR1/ITGAM/FOS/SEMA3E/BCL2L1/CEBPB/LIG4/HRAS/DDIT3/BDNF/CDK5R1/JUN/NQO1/F2R/CSF1/PRKN/DCC/CLN3/FZD9/SYNGAP1/MAP3K5/NTRK1/GPRASP3/TNF/AKT1S1/DAXX/DAXX/TNF/TNF/DAXX/TNF/TNF/TNF/DAXX/TNF/DAXX/TNF/NAIP/IKBKG/CCL5/CCL5/NAIP/NEFL/NAIP/GPI | 140 |
| GO:0045638 | negative regulation of myeloid cell differentiation | 53/3662 | 90/15509 | 7.49441e-13 | 2.74854e-11 | 1.65293e-11 | PAF1/LTF/HMGB3/HOXA9/NFKBIA/SFRP1/LILRB1/HOXA5/ZBTB16/HSPA9/IL4/MYB/PTK2B/IAPP/INHBA/PRMT1/ZFP36/LRRC17/RARA/PIAS3/TLR4/CUL4A/SKIC8/MEIS1/TCTA/PIK3R1/GABPA/RBM15/PF4/TLR3/TNFRSF11B/INPP5D/GPR137/STAT5B/PTPN2/ADIPOQ/CIB1/ZFP36L1/LILRB4/MAFB/H4C15/H4C14/H4C12/LILRB1/LILRB4/LILRB1/H4C5/LILRB1/H4C4/LILRB1/LILRB4/LILRB4/INPP5D | 53 |
| GO:0051098 | regulation of binding | 142/3662 | 350/15509 | 8.10126e-13 | 2.95362e-11 | 1.77626e-11 | KDM1A/PON1/HFE/IGF1/HIPK2/BTBD1/SP100/ROCK1/SIRT2/CDC42/PRKACA/MARK2/ADD2/ACTB/RAP1GAP/GSK3B/ZMPSTE24/BAX/ADD1/FKBP1A/HSP90AB1/ABL1/TFIP11/CYP2D6/PDGFB/NFKBIA/MMP9/ADNP/GATA1/ERCC2/DOT1L/TLE5/MED25/TGFB1/MET/TGFBR1/EDF1/DVL1/GATA3/MAPK8/DKK1/CSF3/IFNG/PPP2CA/NPHP3/WNT5A/HES1/ITGA4/PARK7/STMN1/IFIT2/TEX14/LRP1/USP9X/CDKN1A/BMP2/ID1/PIN1/LIF/APOE/RARA/PER2/PRMT7/MEN1/NGF/IL10/NCBP1/DERL1/IRF4/SORL1/EGF/TDG/TMBIM6/RB1/ARRB2/EIF4A3/SMAD4/APP/CARM1/SNAPIN/PARP1/CALM2/C9orf72/TCF7L2/HMGA2/POU4F2/POU4F1/ZNF618/SPPL3/SKI/LDLRAP1/EPB41/CALM3/PEX19/DISC1/PYGO2/SPTA1/PRKCD/C4orf3/TERT/CDK5/NSD1/GOLGA2/NMD3/ADRB2/ATP2A2/CTBP2/DDIT3/SMAD2/BDNF/JUN/CTNNBIP1/AURKB/ADIPOQ/PHLDA2/RGMA/ANXA2/NOG/EIF3C/SUMO3/PRKN/RNF220/H1-0/HMGB1/SRC/CSNK2B/TMSB4X/CPNE1/EBF2/CSNK2B/CSNK2B/CSNK2B/CSNK2B/NME1/CCPG1/CYP2D6/B2M/CYP2D6/CYP2D6/CYP2D6/CYP2D6/PRKACA | 142 |
| GO:0038034 | signal transduction in absence of ligand | 43/3662 | 66/15509 | 8.21615e-13 | 2.96068e-11 | 1.7805e-11 | BAD/SNAI2/FAS/BAK1/ERBB3/FGFR1/GSK3B/BAX/MKNK2/SRPX/GATA1/EYA1/IL7/GSK3A/CASP2/UNC5B/EYA4/IL4/IL1A/FOXO3/INHBA/IL1B/BCL2L2/BCL2L10/ITGAV/COL2A1/BCL2A1/BAG3/BCL2L11/PF4/TERT/CSF2/PRDX2/FADD/BCL2L1/TNF/TNF/TNF/TNF/TNF/TNF/TNF/TNF | 43 |
| GO:0097192 | extrinsic apoptotic signaling pathway in absence of ligand | 43/3662 | 66/15509 | 8.21615e-13 | 2.96068e-11 | 1.7805e-11 | BAD/SNAI2/FAS/BAK1/ERBB3/FGFR1/GSK3B/BAX/MKNK2/SRPX/GATA1/EYA1/IL7/GSK3A/CASP2/UNC5B/EYA4/IL4/IL1A/FOXO3/INHBA/IL1B/BCL2L2/BCL2L10/ITGAV/COL2A1/BCL2A1/BAG3/BCL2L11/PF4/TERT/CSF2/PRDX2/FADD/BCL2L1/TNF/TNF/TNF/TNF/TNF/TNF/TNF/TNF | 43 |
| GO:0002714 | positive regulation of B cell mediated immunity | 39/3662 | 57/15509 | 8.97447e-13 | 3.19677e-11 | 1.92248e-11 | BTK/TBX21/MLH1/PTPRC/MSH2/CD40/FCER2/TGFB1/EXOSC3/NSD2/HPX/IL4/SHLD2/C3/NECTIN2/TNFSF13/NOD2/CD28/TNF/HLA-E/TNF/HLA-E/LTA/TNF/HLA-E/LTA/TNF/TNF/TNF/HLA-E/TNF/HLA-E/LTA/LTA/TNF/HLA-E/HLA-E/LTA/PTPRC | 39 |
| GO:0002891 | positive regulation of immunoglobulin mediated immune response | 39/3662 | 57/15509 | 8.97447e-13 | 3.19677e-11 | 1.92248e-11 | BTK/TBX21/MLH1/PTPRC/MSH2/CD40/FCER2/TGFB1/EXOSC3/NSD2/HPX/IL4/SHLD2/C3/NECTIN2/TNFSF13/NOD2/CD28/TNF/HLA-E/TNF/HLA-E/LTA/TNF/HLA-E/LTA/TNF/TNF/TNF/HLA-E/TNF/HLA-E/LTA/LTA/TNF/HLA-E/HLA-E/LTA/PTPRC | 39 |
| GO:0002504 | antigen processing and presentation of peptide or polysaccharide antigen via MHC class II | 42/3662 | 64/15509 | 1.05129e-12 | 3.72336e-11 | 2.23917e-11 | CD74/FCGR2B/PYCARD/ARL8B/THBS1/HLA-DQB1/HLA-DQA1/HLA-DOA/HLA-DQB1/HLA-DQA1/HLA-DQB1/HLA-DQA1/HLA-DRA/HLA-DPB1/HLA-DQA1/HLA-DPB1/HLA-DQA1/HLA-DQB1/HLA-DQA1/HLA-DPB1/HLA-DRA/HLA-DQA1/HLA-DRA/HLA-DPB1/HLA-DPB1/HLA-DPB1/HLA-DRB4/HLA-DQB1/HLA-DPA1/HLA-DQA1/HLA-DQB1/HLA-DQA1/HLA-DQA1/HLA-DQB1/HLA-DRA/HLA-DQA1/HLA-DPB1/HLA-DQA1/HLA-DPB1/HLA-DQA1/B2M/HLA-DRA | 42 |
| GO:1901342 | regulation of vasculature development | 120/3662 | 282/15509 | 1.09043e-12 | 3.84006e-11 | 2.30934e-11 | E2F2/DCN/HGF/RNH1/GRN/SARS1/ATP2B4/EPN1/HIPK2/TIE1/SP100/PKM/ROCK1/SIRT6/APOH/ANGPT2/AGO1/ABL1/XBP1/CD40/PPP1R16B/FLT1/TJP1/SFRP1/PRKD2/HOXA5/HSPB1/SERPINE1/ENG/MDK/SMOC2/WNT5A/IL1A/STAT1/PDCL3/GADD45A/WARS2/CD160/FASLG/TNFAIP3/PGF/TEK/PTK2B/CXCR4/RECK/IL1B/C3/ID1/RRAS/KDR/CHI3L1/BTG1/CEMIP2/GLUL/SPRY2/IL6/CCM2/IL10/THBS1/CYP1B1/FGF2/WARS1/ITGAX/EPHA2/RHOB/PLK2/HMGA2/ITGB1/VEGFC/HHEX/DDAH1/PRKCA/ADAMTS1/CXCL13/NODAL/RUNX1/EMC10/JAK1/WNT4/TGFBR2/PF4/AGGF1/TLR3/TERT/NOS3/CYBB/STIM1/CX3CR1/EFNA1/CXCL8/SEMA3E/CCL11/LEP/CXCR2/ADGRB1/FOXO4/HGS/THBS2/FKBPL/TNF/HLA-G/TNF/HLA-G/TNF/TNF/TNF/TNF/TNF/HLA-G/TNF/HLA-G/HLA-G/HLA-G/HLA-G/PDCD6/YJEFN3/ITGB3/AKT3/HLA-G/TJP1 | 120 |
| GO:2001234 | negative regulation of apoptotic signaling pathway | 95/3662 | 207/15509 | 1.3361e-12 | 4.6786e-11 | 2.81363e-11 | KDM1A/MAPK8IP2/IGF1/SNAI2/CD74/HGF/CD44/BAK1/HERPUD1/TMEM161A/CSNK2A2/GSK3B/BAX/ICAM1/TMEM14A/XBP1/MMP9/GATA1/EYA1/IL7/URI1/HSPB1/SERPINE1/TGFBR1/CREB3/CXCL12/UNC5B/PPIF/RPS6KB1/EYA4/IL4/IL1A/PARK7/HDAC1/TNFAIP3/HELLS/CLU/IL1B/TRAP1/BCL2L2/EPO/PSME3/THBS1/BCL2L10/ITGAV/COL2A1/TMBIM6/RB1/ARRB2/NONO/TCF7L2/NR4A2/FAIM/LMNA/ZNF385A/WNT4/PEA15/PF4/TERT/CSF2/NOS3/FXN/PRDX2/CX3CR1/PRELID1/TRIAP1/BCL2L1/FGG/FGA/SCG2/RELA/BDNF/GRINA/PTTG1IP/NOG/PRKN/MUC1/ASAH2/FZD9/NOC2L/PPIA/SRC/TNF/TNF/NDUFS3/MAGEA3/TNF/TNF/TNF/TNF/TNF/TNF/AATF/MIF/PCGF2 | 95 |
| GO:0050866 | negative regulation of cell activation | 98/3662 | 216/15509 | 1.39098e-12 | 4.84341e-11 | 2.91274e-11 | CD9/BTK/HFE/TYROBP/CD74/RUNX3/HMGB3/GRN/PARP3/FOXP3/SPI1/CBFB/FCGR2B/TBX21/IL4R/ARG2/PTPRC/PIBF1/PDGFB/CTSG/SMAD7/SFRP1/LILRB1/JAK3/MDK/SH2B3/IL4/BCL6/CD86/ID2/TNFAIP3/ARG1/CD80/INHBA/PKN1/NR1D1/TWSG1/FOXJ1/APOE/NDFIP1/SYT11/SFTPD/PTPN22/IL2RA/PDGFRA/SERPINE2/HLX/IL10/ADAMTS18/TNFRSF21/MERTK/RUNX1/CTLA4/PRKCD/CASP3/SHH/GPER1/NOS3/PRDX2/INPP5D/LGALS9/FGG/CEBPB/GLMN/RAG2/PTPN2/F2/MICA/SOCS1/LILRB4/CNR2/HMGB1/PDCD1LG2/NRARP/CR1/HLA-G/HLA-G/HLA-G/MICA/MICA/HLA-G/MICA/HLA-G/HLA-G/HLA-G/TNFRSF13B/PTPRC/LILRB1/LILRB4/HLA-G/LILRB1/LILRB1/LILRB1/LILRB4/LILRB4/INPP5D/PTEN/ITCH | 98 |
| GO:0010035 | response to inorganic substance | 187/3662 | 500/15509 | 1.58627e-12 | 5.49257e-11 | 3.30314e-11 | BAD/MPO/PON1/HFE/PPP5C/HGF/CPS1/GLRX2/BAK1/CASR/CDH1/HSPA5/RAD51/ATP2B4/RASGRP2/APOB/ATRX/SLC25A24/MMP2/ADD1/P2RX7/ABL1/APEX1/MMP9/ADNP/BMP7/GPI/HAMP/GSK3A/MET/TFR2/EZH2/MAPK8/PPIF/AREG/CRYAB/CCND1/SLC11A2/CUTA/PPP2CA/PDGFRB/WNT5A/IL1A/SLC30A3/STAT1/IGFBP2/SDC1/PARK7/MTR/PRDX1/TNNT2/TNFAIP3/ARG1/FOXO3/PKD2/NR4A3/DNMT3A/PTK2B/CAT/RUNX2/SLC25A23/FOSB/CCR7/BECN1/TRAP1/KDR/CYP2E1/ASS1/PRKAA1/SYT11/LOXL2/CD36/NT5E/HNRNPA1/EDNRB/IL6/IL10/TFAP2A/IL18BP/THBS1/KHK/CYP1B1/CARF/CYP1A1/CYP1A2/IMPA2/EIF4A3/SOD1/APP/ADCY10/KCNH1/PKLR/PARP1/SYT2/RHOB/CALM2/CCNA2/EGFR/ALAD/FOXO1/BMP6/KIT/FANCC/PPP1R15B/DMTN/GART/CALM3/ADAMTS13/ALOX15/VCAM1/CAPN2/INHBB/FABP1/BAP1/PRKCD/CASP3/TERT/CSF2/SHH/ADCY1/TNFRSF11B/NOS3/FXN/TRPV6/CYBB/AQP3/VCP/CHP2/STIM1/PRDX2/ADAM9/AHCYL1/ARL13B/CDK1/FOS/CD14/NPTX1/FGG/FGA/GPHN/EIF2AK3/BSG/CCL19/RELA/LIG4/FOSL1/JUN/KCNJ10/PLEC/ERN1/CALR/NQO1/PLCB1/SLC8A1/PRKN/PLSCR1/AKR1C3/CACNA1H/SRC/DDI2/MAP3K5/MBP/NTRK1/ND6/ZNF277/GDI1/DAXX/DAXX/ZNF580/CHUK/SIPA1/CPNE1/DAXX/DAXX/DAXX/HBB/CEBPA/PDCD6/HP/PKLR/TXNIP/B2M/TRPV6/PCGF2/NEFL/ADAMTS13/GPI | 187 |
| GO:0002861 | regulation of inflammatory response to antigenic stimulus | 40/3662 | 60/15509 | 1.68819e-12 | 5.813e-11 | 3.49584e-11 | BTK/KARS1/FCGR2B/MKRN2/HCK/CD81/MAPK14/IL12B/PARK7/C3/CCR7/IL10/FURIN/PLK2/PSMB4/SYK/NOD2/CD28/ZP3/SRC/TNF/HLA-E/TNF/HLA-E/LTA/TNF/HLA-E/LTA/TNF/TNF/TNF/HLA-E/TNF/HLA-E/LTA/LTA/TNF/HLA-E/HLA-E/LTA | 40 |
| GO:0045765 | regulation of angiogenesis | 118/3662 | 278/15509 | 2.06422e-12 | 7.06854e-11 | 4.2509e-11 | E2F2/DCN/HGF/RNH1/GRN/SARS1/ATP2B4/EPN1/HIPK2/TIE1/SP100/PKM/ROCK1/SIRT6/APOH/ANGPT2/AGO1/ABL1/XBP1/CD40/PPP1R16B/FLT1/TJP1/SFRP1/PRKD2/HOXA5/HSPB1/SERPINE1/ENG/MDK/SMOC2/WNT5A/IL1A/STAT1/PDCL3/GADD45A/WARS2/CD160/FASLG/TNFAIP3/PGF/TEK/PTK2B/CXCR4/RECK/IL1B/C3/RRAS/KDR/CHI3L1/BTG1/CEMIP2/GLUL/SPRY2/IL6/CCM2/IL10/THBS1/CYP1B1/FGF2/WARS1/ITGAX/EPHA2/RHOB/PLK2/HMGA2/ITGB1/VEGFC/HHEX/DDAH1/PRKCA/ADAMTS1/CXCL13/NODAL/RUNX1/EMC10/JAK1/TGFBR2/PF4/AGGF1/TLR3/TERT/NOS3/CYBB/STIM1/CX3CR1/EFNA1/CXCL8/SEMA3E/CCL11/LEP/CXCR2/ADGRB1/FOXO4/HGS/THBS2/FKBPL/TNF/HLA-G/TNF/HLA-G/TNF/TNF/TNF/TNF/TNF/HLA-G/TNF/HLA-G/HLA-G/HLA-G/HLA-G/PDCD6/YJEFN3/ITGB3/AKT3/HLA-G/TJP1 | 118 |
| GO:0009615 | response to virus | 146/3662 | 367/15509 | 2.33066e-12 | 7.93703e-11 | 4.77319e-11 | MAP3K14/BIRC3/POU2F2/FOXP3/EIF2AK2/PUM2/HYAL2/TBX21/DDX1/MID2/PTPRC/OPRK1/ZMPSTE24/APOB/ATG16L1/BAX/MAVS/IL12RB1/MARCHF2/CD40/RIOK3/TLR8/CCL22/PYCARD/LILRB1/URI1/GSDME/HSPB1/AP1S1/GATA3/CXCL12/ACTA2/C1QBP/POU2AF1/IFNG/AICDA/MAPK14/IL12B/IL4/STAT1/ODC1/STMN1/TNFAIP3/VAMP8/IFIT2/GPAM/CLU/TRIM25/CXCR4/IL1B/IRF3/BECN1/IRF5/TRAF3/TRIM5/TRIM22/POLR3F/SERINC3/PTPN22/RPS15A/IL6/TANK/NCBP1/DDX60/PPM1B/SENP7/HERC5/IL21/TARBP2/CYP1A1/ITGAX/ARMC5/PMAIP1/LYST/HMGA2/NLRX1/POLR3K/CLPB/JAK1/TLR3/MBL2/HTRA1/TRIM44/FADD/DDIT4/IRF2/POLR3D/LGALS9/TRIM56/TRIM8/BCL2L1/CCL11/CCL19/CFL1/RELA/PDE12/BANF1/FOSL1/CALR/PRF1/DDX60L/SETD2/MICA/IFITM1/CARD9/PLSCR1/TLR7/PCBP2/SRC/ATG7/ATAD3A/IFNA1/TNF/TRIM13/TNF/MICB/CHUK/TNF/MICB/MICB/TNF/TNF/TNF/TNF/MICB/MICA/MICB/TNF/MICA/TRIM26/MICA/MICB/IL10RB/LSM14A/PTPRC/IKBKG/CCL5/CCL5/LILRB1/CCL4/CCL4/LILRB1/LILRB1/LILRB1/CCL4/ITCH | 146 |
| GO:1901214 | regulation of neuron death | 127/3662 | 307/15509 | 2.66044e-12 | 9.01059e-11 | 5.41881e-11 | BAD/TYROBP/TNFRSF1B/GRN/HIPK2/ERBB3/MAP2K4/RHOA/ROCK1/INPP5A/VPS35/FCGR2B/PICALM/GSK3B/BAX/SLC23A2/KDM2B/AARS1/MSH2/HSP90AB1/ABL1/MYBL2/ADNP/CHMP4B/IL27RA/GPI/GSK3A/CASP2/AIMP2/GATA3/UNC5B/DKK1/CSF3/CCL2/ZPR1/CCND1/MDK/IFNG/WNT5A/PARK7/FASLG/NENF/FOXO3/NR4A3/GPR75/EGR1/CLU/PTK2B/CNTFR/ELK1/KDR/APOE/EPO/KRAS/NGF/SRPK2/IL10/STXBP1/TLR4/TFAP2A/SORL1/MAP3K12/ST8SIA2/MEAK7/ARRB2/SOD1/PARP1/NONO/NTRK2/POU4F1/BCL2L11/NR4A2/BTG2/ITGB2/TBC1D24/CAPN2/CASP3/TERT/FOXQ1/CDK5/NSMF/DDIT4/CX3CR1/ITGAM/FOS/SEMA3E/BCL2L1/CEBPB/LIG4/HRAS/DDIT3/BDNF/CDK5R1/JUN/NQO1/F2R/CSF1/PRKN/DCC/CLN3/FZD9/SYNGAP1/MAP3K5/NTRK1/GPRASP3/TNF/AKT1S1/DAXX/DAXX/TNF/TNF/DAXX/TNF/TNF/TNF/DAXX/TNF/DAXX/TNF/NAIP/IKBKG/CCL5/CCL5/NAIP/NEFL/NAIP/GPI | 127 |
| GO:0002768 | immune response-regulating cell surface receptor signaling pathway | 125/3662 | 301/15509 | 2.87569e-12 | 9.68669e-11 | 5.8254e-11 | CD38/CD79B/BTK/TYROBP/CD22/BTN3A1/FOXP3/MAP2K4/FCGR2B/PTPRC/LAT2/BAX/SPG21/BAG6/ABL1/CD40/NFATC2/HCK/CSK/KCNN4/LILRB1/PRKD2/CD79A/GATA3/MAPK8/LPXN/CD81/PDE4D/ZAP70/CD160/NR4A3/EIF2B2/RBCK1/CCR7/NECTIN2/PTPN22/CMTM3/TNFRSF21/CD8A/MS4A1/KIT/APPL1/SPPL3/ICOSLG/CTLA4/PRKCD/SYK/MBL2/BTNL9/INPP5D/PTK2/PRKCE/RELA/HRAS/PTPN2/CD19/CD28/HLA-DQB1/PAK2/CACNB4/PDE4B/BTN3A2/LILRB4/PLSCR1/CD47/SRC/CR1/BAG6/HLA-G/HLA-DQB1/HLA-DQB1/MICB/HLA-A/HLA-A/HLA-G/HLA-DPB1/NCR3/HLA-DPB1/HLA-A/HLA-A/MICB/NCR3/HLA-DQB1/HLA-DPB1/HLA-A/MICB/BAG6/HLA-A/HLA-DPB1/BAG6/HLA-G/HLA-DPB1/HLA-DPB1/MICB/HLA-DQB1/MICB/HLA-A/HLA-DQB1/HLA-G/HLA-DQB1/BAG6/BAG6/HLA-G/HLA-A/HLA-G/NCR3/HLA-DPB1/NCR3/NCR3/HLA-G/HLA-DPB1/NCR3/MICB/PTPRC/IKBKG/CD24/LILRB1/LILRB4/HLA-G/LILRB1/LILRB1/LILRB1/LILRB4/LILRB4/INPP5D | 125 |
| GO:2001185 | regulation of CD8-positive, alpha-beta T cell activation | 30/3662 | 39/15509 | 2.98603e-12 | 1.0004e-10 | 6.01623e-11 | HFE/RUNX3/CBFB/LILRB1/PTPN22/RUNX1/SOCS1/LILRB4/HLA-E/HLA-E/HLA-A/HLA-A/HLA-A/HLA-A/HLA-E/HLA-A/HLA-A/HLA-E/HLA-E/HLA-A/HLA-E/HLA-A/HLA-E/LILRB1/LILRB4/LILRB1/LILRB1/LILRB1/LILRB4/LILRB4 | 30 |
| GO:0051896 | regulation of protein kinase B signaling | 79/3662 | 163/15509 | 3.32409e-12 | 1.10767e-10 | 6.66135e-11 | IGF1/F7/HYAL2/FGFR1/LRP2/NOX4/HSP90AB1/OSM/RASD2/TSC2/TGFB1/PIK3CG/MET/TGFBR1/ENG/GATA3/CSF3/C1QBP/SH2B3/HBEGF/PPP2CA/PARK7/SFRP5/TEK/IAPP/CCR7/RRAS/GDF15/CHI3L1/SPRY2/CCL21/THBS1/FGF2/EGF/IGF1R/ARRB2/EPHA2/TPBG/EGFR/NTRK2/TCF7L2/SESN3/ITGB1/IL18/RICTOR/GPER1/CX3CR1/PTK2/OTUD3/CCL19/DAG1/LEP/DDIT3/CD28/CIB1/MAGI2/AKR1C3/SRC/NTRK1/MTOR/TNF/HLA-G/TNF/HLA-G/CPNE1/TNF/TNF/TNF/TNF/TNF/HLA-G/TNF/HLA-G/HLA-G/HLA-G/HLA-G/PDCD6/HLA-G/PTEN | 79 |
| GO:0071900 | regulation of protein serine/threonine kinase activity | 143/3662 | 359/15509 | 3.50719e-12 | 1.16244e-10 | 6.99069e-11 | DBF4/LTF/ATP2B4/IPO5/RHOA/HYAL2/ACTB/FGFR1/PTPRC/NOX4/P2RX7/CCNK/CDC6/HSP90AB1/ABL1/PDGFB/CDKN3/TCL1A/CD40/BMP7/CD40LG/FLT1/AXIN1/PYCARD/CSK/SFRP1/CCNE1/TGFB1/PIK3CG/EZH2/BMPR1A/BCCIP/DKK1/MAP2K6/CCND1/CHORDC1/GTF2H1/SH2B3/FZD10/IFNG/CCND3/CCNG1/PPP2CA/MACROH2A1/PDGFRB/KAT2B/WNT5A/PRKAR2A/CNPPD1/GADD45A/TNFAIP3/PKD2/CCNI/PTK2B/FLT3/CDKN1A/IL1B/BMP2/PKMYT1/AJUBA/CDKN1C/APOE/SESN2/CCNA1/MEN1/CCNB1/PSRC1/PTPN22/CCNH/APC/SPRY2/TLR4/SORL1/THBS1/HERC5/FGF2/EGF/MAP3K12/RB1/TNFRSF11A/DUSP10/CALM2/CCNA2/PDGFC/EGFR/HMGA2/HHEX/UCHL1/KIT/CALM3/DVL3/DBF4B/CCNL1/PRKCD/DUSP7/CASP3/RICTOR/SYK/NOD2/CDK12/ADAM9/PKIG/RGS14/ADRB2/CCL19/CKS1B/MST1/HRAS/FZD4/CCNE2/CDK5R1/ERN1/ADIPOQ/CSF1R/SLC8A1/IRAK1/CIB1/HGS/HEXIM1/SPRY4/SRC/MAP3K5/ELANE/TNF/IPO7/TNF/TNF/TNF/TNF/TNF/TNF/TNF/CEBPA/GH1/PTPRC/CD24/CDKN1C/LOC102724560/MIF/ELANE/LRP6/PTEN/CHORDC1 | 143 |
| GO:0048545 | response to steroid hormone | 131/3662 | 321/15509 | 3.83159e-12 | 1.2632e-10 | 7.59668e-11 | BAD/CD38/KDM1A/CRY1/RNF14/UFL1/CPS1/CYBA/PTPRU/PLPP1/RHOA/TP63/PIAS2/PGR/ESR1/RBFOX2/PCK2/BMP7/RBBP7/SFRP1/PLAT/URI1/GPI/TGFB1/GSK3A/ENG/ZMIZ1/RPS6KB1/DDX5/AREG/HSPA8/CCND1/MDK/PPARD/IGFBP2/KDM3A/SDC1/PARK7/HDAC1/PADI2/ARID1A/ARG1/FOXO3/SPP1/KLF9/NR4A3/CRY2/FLT3/PKN1/CNOT1/FOSB/NKX2-2/NR1D1/ZFP36/YWHAH/CDO1/EPO/ASS1/WBP2/IL6/IL10/IL1RN/THBS1/CYP1B1/IGF1R/CARM1/PARP1/CNOT9/SLIT2/ALAD/NOTCH1/POU4F2/ZFP36L2/BCL2L11/BMP6/NODAL/STC1/CALM3/PRMT2/SCNN1D/ATP1A1/TGFBR2/HEYL/CASP3/GPER1/CYBB/TRIM68/ABCA3/DDIT4/ADAM9/PTAFR/FOS/PAQR8/TADA3/CYP7B1/ESRRA/FOSL1/A2M/TYMS/TAF7/CALR/SSTR2/OXTR/ADIPOQ/PAPPA/SLIT3/ZFP36L1/UBE2L3/WNT7B/AKR1C3/SRC/KANK2/MBP/RXRB/TNF/DAXX/DAXX/TNF/TNF/DAXX/TNF/TNF/TNF/DAXX/TNF/DAXX/TNF/TXNIP/NEFL/PAGR1/GPI | 131 |
| GO:1903829 | positive regulation of protein localization | 161/3662 | 418/15509 | 3.90917e-12 | 1.28196e-10 | 7.70947e-11 | BAD/CD38/ITGA3/TYROBP/IGF1/CENPQ/CASR/CDH1/EPHA3/NNAT/ATP2B4/NGFR/IPO5/HYAL2/VPS35/CSNK2A2/PRKACA/SIRT6/PCM1/NDC80/GSK3B/OXCT1/ACHE/DNM1L/MAVS/P2RX7/HSP90AB1/SH3GLB1/GZMB/PCK2/PARD6A/KCNN4/PDCD5/TGFB1/CD33/GSK3A/DVL1/MAPK8/PPP3CB/RANGRF/ZPR1/CD81/PSMD9/IFNG/NEDD9/PPARD/MAPK14/TMEM30A/APBB3/WNT5A/IL1A/PARK7/SERP1/TARDBP/LRP1/RAB38/ACSL3/SOX4/IL1B/ERGIC3/TMEM35A/MGAT3/RAC2/LIF/SESN2/DKC1/PRKAA1/SYT11/XPO4/EPHB2/LRP4/APC/CCT7/GLUL/NMT1/TLR4/ANP32B/NUMA1/SORL1/RDX/EGF/CLSTN3/MEAK7/CEP131/SAE1/EPHA2/PARP1/STAC/PIK3R1/EGFR/MSN/GLUD1/TCF7L2/ITGB1/VEGFC/BICD1/BAG3/BMP6/RER1/EPB41/ITGB2/PCNT/BAP1/PRKCD/TERT/SHH/GPER1/CDK5/CCT2/RIC3/CHP2/ADAM9/MFF/NMD3/ITGAM/CDK1/KIF5B/PRKCE/TRIM8/FGG/FGA/ORMDL3/EIF2AK3/LEP/LARP7/HRAS/CEP135/PDZK1/ATG13/CDK5R1/MIEF2/F2/NPM1/CACNB4/PTP4A3/CIB1/PRKN/STAC3/UBE2L3/CLN3/PPIA/SRC/UBL5/SLC5A3/HSPA1L/TNF/HSPA1L/TNF/FIS1/TNF/HSPA1L/TNF/TNF/TNF/TNF/TNF/HSPA1L/HSPA1L/PECAM1/SQSTM1/PRKACA | 161 |
| GO:0001933 | negative regulation of protein phosphorylation | 120/3662 | 287/15509 | 4.55577e-12 | 1.48614e-10 | 8.93738e-11 | SPAG9/MVP/HGF/BAK1/IPO5/HYAL2/SIRT2/FBLN1/PTPRC/PIBF1/TMED2/BAX/RTRAF/ABL1/GADD45B/GSKIP/BMP7/RASSF2/SMAD7/PARD6A/TSC2/PYCARD/SFRP1/TGFB1/HSPB1/ENG/DVL1/DKK1/CHORDC1/CORO1C/SH2B3/IFNG/PDE4D/PPP2CA/MACROH2A1/KAT2B/PRKAR2A/PARK7/GADD45A/TNFAIP3/TARDBP/PKN1/LRP1/CDKN1A/IL1B/BMP2/ATG14/CDKN1C/APOE/CEP85/VPS25/EPHB2/MEN1/PTPN22/APC/MICAL1/NIBAN1/SPRY2/SORL1/SMAD6/TARBP2/RB1/WARS1/ARRB2/DUSP10/CALM2/CTDSP1/SLIT2/IGFBP3/NCAPG2/C9orf72/PARD3/HHEX/CNKSR3/UCHL1/GNAQ/PPP1R15B/DMTN/CALM3/CAMK2N1/PRKCD/DUSP7/CASP3/DDIT4/PKIG/RGS14/CTDSP2/PTPN2/CHMP6/JUN/PLEC/TAF7/PAK2/ADIPOQ/NPM1/SLC8A1/NOG/CIB1/INPP5J/SOCS1/PRKN/NF2/LILRB4/HEXIM1/SPRY4/PPIA/SPRED2/AKT1S1/IPO7/DBNDD2/CEBPA/PRKDC/PTPRC/CDKN1C/LILRB4/LILRB4/LILRB4/LRP6/PTEN/CHORDC1 | 120 |
| GO:0097193 | intrinsic apoptotic signaling pathway | 118/3662 | 281/15509 | 4.87698e-12 | 1.58259e-10 | 9.51744e-11 | BAD/KDM1A/NOX1/E2F2/SNAI2/CD74/CD44/TNFRSF1B/BAK1/USP28/HERPUD1/FNIP2/HIPK2/TMEM161A/TP63/MLH1/TP73/PPP1R15A/BAX/DNM1L/MSH2/BAG6/ABL1/XBP1/GSKIP/MMP9/PYCARD/NBN/URI1/GSDME/CASP2/HSPB1/CREB3/CXCL12/PPIF/SEPTIN4/DDX5/PTPMT1/PERP/PARK7/HDAC1/HELLS/CLU/TNFRSF10B/CDKN1A/PLAGL2/BECN1/TRAP1/DYRK2/STYXL1/CHAC1/BCL2L2/EPO/EDA2R/MYBBP1A/SERINC3/BCL2L10/CYP1B1/BRCA2/TMBIM6/CUL4A/BCL2A1/PMAIP1/SOD1/EPHA2/TP53BP2/PARP1/ARL6IP5/PIK3R1/NONO/ITPR1/POU4F2/POU4F1/BCL2L11/ZNF385A/RPL26/PRKCD/SHISA5/CASP3/DDIT4/HINT1/TRIAP1/BCL2L1/EIF2AK3/CEBPB/BRSK2/HRAS/DDIT3/PTPN2/ERN1/GRINA/PTTG1IP/CHEK2/PRKN/MUC1/NOC2L/PPIA/SRC/MAP3K5/BAG6/TNF/TNF/NDUFS3/FIS1/MAGEA3/TNF/TNF/BAG6/TNF/TNF/BAG6/TNF/TNF/BAG6/BAG6/PRKDC/CD24/MIF | 118 |
| GO:0030335 | positive regulation of cell migration | 183/3662 | 493/15509 | 5.90405e-12 | 1.9059e-10 | 1.14618e-10 | ITGA3/SPAG9/IGF1/SNAI2/CD74/HGF/GRN/FLT4/HSPA5/SYNE2/F7/CCAR1/MYLK/SPI1/RHOA/MCAM/FGFR1/PTPRC/CEACAM6/MMP2/DNM1L/ICAM1/ZNF268/ABL1/XBP1/PDGFB/MMP9/CD40/BMP7/FERMT1/FLT1/PYCARD/RAB11A/TJP1/SYDE1/GPI/PRKD2/TGFB1/PIK3CG/PTN/MET/HSPB1/SERPINE1/TGFBR1/CREB3/GATA3/CXCL12/ACTA2/RPS6KB1/C1QBP/MDK/WNT5B/IFNG/NEDD9/FBXO5/PTP4A1/SMOC2/HBEGF/IL4/PDGFRB/WNT5A/IL1A/CCL20/ITGA4/FN1/NRP2/NR4A3/PGF/TEK/PTK2B/CXCR4/IL1B/BMP2/CCR7/RRAS/STAT5A/KDR/RAC2/PODXL/AKAP12/EPHB2/PDGFRA/APC/SPRY2/IL6/TLR4/CCL21/ARHGEF39/MMP7/RDX/THBS1/CYP1B1/ITGAV/FGF2/EGF/IGF1R/ITGAX/GRB7/APP/EPHA2/CCN1/ABL2/RHOB/PDGFC/PLK2/PIK3R1/EGFR/NOTCH1/ITGB1/VEGFC/PRKCA/ADAMTS1/CXCL13/MMP14/KIT/DMTN/IL6R/EMC10/TBC1D24/S100A11/TGFBR2/TERT/CSF2/GPER1/NOS3/NSMF/MAPRE2/FADD/CX3CR1/ADAM9/SEMA4C/LGALS9/PTK2/PTAFR/CXCL8/ELP5/SEMA3E/S1PR1/PRKCE/CCL11/CCL19/SELP/HRAS/FZD4/JUN/CALR/CXCR2/FAM83H/F2R/CSF1R/SLC8A1/ZNF703/CSF1/FOXO4/CIB1/ZP3/HMGB1/FUT4/CD47/SRC/MTOR/TNF/TMSB4X/TNF/ZNF580/TNF/TNF/TNF/TNF/TNF/TNF/PDCD6/ITGB3/PECAM1/PTPRC/CCL5/CCL5/AKT3/CCL4/CCL4/TJP1/CCL4/GPI | 183 |
| GO:0045860 | positive regulation of protein kinase activity | 152/3662 | 391/15509 | 6.87141e-12 | 2.20669e-10 | 1.32706e-10 | DBF4/CD4/LTF/IGF1/SLC11A1/ATP2B4/ERBB3/RHOA/MARK2/TRAF4/FGFR1/XRCC5/PTPRC/DLG3/PIBF1/NOX4/TPX2/P2RX7/CCNK/CDC6/HSP90AB1/ABL1/PDGFB/TCL1A/CD40/ADNP/CDC25B/RASSF2/CD40LG/FLT1/AXIN1/CSK/TGFB1/PIK3CG/EZH2/BMPR1A/DKK1/MAP2K6/UNC119/AREG/CCND1/CALCA/FZD10/IFNG/NEDD9/CCND3/HBEGF/IL12B/IL4/PPP2CA/PDGFRB/CD86/WNT5A/MOB1A/PARK7/PKD2/EGR1/CLU/TNFRSF10B/PTK2B/FLT3/CDKN1A/IL1B/BMP2/CCR7/AJUBA/EPO/CHI3L1/CCNB1/PSRC1/BORA/SPRY2/TLR4/CCL21/THBS1/FGF2/CENPE/EGF/MAP3K12/TNFRSF11A/CCN1/CALM2/PDGFC/EGFR/VLDLR/HMGA2/VEGFC/IL18/CACUL1/KIT/CALM3/IL6R/MRNIP/DVL3/DBF4B/TGFBR2/PRKCD/RICTOR/TLR3/CDK5/SYK/NOD2/ADAM9/EFNA1/ADRB2/PTK2/GPRC5C/ALK/MOB3A/CCL19/CKS1B/DAG1/LEP/HRAS/FZD4/CDK5R1/ERN1/PAK2/ADIPOQ/NPM1/CSF1R/ADRA2C/IRAK1/CSF1/CIB1/SOCS1/PPIA/SRC/MAP3K5/ELANE/MTOR/TNF/DAXX/DAXX/TNF/TNF/DAXX/TNF/TNF/TNF/DAXX/TNF/DAXX/TNF/ITGB3/GH1/PTPRC/CCL5/CD24/CCL5/MIF/ELANE | 152 |
| GO:1902532 | negative regulation of intracellular signal transduction | 175/3662 | 467/15509 | 6.92867e-12 | 2.2136e-10 | 1.33122e-10 | KDM1A/ITGA3/PAFAH1B1/CD22/SNAI2/CD74/CD44/HERPUD1/ATP2B4/TMEM161A/SPI1/RHOA/HYAL2/RPS6KA6/MKRN2/FBLN1/PTPRC/GSK3B/MECOM/SEH1L/MAPKAPK5/P2RX7/PEBP1/ESR1/ABL1/PIK3IP1/XBP1/MMP9/BMP7/RASSF2/RIOK3/MGRN1/NPRL3/TSC2/PYCARD/CSK/SFRP1/URI1/YJU2/GSK3A/MET/HSPB1/FKTN/AMBP/CREB3/CXCL12/PPIF/RNF167/C1QBP/FOXM1/SH2B3/MAPK14/PDE4D/PPP2CA/BCL6/STAT1/FHL2/PARK7/HDAC1/ASH1L/MFN2/STMN1/TNFAIP3/HELLS/SFRP5/CLU/IL1B/BMP2/NR1D1/PRMT1/TRAP1/DYRK2/PIN1/LIF/BCL2L2/AJUBA/APOE/EPO/SESN2/PRKAA1/EPHB2/MEN1/PTPN22/SERPINE2/SPRY2/TANK/TLR4/CCN3/SORL1/THBS1/BCL2L10/PPM1B/DUSP5/TMBIM6/IGF1R/ARRB2/SMAD4/EPHA2/ABL2/DYRK3/DUSP10/SLIT2/NONO/SESN3/ITGB1/FOXO1/ITPR1/NDUFC2/CNKSR3/UCHL1/DUSP2/ADIPOR1/ARHGAP35/NLRX1/ZNF385A/ATF3/RNF149/PRKCD/DUSP7/GPER1/ARHGAP12/NDRG2/DDIT4/RHOH/RGS14/EFNA1/OTUD3/TRIAP1/BCL2L1/PDE3A/RELA/DAG1/KCTD13/DDIT3/PTPN2/GRINA/ADIPOQ/PTTG1IP/CHEK2/CIB1/PRKN/MUC1/NF2/LILRB4/C1QL4/MAGI2/SPRY4/NOC2L/PPIA/SRC/SYNGAP1/SPRED2/MTOR/HLA-G/AKT1S1/TMSB4X/HLA-G/NDUFS3/CPNE1/MAGEA3/HLA-G/HLA-G/HLA-G/HLA-G/HLA-G/PDCD6/PTPRC/LILRB4/HLA-G/MIF/LILRB4/LILRB4/RASA3/PTEN/ITCH | 175 |
| GO:0051250 | negative regulation of lymphocyte activation | 79/3662 | 165/15509 | 7.30993e-12 | 2.32338e-10 | 1.39724e-10 | BTK/HFE/TYROBP/CD74/RUNX3/HMGB3/PARP3/FOXP3/CBFB/FCGR2B/TBX21/IL4R/ARG2/PIBF1/CTSG/SMAD7/SFRP1/LILRB1/JAK3/MDK/IL4/BCL6/CD86/ID2/TNFAIP3/ARG1/CD80/INHBA/PKN1/TWSG1/FOXJ1/NDFIP1/SFTPD/PTPN22/IL2RA/HLX/IL10/TNFRSF21/MERTK/RUNX1/CTLA4/CASP3/SHH/PRDX2/INPP5D/LGALS9/CEBPB/GLMN/RAG2/PTPN2/MICA/SOCS1/LILRB4/HMGB1/PDCD1LG2/NRARP/CR1/HLA-G/HLA-G/HLA-G/MICA/MICA/HLA-G/MICA/HLA-G/HLA-G/HLA-G/TNFRSF13B/LILRB1/LILRB4/HLA-G/LILRB1/LILRB1/LILRB1/LILRB4/LILRB4/INPP5D/PTEN/ITCH | 79 |
| GO:0050900 | leukocyte migration | 147/3662 | 375/15509 | 7.34724e-12 | 2.32338e-10 | 1.39724e-10 | ITGAL/ITGA3/PAFAH1B1/SELE/CD9/CD74/F7/SPI1/RHOA/ROCK1/CDC42/WDR1/TBX21/ADD2/MMP2/DNM1L/ICAM1/ABL1/PDGFB/MYH9/CTSG/MMP9/HCK/FLT1/CCL22/CCL17/PYCARD/IL27RA/PIK3CG/PTN/SERPINE1/CREB3/GATA3/CXCL12/C1QBP/CCL2/MDK/CD81/CALCA/NEDD9/IL17A/IL4/WNT5A/IL1A/CCL20/ZAP70/ITGA4/PADI2/CSF3R/PGF/PTK2B/CXCR4/NUP85/IL1B/CCR7/SBDS/RAC2/MTUS1/FOXJ1/SFTPD/EDNRB/IL6/IL10/CCN3/CCL21/THBS1/CYP19A1/TNFRSF11A/APP/ABL2/LYST/SLIT2/PIK3R1/MSN/ITGB1/VEGFC/CXCL13/MMP14/KIT/ITGB2/CXCR5/IL6R/CCR5/VCAM1/CXCR1/PF4/AIMP1/SYK/NOD2/FADD/CX3CR1/RHOH/LGALS9/PTK2/PTAFR/CXCL8/S1PR1/SCG2/CCL11/BSG/IL16/CCL19/CYP7B1/STAT5B/SELP/LEP/PLEC/CALR/CXCR2/CSF1R/PLCB1/CSF1/PDE4B/CXCR3/ZP3/CNR2/HMGB1/PPIA/FUT4/PRTN3/CD47/SRC/ELANE/DPP4/TNF/CD177/TNF/ZNF580/TNF/TNF/TNF/TNF/TNF/TNF/ITGB3/PECAM1/CCL5/CCL5/CCL4/CCL18/CCL4/MIF/ELANE/PRTN3/CCL4/CCL18/CCL18 | 147 |
| GO:1901216 | positive regulation of neuron death | 53/3662 | 94/15509 | 7.99051e-12 | 2.51397e-10 | 1.51186e-10 | BAD/TYROBP/GRN/MAP2K4/RHOA/FCGR2B/PICALM/GSK3B/BAX/ABL1/MYBL2/GSK3A/CASP2/AIMP2/DKK1/IFNG/WNT5A/FASLG/FOXO3/EGR1/CLU/ELK1/SRPK2/TLR4/TFAP2A/ST8SIA2/PARP1/POU4F1/BCL2L11/ITGB2/CAPN2/CASP3/CDK5/DDIT4/ITGAM/FOS/DDIT3/CDK5R1/NQO1/MAP3K5/TNF/DAXX/DAXX/TNF/TNF/DAXX/TNF/TNF/TNF/DAXX/TNF/DAXX/TNF | 53 |
| GO:0002495 | antigen processing and presentation of peptide antigen via MHC class II | 40/3662 | 62/15509 | 8.2411e-12 | 2.56726e-10 | 1.5439e-10 | CD74/FCGR2B/PYCARD/HLA-DQB1/HLA-DQA1/HLA-DOA/HLA-DQB1/HLA-DQA1/HLA-DQB1/HLA-DQA1/HLA-DRA/HLA-DPB1/HLA-DQA1/HLA-DPB1/HLA-DQA1/HLA-DQB1/HLA-DQA1/HLA-DPB1/HLA-DRA/HLA-DQA1/HLA-DRA/HLA-DPB1/HLA-DPB1/HLA-DPB1/HLA-DRB4/HLA-DQB1/HLA-DPA1/HLA-DQA1/HLA-DQB1/HLA-DQA1/HLA-DQA1/HLA-DQB1/HLA-DRA/HLA-DQA1/HLA-DPB1/HLA-DQA1/HLA-DPB1/HLA-DQA1/B2M/HLA-DRA | 40 |
| GO:0042113 | B cell activation | 110/3662 | 258/15509 | 8.24273e-12 | 2.56726e-10 | 1.5439e-10 | BAD/CD38/CD79B/ST3GAL1/BTK/TYROBP/CD22/CD74/HMGB3/BAK1/PARP3/FOXP3/SPI1/KLF6/TCF3/FCGR2B/TBX21/MLH1/PTPRC/LAT2/BAX/MSH2/ABL1/XBP1/CD40/NFATC2/CD40LG/NBN/SFRP1/IL7/LYL1/IL27RA/TGFB1/CD79A/JAK3/EZH2/AHR/EXOSC3/NSD2/CD81/POU2AF1/AICDA/IL4/IL5/BCL6/CD86/ZAP70/ITGA4/ID2/TNFAIP3/PTK2B/FLT3/SHLD2/INHBA/PKN1/CDKN1A/CD70/FOXJ1/NDFIP1/EPHB2/NOTCH2/AKIRIN2/IL6/IL10/TLR4/IL21/SLC15A4/IRF8/DCAF1/PIK3R1/TNFRSF21/IL2RG/ITGB1/ZFP36L2/HHEX/MS4A1/MMP14/KIT/TNFRSF13C/ICOSLG/CXCR5/TNFSF13/VCAM1/CTLA4/PRKCD/CASP3/SYK/RAG1/NOD2/RBPJ/TNIP2/INPP5D/STAT5B/LIG4/RAG2/PTPN2/CD19/CD28/ZFP36L1/FZD9/PAX5/IFNA1/NTRK1/CR1/TNFRSF13B/PRKDC/PTPRC/MIF/INPP5D/PTEN | 110 |
| GO:0045591 | positive regulation of regulatory T cell differentiation | 28/3662 | 36/15509 | 1.00552e-11 | 3.11612e-10 | 1.87398e-10 | FOXP3/IFNG/BCL6/FOXO3/DUSP10/IL2RG/LGALS9/KAT5/KLHL25/SOCS1/LILRB4/CR1/HLA-G/HLA-DRA/HLA-G/HLA-DRA/HLA-DRA/HLA-G/HLA-G/HLA-DRA/HLA-G/HLA-G/HLA-G/LILRB4/HLA-G/HLA-DRA/LILRB4/LILRB4 | 28 |
| GO:0019886 | antigen processing and presentation of exogenous peptide antigen via MHC class II | 39/3662 | 60/15509 | 1.06366e-11 | 3.27989e-10 | 1.97247e-10 | CD74/FCGR2B/HLA-DQB1/HLA-DQA1/HLA-DOA/HLA-DQB1/HLA-DQA1/HLA-DQB1/HLA-DQA1/HLA-DRA/HLA-DPB1/HLA-DQA1/HLA-DPB1/HLA-DQA1/HLA-DQB1/HLA-DQA1/HLA-DPB1/HLA-DRA/HLA-DQA1/HLA-DRA/HLA-DPB1/HLA-DPB1/HLA-DPB1/HLA-DRB4/HLA-DQB1/HLA-DPA1/HLA-DQA1/HLA-DQB1/HLA-DQA1/HLA-DQA1/HLA-DQB1/HLA-DRA/HLA-DQA1/HLA-DPB1/HLA-DQA1/HLA-DPB1/HLA-DQA1/B2M/HLA-DRA | 39 |
| GO:0070371 | ERK1 and ERK2 cascade | 125/3662 | 306/15509 | 1.10408e-11 | 3.38766e-10 | 2.03728e-10 | CD4/IGF1/CD74/CD44/CASR/FLT4/KARS1/FGFR2/FGFR3/RPS6KA6/FBLN1/PTPRC/NOX4/ICAM1/ABL1/PDGFB/CCL22/CCL17/NDRG4/PYCARD/CSK/PRKD2/TGFB1/NOD1/ACTA2/CCL2/PDGFRB/IL1A/CCL20/FN1/TEK/PTK2B/INHBA/IL1B/BMP2/CCR7/RRAS/PIN1/KDR/LIF/APOE/EPO/AKAP12/CHI3L1/EPHB2/PTPN22/NOTCH2/PDGFRA/CD36/SPRY2/TLR4/CCL21/DUSP5/ITGAV/FGF2/EGF/MAP3K12/ARRB2/SMAD4/TNFRSF11A/APP/EPHA2/CCN1/DUSP10/PDGFC/TPBG/EGFR/NOTCH1/ZFP36L2/CNKSR3/PRKCA/NODAL/SHC1/ALOX15/ATF3/DUSP7/GPER1/SYK/NDRG2/FRS2/NOD2/LGALS9/RGS14/CDK1/FGG/FGA/CCL11/CCL19/HRAS/PTPN2/JUN/PTPN11/OXTR/ADIPOQ/F2R/CSF1R/CIB1/ZFP36L1/C1QL4/SPRY4/CARD9/HMGB1/SRC/SPRED2/NTRK1/TNF/TNF/TNF/TNF/TNF/TNF/TNF/TNF/ITGB3/PTPRC/CCL5/CCL5/CCL4/CCL18/CCL4/MIF/CCL4/CCL18/CCL18/PTEN | 125 |
| GO:0007162 | negative regulation of cell adhesion | 116/3662 | 278/15509 | 1.21175e-11 | 3.69972e-10 | 2.22495e-10 | CD9/HFE/SNAI2/CD74/RUNX3/CDH1/FOXP3/ERBB3/SPI1/RHOA/CBFB/FCGR2B/TBX21/PLXNA2/IL4R/FBLN1/ARG2/PTPRC/MMP2/ANGPT2/ABL1/CTSG/SMAD7/LILRB1/TGFB1/JAK3/SERPINE1/AKNA/CXCL12/LPXN/MDK/CORO1C/SH2B3/IL4/BCL6/CD86/ARG1/CD80/BMP2/PODXL/TWSG1/FOXJ1/ASS1/NDFIP1/EPHB2/SFTPD/MEN1/PTPN22/IL2RA/SERPINE2/HLX/IL10/IL1RN/CCL21/RDX/THBS1/CYP1B1/ADAMTS18/ARHGDIA/TBCD/PIK3R1/TNFRSF21/NOTCH1/BMP6/MMP14/DMTN/RUNX1/CTLA4/PRKCD/MELTF/CASP3/SHH/PRDX2/LGALS9/PTK2/SEMA3E/FGG/CEBPB/FZD4/GLMN/RAG2/PTPN2/RCC2/PTPN11/ADIPOQ/ZNF703/SOCS1/MUC1/NF2/LILRB4/SPRY4/HMGB1/SRC/PDCD1LG2/MBP/NRARP/CR1/HLA-G/HLA-G/SIPA1/HLA-G/HLA-G/HLA-G/HLA-G/HLA-G/PTPRC/LILRB1/LILRB4/HLA-G/LILRB1/LILRB1/LILRB1/LILRB4/LILRB4/PTEN/ITCH | 116 |
| GO:0046638 | positive regulation of alpha-beta T cell differentiation | 37/3662 | 56/15509 | 1.73906e-11 | 5.28369e-10 | 3.17752e-10 | RUNX3/FOXP3/AP3D1/RHOA/CBFB/IL4R/IL12RB1/ZBTB16/IFNG/IL12B/CD86/ZAP70/MYB/CD80/RARA/AP3B1/HLX/IL2RG/IL18/RUNX1/TGFBR2/SHH/SYK/LGALS9/CCL19/KLHL25/SOCS1/LILRB4/PNP/HLA-DRA/HLA-DRA/HLA-DRA/HLA-DRA/LILRB4/HLA-DRA/LILRB4/LILRB4 | 37 |
| GO:0061081 | positive regulation of myeloid leukocyte cytokine production involved in immune response | 31/3662 | 43/15509 | 2.33955e-11 | 7.07344e-10 | 4.25384e-10 | CD74/DDX1/MAVS/P2RX7/PYCARD/LILRB1/NOD1/WNT5A/NR4A3/CD36/TLR4/KIT/MAPKAPK2/TLR3/SYK/NOD2/CARD9/TLR7/HLA-G/HLA-G/HLA-G/HLA-G/HLA-G/HLA-G/HLA-G/LILRB1/HLA-G/LILRB1/MIF/LILRB1/LILRB1 | 31 |
| GO:0002507 | tolerance induction | 35/3662 | 52/15509 | 2.75917e-11 | 8.30161e-10 | 4.99244e-10 | FOXP3/CLC/TNFAIP3/FOXJ1/IL2RA/XKR8/TGFBR2/LGALS9/CCR4/LILRB4/HMGB1/HLA-E/HLA-G/HLA-B/HLA-E/HLA-G/HLA-B/HLA-B/HLA-E/HLA-B/HLA-E/HLA-E/HLA-G/HLA-B/HLA-G/HLA-E/HLA-G/HLA-G/HLA-E/HLA-G/LILRB4/HLA-G/LILRB4/LILRB4/ITCH | 35 |
| GO:0032640 | tumor necrosis factor production | 77/3662 | 163/15509 | 3.08869e-11 | 9.20371e-10 | 5.53495e-10 | BTK/TYROBP/LTF/IGF1/FOXP3/CYBA/ARG2/PTPRC/MAVS/ACP5/PYCARD/LILRB1/IL27RA/CD33/NOD1/HSPB1/IFNG/IL17A/IL12B/IL4/WNT5A/IL1A/TNFAIP3/CLU/TNFRSF8/ZFP36/AKAP12/RARA/SYT11/EPHB2/PTPN22/CD36/IL6/IL10/TLR4/THBS1/ARRB2/APP/PIK3R1/MAPKAPK2/PF4/TLR3/SYK/CYBB/NOD2/FADD/CX3CR1/LGALS9/PTAFR/CD14/CCL19/LEP/LPL/PTPN11/ADIPOQ/LILRB4/CARD9/HMGB1/CD47/UBE2J1/HLA-E/HLA-E/HLA-E/HLA-E/ORM1/HLA-E/HLA-E/HLA-E/PTPRC/LILRB1/LILRB4/LILRB1/MIF/LILRB1/LILRB1/LILRB4/LILRB4 | 77 |
| GO:0032680 | regulation of tumor necrosis factor production | 77/3662 | 163/15509 | 3.08869e-11 | 9.20371e-10 | 5.53495e-10 | BTK/TYROBP/LTF/IGF1/FOXP3/CYBA/ARG2/PTPRC/MAVS/ACP5/PYCARD/LILRB1/IL27RA/CD33/NOD1/HSPB1/IFNG/IL17A/IL12B/IL4/WNT5A/IL1A/TNFAIP3/CLU/TNFRSF8/ZFP36/AKAP12/RARA/SYT11/EPHB2/PTPN22/CD36/IL6/IL10/TLR4/THBS1/ARRB2/APP/PIK3R1/MAPKAPK2/PF4/TLR3/SYK/CYBB/NOD2/FADD/CX3CR1/LGALS9/PTAFR/CD14/CCL19/LEP/LPL/PTPN11/ADIPOQ/LILRB4/CARD9/HMGB1/CD47/UBE2J1/HLA-E/HLA-E/HLA-E/HLA-E/ORM1/HLA-E/HLA-E/HLA-E/PTPRC/LILRB1/LILRB4/LILRB1/MIF/LILRB1/LILRB1/LILRB4/LILRB4 | 77 |
| GO:0070374 | positive regulation of ERK1 and ERK2 cascade | 92/3662 | 208/15509 | 3.8017e-11 | 1.12741e-09 | 6.78007e-10 | CD4/IGF1/CD74/CD44/CASR/FLT4/FGFR2/FGFR3/PTPRC/NOX4/ICAM1/ABL1/PDGFB/CCL22/CCL17/NDRG4/PYCARD/PRKD2/TGFB1/NOD1/ACTA2/CCL2/PDGFRB/IL1A/CCL20/TEK/PTK2B/INHBA/BMP2/CCR7/KDR/APOE/EPO/AKAP12/CHI3L1/PTPN22/NOTCH2/PDGFRA/CD36/SPRY2/TLR4/CCL21/FGF2/MAP3K12/ARRB2/TNFRSF11A/APP/PDGFC/TPBG/EGFR/NOTCH1/PRKCA/NODAL/SHC1/ALOX15/GPER1/NOD2/LGALS9/FGG/FGA/CCL11/CCL19/HRAS/JUN/PTPN11/F2R/CSF1R/CIB1/CARD9/HMGB1/SRC/NTRK1/TNF/TNF/TNF/TNF/TNF/TNF/TNF/TNF/ITGB3/PTPRC/CCL5/CCL5/CCL4/CCL18/CCL4/MIF/CCL4/CCL18/CCL18/PTEN | 92 |
| GO:0002701 | negative regulation of production of molecular mediator of immune response | 37/3662 | 57/15509 | 3.82937e-11 | 1.13021e-09 | 6.79688e-10 | HFE/CD22/PARP3/FOXP3/FCGR2B/TBX21/SMAD7/ACP5/LILRB1/TGFB1/JAK3/BCL6/ARG1/NDFIP1/IL10/TMBIM6/CD96/NLRX1/NOD2/PRG2/LILRB4/CR1/TNF/TNF/TNF/TNF/TNF/TNF/TNF/TNF/LILRB1/LILRB4/LILRB1/LILRB1/LILRB1/LILRB4/LILRB4 | 37 |
| GO:0042326 | negative regulation of phosphorylation | 130/3662 | 327/15509 | 3.95624e-11 | 1.16212e-09 | 6.98881e-10 | SLC4A1/SPAG9/MVP/HGF/BAK1/IPO5/ROCK1/HYAL2/SIRT2/SIRT6/FBLN1/PTPRC/PIBF1/TMED2/BAX/RTRAF/ABL1/GADD45B/PIK3IP1/GSKIP/BMP7/RASSF2/SMAD7/PARD6A/TSC2/PYCARD/CSK/SFRP1/TGFB1/HSPB1/ENG/DVL1/DKK1/CHORDC1/CORO1C/SH2B3/IFNG/PDE4D/PPP2CA/MACROH2A1/KAT2B/PRKAR2A/PARK7/GADD45A/TNFAIP3/TARDBP/INHBA/PKN1/LRP1/CDKN1A/IL1B/BMP2/ATG14/AJUBA/CDKN1C/CBFA2T3/APOE/CEP85/VPS25/EPHB2/MEN1/PTPN22/APC/MICAL1/NIBAN1/SPRY2/SORL1/SMAD6/TARBP2/RB1/WARS1/ARRB2/DUSP10/CALM2/CTDSP1/SLIT2/IGFBP3/NCAPG2/C9orf72/PARD3/HHEX/CNKSR3/UCHL1/GNAQ/PPP1R15B/DMTN/CALM3/CAMK2N1/PRKCD/DUSP7/CASP3/DDIT4/PKIG/RGS14/CTDSP2/PTPN2/CHMP6/ANKLE2/JUN/PLEC/TAF7/PAK2/ADIPOQ/NPM1/SLC8A1/NOG/CIB1/INPP5J/SOCS1/PRKN/NF2/LILRB4/HEXIM1/SPRY4/PPIA/SPRED2/AKT1S1/IPO7/DBNDD2/CEBPA/PRKDC/PTPRC/CDKN1C/LILRB4/PIP4K2B/LILRB4/LILRB4/LRP6/PTEN/CHORDC1 | 130 |
| GO:0070372 | regulation of ERK1 and ERK2 cascade | 116/3662 | 283/15509 | 4.71676e-11 | 1.37899e-09 | 8.29297e-10 | CD4/IGF1/CD74/CD44/CASR/FLT4/FGFR2/FGFR3/RPS6KA6/FBLN1/PTPRC/NOX4/ICAM1/ABL1/PDGFB/CCL22/CCL17/NDRG4/PYCARD/CSK/PRKD2/TGFB1/NOD1/ACTA2/CCL2/PDGFRB/IL1A/CCL20/FN1/TEK/PTK2B/INHBA/IL1B/BMP2/CCR7/RRAS/PIN1/KDR/LIF/APOE/EPO/AKAP12/CHI3L1/EPHB2/PTPN22/NOTCH2/PDGFRA/CD36/SPRY2/TLR4/CCL21/FGF2/MAP3K12/ARRB2/SMAD4/TNFRSF11A/APP/EPHA2/CCN1/DUSP10/PDGFC/TPBG/EGFR/NOTCH1/CNKSR3/PRKCA/NODAL/SHC1/ALOX15/ATF3/GPER1/SYK/NDRG2/FRS2/NOD2/LGALS9/RGS14/FGG/FGA/CCL11/CCL19/HRAS/PTPN2/JUN/PTPN11/ADIPOQ/F2R/CSF1R/CIB1/C1QL4/SPRY4/CARD9/HMGB1/SRC/SPRED2/NTRK1/TNF/TNF/TNF/TNF/TNF/TNF/TNF/TNF/ITGB3/PTPRC/CCL5/CCL5/CCL4/CCL18/CCL4/MIF/CCL4/CCL18/CCL18/PTEN | 116 |
| GO:0050730 | regulation of peptidyl-tyrosine phosphorylation | 106/3662 | 252/15509 | 5.23325e-11 | 1.5228e-09 | 9.15786e-10 | CD4/MVP/IGF1/CNTN1/CD74/HGF/CD44/ERBB3/HYAL2/FGFR3/PTPRC/DLG3/PIBF1/NOX4/ABL1/OSM/PDGFB/CD40/ADNP/GATA1/EHD4/SFRP1/IL7/TGFB1/CSF3/UNC119/AREG/HPX/CD81/SH2B3/IFNG/NEDD9/HBEGF/IL12B/IL4/IL5/PPP2CA/HES1/NCL/PDCL3/PTK2B/CD80/FLT3/LIF/EPO/VPS25/LRP4/CD36/IL6/IL21/EGF/ARRB2/APP/PDGFC/EGFR/NCAPG2/IL18/BMP6/KIT/DMTN/ITGB2/SHC1/IL6R/IL24/PRKCD/RICTOR/IL3/CSF2/SYK/ZNF592/NOD2/EFNA1/ALK/PRKCE/CSPG4/LEP/PTPN2/CHMP6/PTPN11/PAK2/ADIPOQ/CSF1R/SOCS1/NF2/LILRB4/SRC/MTOR/TNF/TNF/TNF/TNF/TNF/TNF/TNF/TNF/ITGB3/GH1/PECAM1/PTPRC/CCL5/CD24/CCL5/LILRB4/MIF/LILRB4/LILRB4 | 106 |
| GO:0032635 | interleukin-6 production | 74/3662 | 156/15509 | 5.82717e-11 | 1.67985e-09 | 1.01023e-09 | BTK/TYROBP/CD74/HGF/POU2F2/FOXP3/CYBA/HYAL2/MAVS/P2RX7/XBP1/TLR8/PYCARD/CSK/IL27RA/NOD1/POU2AF1/IFNG/IL17A/WNT5A/IL1A/TNFAIP3/IL1B/FOXJ1/SYT11/PTPN22/CD36/AKIRIN2/IL6/IL10/TLR4/ARRB2/APP/NLRX1/IL6R/MAPKAPK2/CAPN2/TLR3/SYK/NOD2/INPP5D/LGALS9/PTAFR/CEBPB/IL16/LEP/LPL/PTPN11/F2R/LILRB4/CARD9/HMGB1/IL1RAP/TLR7/CD47/MBP/TNF/TNF/HLA-B/HLA-B/TNF/HLA-B/TNF/TNF/HLA-B/TNF/ORM1/TNF/HLA-B/TNF/LILRB4/LILRB4/LILRB4/INPP5D | 74 |
| GO:0032675 | regulation of interleukin-6 production | 74/3662 | 156/15509 | 5.82717e-11 | 1.67985e-09 | 1.01023e-09 | BTK/TYROBP/CD74/HGF/POU2F2/FOXP3/CYBA/HYAL2/MAVS/P2RX7/XBP1/TLR8/PYCARD/CSK/IL27RA/NOD1/POU2AF1/IFNG/IL17A/WNT5A/IL1A/TNFAIP3/IL1B/FOXJ1/SYT11/PTPN22/CD36/AKIRIN2/IL6/IL10/TLR4/ARRB2/APP/NLRX1/IL6R/MAPKAPK2/CAPN2/TLR3/SYK/NOD2/INPP5D/LGALS9/PTAFR/CEBPB/IL16/LEP/LPL/PTPN11/F2R/LILRB4/CARD9/HMGB1/IL1RAP/TLR7/CD47/MBP/TNF/TNF/HLA-B/HLA-B/TNF/HLA-B/TNF/TNF/HLA-B/TNF/ORM1/TNF/HLA-B/TNF/LILRB4/LILRB4/LILRB4/INPP5D | 74 |
| GO:0007249 | I-kappaB kinase/NF-kappaB signaling | 108/3662 | 259/15509 | 6.47387e-11 | 1.85764e-09 | 1.11715e-09 | CASP10/MAP3K14/CD4/BTK/PPP5C/LTF/UFL1/CD74/BIRC3/TRAF1/RHOA/ROCK1/TRAF4/DDX1/MID2/ERC1/FKBP1A/MAVS/ESR1/ABL1/NFKBIA/CD40/VAPA/RIOK3/TLR8/NDFIP2/UBE2I/PYCARD/EEF1D/NOD1/HSPB1/TRIM14/WNT5A/IL1A/STAT1/HDAC1/ASH1L/FASLG/TNFAIP3/TNFRSF10B/TRIM25/TNFSF10/IL1B/RBCK1/CCR7/NR1D1/IRF3/AJUBA/EDA2R/TRAF3/NDFIP1/CC2D1A/TRIM5/TRIM22/CD36/EDNRB/TANK/TLR4/CCL21/PPM1B/PLK2/GJA1/TAB3/FAIM/NLRX1/SHISA5/TLR3/BTRC/NOD2/TRIM68/FADD/NKIRAS2/CX3CR1/RHOH/TNIP2/LGALS9/PRKCE/TRIM8/LURAP1/CCL19/RELA/TMEM9B/ADIPOQ/F2R/IRAK1/PRKN/ROR1/LILRB4/CARD9/TLR7/MIB2/NKIRAS1/TNF/TRIM13/TNF/CHUK/CPNE1/TNF/TNF/TNF/TNF/TNF/TNF/IKBKG/LILRB4/LILRB4/LILRB4/SQSTM1 | 108 |
| GO:0071706 | tumor necrosis factor superfamily cytokine production | 78/3662 | 168/15509 | 6.66898e-11 | 1.89607e-09 | 1.14026e-09 | BTK/TYROBP/LTF/IGF1/FOXP3/CYBA/ARG2/PTPRC/MAVS/ACP5/PYCARD/LILRB1/IL27RA/CD33/NOD1/HSPB1/IFNG/IL17A/IL12B/IL4/CD86/WNT5A/IL1A/TNFAIP3/CLU/TNFRSF8/ZFP36/AKAP12/RARA/SYT11/EPHB2/PTPN22/CD36/IL6/IL10/TLR4/THBS1/ARRB2/APP/PIK3R1/MAPKAPK2/PF4/TLR3/SYK/CYBB/NOD2/FADD/CX3CR1/LGALS9/PTAFR/CD14/CCL19/LEP/LPL/PTPN11/ADIPOQ/LILRB4/CARD9/HMGB1/CD47/UBE2J1/HLA-E/HLA-E/HLA-E/HLA-E/ORM1/HLA-E/HLA-E/HLA-E/PTPRC/LILRB1/LILRB4/LILRB1/MIF/LILRB1/LILRB1/LILRB4/LILRB4 | 78 |
| GO:1903555 | regulation of tumor necrosis factor superfamily cytokine production | 78/3662 | 168/15509 | 6.66898e-11 | 1.89607e-09 | 1.14026e-09 | BTK/TYROBP/LTF/IGF1/FOXP3/CYBA/ARG2/PTPRC/MAVS/ACP5/PYCARD/LILRB1/IL27RA/CD33/NOD1/HSPB1/IFNG/IL17A/IL12B/IL4/CD86/WNT5A/IL1A/TNFAIP3/CLU/TNFRSF8/ZFP36/AKAP12/RARA/SYT11/EPHB2/PTPN22/CD36/IL6/IL10/TLR4/THBS1/ARRB2/APP/PIK3R1/MAPKAPK2/PF4/TLR3/SYK/CYBB/NOD2/FADD/CX3CR1/LGALS9/PTAFR/CD14/CCL19/LEP/LPL/PTPN11/ADIPOQ/LILRB4/CARD9/HMGB1/CD47/UBE2J1/HLA-E/HLA-E/HLA-E/HLA-E/ORM1/HLA-E/HLA-E/HLA-E/PTPRC/LILRB1/LILRB4/LILRB1/MIF/LILRB1/LILRB1/LILRB4/LILRB4 | 78 |
| GO:0016032 | viral process | 144/3662 | 375/15509 | 6.98114e-11 | 1.97576e-09 | 1.18819e-09 | ST3GAL1/CD4/PTBP1/LTF/CD74/YTHDC2/EIF2AK2/HYAL2/ST6GAL1/MID2/GSK3B/ATG16L1/CHMP5/MAVS/CCNK/ICAM1/HSP90AB1/SMARCB1/CHMP4B/VAPA/KPNA3/N4BP1/PARD6A/MON1B/SLC1A5/USF2/GSK3A/EIF3B/TRIM14/EIF3A/CCL2/EFNB3/HSPA8/DDX6/CD81/HCFC2/AICDA/CD86/SPCS1/STAT1/HDAC1/NR5A2/VAMP8/TARDBP/TRIM25/CD80/CXCR4/STAU1/NUP153/DEK/PRMT1/ZFP36/NECTIN2/APOE/CHMP1A/TOP2A/TRIM5/TRIM22/ARL8B/SRPK2/MDFIC/ST6GALNAC4/ITGAV/SLC7A1/TARBP2/FURIN/EPHA2/EGFR/GSN/NOTCH1/NCAM1/HMGA2/ITGB1/BICD1/NMT2/EEF1A1/ST3GAL2/CTBP1/CCR5/GFI1/VCP/MBL2/PSMC3/ANPEP/TRIM68/SLC3A2/ATG16L2/LGALS9/CXCL8/GYPA/PDCD6IP/CDK1/TRIM8/BCL2L1/PAIP1/BSG/HCFC1/CFL1/DAG1/LIG4/LARP7/PDE12/CTBP2/BANF1/CHMP6/TMEM39A/JUN/CD28/CIITA/CSF1R/ST6GALNAC3/PRKN/SLC52A2/IFITM1/HEXIM1/PLSCR1/HMGB1/PPIA/CD55/IGF2R/PCBP2/DPP4/WWP2/CR1/TNF/TRIM13/TNF/ZBED1/TNF/TNF/TNF/TNF/TNF/TNF/TRIM26/TMEM250/ITGB3/CCL5/CCL5/CCL4/CCL4/SMARCB1/CCL4/ITCH | 144 |
| GO:0002695 | negative regulation of leukocyte activation | 87/3662 | 195/15509 | 7.40447e-11 | 2.08604e-09 | 1.25451e-09 | BTK/HFE/TYROBP/CD74/RUNX3/HMGB3/GRN/PARP3/FOXP3/SPI1/CBFB/FCGR2B/TBX21/IL4R/ARG2/PTPRC/PIBF1/CTSG/SMAD7/SFRP1/LILRB1/JAK3/MDK/IL4/BCL6/CD86/ID2/TNFAIP3/ARG1/CD80/INHBA/PKN1/NR1D1/TWSG1/FOXJ1/NDFIP1/SYT11/SFTPD/PTPN22/IL2RA/HLX/IL10/TNFRSF21/MERTK/RUNX1/CTLA4/CASP3/SHH/GPER1/PRDX2/INPP5D/LGALS9/CEBPB/GLMN/RAG2/PTPN2/MICA/SOCS1/LILRB4/CNR2/HMGB1/PDCD1LG2/NRARP/CR1/HLA-G/HLA-G/HLA-G/MICA/MICA/HLA-G/MICA/HLA-G/HLA-G/HLA-G/TNFRSF13B/PTPRC/LILRB1/LILRB4/HLA-G/LILRB1/LILRB1/LILRB1/LILRB4/LILRB4/INPP5D/PTEN/ITCH | 87 |
| GO:0009991 | response to extracellular stimulus | 171/3662 | 466/15509 | 8.56915e-11 | 2.40324e-09 | 1.44527e-09 | MPO/PON1/HFE/SNAI2/CPS1/GLRX2/RRAGD/FAS/CASR/CLEC16A/HSPA5/CYBA/EIF2AK2/F7/KDM4A/SIRT2/NUCB2/ASNS/MBD3/PTPRC/OXCT1/SEH1L/BAX/P2RX7/GCN1/COMT/SH3GLB1/XBP1/PCK2/ADNP/BMP7/NPRL3/SFRP1/TLE5/HAMP/USF2/MAPK8/RPS6KB1/RNF167/HSPA8/CCND1/FOLR1/CYP27B1/VDR/PPARD/MAPK14/IL1A/ITGA4/STAT1/IGFBP2/ELAPOR1/SLC2A1/NENF/ARG1/FOXO3/SPP1/DNMT3A/TRIM25/CAT/TRIM24/SIRT5/CDKN1A/RUNX2/MAX/BECN1/ATG14/ZFP36/ALDH1A2/CD68/APOE/EPO/GDF15/ASS1/SESN2/RARA/PRKAA1/MYBBP1A/HNRNPA1/GLUL/TTC5/SORL1/CYP1B1/GABARAPL1/BNIP2/IGF1R/BBS4/CYP1A1/MEAK7/TNFRSF11A/PMAIP1/SOD1/ENSA/PKLR/OGT/ALAD/ZEB1/SESN3/FOXO1/NR4A2/KLF10/WIPI2/STC1/ARHGAP35/BRSK1/WNT4/OMA1/VCAM1/ATF3/INHBB/TGFBR2/ALB/RICTOR/TNFRSF11B/CYBB/AQP3/ZFYVE1/SLC27A4/NOD2/MN1/ADRB2/FOS/MGMT/PPM1D/EIF2AK3/KAT5/BRSK2/LEP/DDIT3/LPL/FOSL1/A2M/TYMS/PLEC/RMI1/DCTPP1/SSTR2/NQO1/ADIPOQ/SLC8A1/CNTN2/FOXO4/GAS2L1/PRR5/AKR1C3/TRPV1/SRC/KANK2/MAP3K5/ATG7/NTRK1/F5/MTOR/TNF/TNF/SIPA1/LTA/TNF/LTA/TNF/TNF/TNF/TNF/LTA/LTA/TNF/LTA/ADSL/GH1/PTPRC/PKLR/LOC102724560 | 171 |
| GO:0002485 | antigen processing and presentation of endogenous peptide antigen via MHC class I via ER pathway, TAP-dependent | 16/3662 | 16/15509 | 9.10464e-11 | 2.54192e-09 | 1.52866e-09 | TAP2/TAP2/TAP2/HLA-A/HLA-A/TAP2/HLA-A/HLA-A/TAP2/HLA-A/TAP2/HLA-A/HLA-A/TAP2/HLA-A/TAP2 | 16 |
| GO:0050673 | epithelial cell proliferation | 153/3662 | 406/15509 | 9.14858e-11 | 2.54273e-09 | 1.52915e-09 | BAD/WNT16/BTK/IGF1/SNAI2/HGF/RUNX3/BAK1/GRN/FLT4/CYBA/RASGRF1/CDH3/NGFR/TIE1/FGFR2/CDC42/TP63/RAP1GAP/SIRT6/FGFR1/PGR/BAX/APOH/ESR1/XBP1/PDGFB/FERMT1/PPP1R16B/FLT1/EYA1/SFRP1/PRKD2/TGFB1/PTN/HOXA5/TGFBR1/GATA3/CXCL12/BMPR1A/CCL2/AREG/CCND1/MDK/VDR/PPARD/IL12B/WNT5A/HES1/ITGA4/STAT1/PDCL3/ID2/KDM5B/IRF6/NRP2/TNFAIP3/ARG1/KLF9/NR4A3/PGF/TEK/TRIM24/NR4A1/RUNX2/BMP2/ID1/NR1D1/STAT5A/BCL11B/ZFP36/KDR/ALDH1A2/BCL2L2/CDKN1C/APOE/LAMA5/MEN1/LOXL2/NOTCH2/GLUL/LAMC1/EDNRB/IL6/HLX/IL10/CCN3/THBS1/FGF2/EGF/BRCA2/RB1/EPHA2/ARNT/DUSP10/EGFR/IGFBP3/NOTCH1/ZEB1/TCF7L2/VEGFC/BMP6/PRKCA/NODAL/MMP14/KIT/EMC10/PYGO2/AIMP1/AGGF1/SHH/HTRA1/BTRC/FRS2/NOD2/RBPJ/BCL2L1/SCG2/CCL11/CEBPB/CYP7B1/EGFL7/LEP/HRAS/JUN/ERN1/NKX2-5/NOG/ZNF703/ZFP36L1/HMGB1/NRARP/TNF/TNF/ZNF580/NRAS/TNF/TNF/TNF/TNF/TNF/TNF/NME1/NEAT1/PDCD6/PRKDC/ITGB3/B2M/CDKN1C/AKT3/UHRF1/PTEN/TINF2 | 153 |
| GO:0002710 | negative regulation of T cell mediated immunity | 28/3662 | 38/15509 | 9.40957e-11 | 2.60359e-09 | 1.56576e-09 | HFE/FOXP3/FCGR2B/TBX21/PTPRC/SMAD7/LILRB1/AHR/PPP3CB/ARG1/NOD2/LILRB4/HLA-G/HLA-G/HLA-G/HLA-G/HLA-G/HLA-G/HLA-G/PTPRC/LILRB1/LILRB4/HLA-G/LILRB1/LILRB1/LILRB1/LILRB4/LILRB4 | 28 |
| GO:2000351 | regulation of endothelial cell apoptotic process | 39/3662 | 63/15509 | 9.618e-11 | 2.64944e-09 | 1.59333e-09 | ICAM1/ABL1/CD40/CD40LG/SERPINE1/GATA3/CCL2/IL4/ITGA4/CD160/FASLG/TNFAIP3/FOXO3/TEK/KDR/THBS1/TERT/GPER1/TNIP2/FGG/FGA/SCG2/AKR1C3/TNF/HLA-G/TNF/HLA-G/TNF/TNF/TNF/TNF/TNF/HLA-G/TNF/HLA-G/HLA-G/HLA-G/HLA-G/HLA-G | 39 |
| GO:0022408 | negative regulation of cell-cell adhesion | 86/3662 | 193/15509 | 1.02884e-10 | 2.82157e-09 | 1.69684e-09 | CD9/HFE/CD74/RUNX3/CDH1/FOXP3/SPI1/CBFB/FCGR2B/TBX21/IL4R/ARG2/ABL1/CTSG/SMAD7/LILRB1/TGFB1/JAK3/AKNA/CXCL12/MDK/SH2B3/IL4/BCL6/CD86/ARG1/CD80/BMP2/PODXL/TWSG1/FOXJ1/ASS1/NDFIP1/SFTPD/PTPN22/IL2RA/SERPINE2/HLX/IL10/IL1RN/CCL21/RDX/ADAMTS18/TNFRSF21/NOTCH1/BMP6/RUNX1/CTLA4/PRKCD/CASP3/SHH/PRDX2/LGALS9/PTK2/FGG/CEBPB/GLMN/RAG2/PTPN2/ADIPOQ/ZNF703/SOCS1/NF2/LILRB4/HMGB1/PDCD1LG2/MBP/NRARP/CR1/HLA-G/HLA-G/HLA-G/HLA-G/HLA-G/HLA-G/HLA-G/LILRB1/LILRB4/HLA-G/LILRB1/LILRB1/LILRB1/LILRB4/LILRB4/PTEN/ITCH | 86 |
| GO:1904019 | epithelial cell apoptotic process | 64/3662 | 129/15509 | 1.05917e-10 | 2.89196e-09 | 1.73917e-09 | BAD/E2F2/BAX/ICAM1/ESR1/ABL1/CD40/CD40LG/PIK3CG/SERPINE1/SFRP4/GATA3/CCL2/MDK/KRT18/IL4/ITGA4/CD160/FASLG/TNFAIP3/FOXO3/DNMT3A/TEK/ZFP36/KDR/PRKAA1/IL6/IL10/THBS1/RB1/IGF1R/ARRB2/GSN/TCF7L2/CAST/TGFBR2/CASP3/TERT/GPER1/TNIP2/BCL2L1/FGG/FGA/SCG2/NKX2-5/ZFP36L1/AKR1C3/MAP3K5/TNF/HLA-G/TNF/HLA-G/TNF/TNF/TNF/TNF/TNF/HLA-G/TNF/HLA-G/HLA-G/HLA-G/HLA-G/HLA-G | 64 |
| GO:0002922 | positive regulation of humoral immune response | 25/3662 | 32/15509 | 1.12459e-10 | 3.05711e-09 | 1.83849e-09 | FCGR2B/PTPRC/FCER2/HPX/IL17A/IL1B/C3/CCR7/NOD2/ZP3/CR1/TNF/TNF/LTA/TNF/LTA/TNF/TNF/TNF/TNF/LTA/LTA/TNF/LTA/PTPRC | 25 |
| GO:0043122 | regulation of I-kappaB kinase/NF-kappaB signaling | 98/3662 | 230/15509 | 1.17502e-10 | 3.18024e-09 | 1.91254e-09 | CASP10/MAP3K14/CD4/PPP5C/LTF/UFL1/CD74/BIRC3/TRAF1/RHOA/TRAF4/DDX1/MID2/FKBP1A/MAVS/ESR1/ABL1/CD40/VAPA/RIOK3/NDFIP2/UBE2I/PYCARD/EEF1D/NOD1/HSPB1/TRIM14/WNT5A/IL1A/STAT1/HDAC1/ASH1L/FASLG/TNFAIP3/TNFRSF10B/TRIM25/TNFSF10/IL1B/RBCK1/CCR7/NR1D1/IRF3/AJUBA/EDA2R/TRAF3/NDFIP1/CC2D1A/TRIM5/TRIM22/CD36/TANK/TLR4/CCL21/PPM1B/PLK2/GJA1/TAB3/NLRX1/SHISA5/TLR3/BTRC/NOD2/TRIM68/FADD/NKIRAS2/RHOH/TNIP2/LGALS9/PRKCE/TRIM8/LURAP1/CCL19/RELA/TMEM9B/ADIPOQ/F2R/IRAK1/PRKN/ROR1/LILRB4/CARD9/MIB2/TNF/TRIM13/TNF/CHUK/CPNE1/TNF/TNF/TNF/TNF/TNF/TNF/IKBKG/LILRB4/LILRB4/LILRB4/SQSTM1 | 98 |
| GO:0048732 | gland development | 151/3662 | 401/15509 | 1.29666e-10 | 3.49422e-09 | 2.10136e-09 | HOXA11/SNAI2/HGF/CPS1/CDH1/NTN1/FGFR2/PITX1/CSNK2A2/TP63/GLI2/RAP1GAP/HOXA9/PGR/ZMPSTE24/BAX/MMP2/ESR1/ABL1/SMARCB1/XBP1/ACO2/PCK2/BMP7/LAMA1/RPGRIP1L/SFRP1/TGFB1/HAMP/USF2/PTN/MET/HOXA5/EZH2/TGFBR1/GATA3/BMPR1A/WNT3/AREG/CCND1/CCKBR/MDK/VDR/SLC29A1/NPHP3/WNT5A/HES1/ID2/ASH1L/KDM5B/IRF6/TNFAIP3/ARG1/PKD2/CRHR1/BMP2/THRA/STAT5A/ELK1/BCL11B/HOXD3/HOXD9/TWSG1/ALDH1A2/CDO1/LAMA5/ASS1/RARA/NOTCH2/PDGFRA/HNF1A/SERPINE2/IL6/NKX2-1/HLX/IL10/CYP19A1/CYP1B1/FGF2/EGF/BRCA2/CYP1A1/ARMC5/SMAD4/TNFRSF11A/SOD1/EPHA2/EGFR/MSN/NOTCH1/ARID5B/BCL2L11/NODAL/ARHGAP35/WNT4/FRZB/INHBB/PYGO2/TGFBR2/PITX2/SHH/BTRC/FRS2/RAG1/PRDX2/FADD/RBPJ/MGMT/CCL11/CEBPB/CYP7B1/RARG/RELA/DAG1/STAT5B/SMAD2/ZDHHC21/TYMS/JUN/OXTR/PLAG1/CACNB4/CSF1R/EPHB3/NKX2-5/NOG/ZNF703/CSF1/POU3F2/PBX1/WNT7B/IGF2R/SRC/PHF2/TGM2/MAFB/TNF/TNF/TNF/TNF/TNF/TNF/TNF/TNF/NME1/CEBPA/HOXA10/SMARCB1/WNT3/WNT3/PTEN | 151 |
| GO:0002719 | negative regulation of cytokine production involved in immune response | 31/3662 | 45/15509 | 1.52269e-10 | 4.08555e-09 | 2.45698e-09 | HFE/FOXP3/TBX21/SMAD7/ACP5/LILRB1/TGFB1/JAK3/BCL6/ARG1/IL10/CD96/NLRX1/NOD2/PRG2/LILRB4/TNF/TNF/TNF/TNF/TNF/TNF/TNF/TNF/LILRB1/LILRB4/LILRB1/LILRB1/LILRB1/LILRB4/LILRB4 | 31 |
| GO:1904035 | regulation of epithelial cell apoptotic process | 55/3662 | 105/15509 | 1.54312e-10 | 4.12253e-09 | 2.47922e-09 | BAD/BAX/ICAM1/ESR1/ABL1/CD40/CD40LG/SERPINE1/SFRP4/GATA3/CCL2/MDK/IL4/ITGA4/CD160/FASLG/TNFAIP3/FOXO3/TEK/ZFP36/KDR/PRKAA1/IL6/THBS1/RB1/IGF1R/ARRB2/GSN/TCF7L2/CAST/TERT/GPER1/TNIP2/FGG/FGA/SCG2/NKX2-5/ZFP36L1/AKR1C3/TNF/HLA-G/TNF/HLA-G/TNF/TNF/TNF/TNF/TNF/HLA-G/TNF/HLA-G/HLA-G/HLA-G/HLA-G/HLA-G | 55 |
| GO:0061082 | myeloid leukocyte cytokine production | 37/3662 | 59/15509 | 1.69348e-10 | 4.48554e-09 | 2.69753e-09 | CD74/DDX1/MAVS/P2RX7/ACP5/PYCARD/LILRB1/TGFB1/NOD1/BCL6/WNT5A/NR4A3/CD36/TLR4/KIT/NLRX1/MAPKAPK2/TLR3/SYK/NOD2/PRG2/CARD9/TLR7/UBE2J1/HLA-G/HLA-G/HLA-G/HLA-G/HLA-G/HLA-G/HLA-G/LILRB1/HLA-G/LILRB1/MIF/LILRB1/LILRB1 | 37 |
| GO:0097028 | dendritic cell differentiation | 37/3662 | 59/15509 | 1.69348e-10 | 4.48554e-09 | 2.69753e-09 | SPI1/FCGR2B/DHRS2/GATA1/LILRB1/IL4/FLT3/CCR7/NOTCH2/IRF4/IRF8/TGFBR2/CSF2/RBPJ/LGALS9/CEBPB/CCL19/HMGB1/PRTN3/HLA-G/HLA-B/HLA-G/HLA-B/HLA-B/HLA-B/HLA-G/HLA-B/HLA-G/HLA-G/HLA-G/HLA-G/LILRB1/HLA-G/LILRB1/LILRB1/PRTN3/LILRB1 | 37 |
| GO:0014066 | regulation of phosphatidylinositol 3-kinase signaling | 56/3662 | 108/15509 | 1.76224e-10 | 4.64782e-09 | 2.79511e-09 | WNT16/DCN/IGF1/HGF/ERBB3/FGFR1/OSM/PIK3IP1/PDGFB/PPP1R16B/FLT1/TSC2/UNC5B/CSF3/PPARD/PDGFRB/FN1/TEK/CAT/FLT3/BECN1/KDR/PDGFRA/SERPINE2/FGF2/EGF/IGF1R/PDGFC/EGFR/NTRK2/IL18/KIT/GPER1/PTK2/SEMA3E/SELP/LEP/CD28/F2/F2R/ROR1/PRR5/SRC/NTRK1/TNF/TNF/TNF/TNF/TNF/TNF/TNF/TNF/GH1/CCL5/CCL5/PTEN | 56 |
| GO:0032757 | positive regulation of interleukin-8 production | 39/3662 | 64/15509 | 1.90211e-10 | 4.99545e-09 | 3.00418e-09 | CD74/HYAL2/MAVS/TLR8/PYCARD/PRKD2/NOD1/SERPINE1/WNT5A/PARK7/CD244/IL1B/CHI3L1/IL6/TLR4/TLR3/SYK/NOD2/FADD/LGALS9/CD14/RELA/LEP/DDIT3/ADIPOQ/F2R/HMGB1/TLR7/ELANE/TNF/TNF/ZNF580/TNF/TNF/TNF/TNF/TNF/TNF/ELANE | 39 |
| GO:0050679 | positive regulation of epithelial cell proliferation | 88/3662 | 201/15509 | 1.92673e-10 | 5.03876e-09 | 3.03022e-09 | BAD/BTK/IGF1/GRN/FLT4/CYBA/CDH3/FGFR2/CDC42/TP63/SIRT6/FGFR1/XBP1/PDGFB/PPP1R16B/EYA1/SFRP1/PRKD2/PTN/TGFBR1/CXCL12/BMPR1A/AREG/CCND1/MDK/WNT5A/ITGA4/PDCL3/KDM5B/NRP2/TNFAIP3/ARG1/NR4A3/PGF/TEK/NR4A1/RUNX2/BMP2/ID1/STAT5A/KDR/NOTCH2/GLUL/LAMC1/HLX/IL10/FGF2/EGF/ARNT/EGFR/NOTCH1/TCF7L2/VEGFC/BMP6/PRKCA/NODAL/EMC10/AGGF1/SHH/HTRA1/NOD2/RBPJ/SCG2/CCL11/CYP7B1/EGFL7/HRAS/JUN/NKX2-5/NOG/ZNF703/HMGB1/NRARP/TNF/TNF/ZNF580/NRAS/TNF/TNF/TNF/TNF/TNF/TNF/NME1/NEAT1/PDCD6/ITGB3/AKT3 | 88 |
| GO:0072577 | endothelial cell apoptotic process | 41/3662 | 69/15509 | 1.99469e-10 | 5.19457e-09 | 3.12392e-09 | ICAM1/ABL1/CD40/CD40LG/SERPINE1/GATA3/CCL2/IL4/ITGA4/CD160/FASLG/TNFAIP3/FOXO3/TEK/KDR/IL10/THBS1/TERT/GPER1/TNIP2/FGG/FGA/SCG2/AKR1C3/MAP3K5/TNF/HLA-G/TNF/HLA-G/TNF/TNF/TNF/TNF/TNF/HLA-G/TNF/HLA-G/HLA-G/HLA-G/HLA-G/HLA-G | 41 |
| GO:0002009 | morphogenesis of an epithelium | 176/3662 | 488/15509 | 2.24204e-10 | 5.81429e-09 | 3.49661e-09 | WNT16/HOXA11/PAFAH1B1/SNAI2/HGF/CD44/CASR/LAMA3/NGFR/NTN1/TIE1/FGFR2/RHOA/CDC42/WDR1/PRKACA/TP63/GLI2/ACTB/GPC4/SIRT6/TULP3/LRP2/PGR/DLG3/RAB10/TMED2/MMP2/KDM2B/ESR1/HECTD1/ABL1/CECR2/MTHFD1/BMP7/FERMT1/LAMA1/NDRG4/TSC2/RPGRIP1L/EYA1/SFRP1/PRKD2/TGFB1/TMEM59L/MET/HOXA5/ENG/DVL1/GATA3/DKK1/AREG/FOLR1/MDK/WNT5B/VDR/HBEGF/NPHP3/WNT5A/HES1/STAT1/KDM5B/PKD2/GNA13/MTHFD1L/GORAB/CXCR4/SOX4/BMP2/FLRT3/KDR/LIF/PODXL/ALDH1A2/AJUBA/COL5A1/LAMA5/RARA/GRSF1/KRAS/NOTCH2/AHI1/SPRY2/CCM2/NKX2-1/IL10/TFAP2A/FGF2/EGF/BBS4/ITGAX/GREB1L/SMAD4/EPHA2/CCN1/CELSR2/RHOB/SLIT2/ADAMTS16/KLHL3/EGFR/MSN/NOTCH1/ITGB1/VEGFC/FREM2/GJA1/NODAL/MMP14/SKI/ARHGAP35/BRSK1/DVL3/WNT4/VANGL2/RBM15/FRZB/TGFBR2/CASP3/FOXQ1/SHH/ARHGAP12/TTC8/BTRC/FRS2/RBPJ/SEMA4C/ARL13B/SEMA3E/CCL11/CYP7B1/RARG/DAG1/HOXB2/BRSK2/GLMN/GRB2/CTNNBIP1/CXCR2/SETD2/RGMA/CSF1R/NKX2-5/NOG/CSF1/ROR1/PBX1/MAGI2/WNT7B/MRTFA/SRC/NRARP/MTOR/TGM2/BRD2/FKBPL/CSNK2B/TNF/TCTN1/TNF/BRD2/TNF/CSNK2B/CSNK2B/TNF/TNF/CSNK2B/TNF/TNF/BRD2/TNF/CSNK2B/BRD2/BRD2/PTEN/PRKACA | 176 |
| GO:0050678 | regulation of epithelial cell proliferation | 134/3662 | 348/15509 | 2.58358e-10 | 6.67209e-09 | 4.01248e-09 | BAD/BTK/IGF1/SNAI2/RUNX3/GRN/FLT4/CYBA/CDH3/NGFR/TIE1/FGFR2/CDC42/TP63/RAP1GAP/SIRT6/FGFR1/PGR/BAX/APOH/XBP1/PDGFB/PPP1R16B/FLT1/EYA1/SFRP1/PRKD2/TGFB1/PTN/HOXA5/TGFBR1/GATA3/CXCL12/BMPR1A/CCL2/AREG/CCND1/MDK/VDR/PPARD/IL12B/WNT5A/HES1/ITGA4/STAT1/PDCL3/KDM5B/IRF6/NRP2/TNFAIP3/ARG1/KLF9/NR4A3/PGF/TEK/TRIM24/NR4A1/RUNX2/BMP2/ID1/NR1D1/STAT5A/BCL11B/ZFP36/KDR/ALDH1A2/CDKN1C/APOE/LAMA5/MEN1/NOTCH2/GLUL/LAMC1/EDNRB/HLX/IL10/THBS1/FGF2/EGF/BRCA2/RB1/ARNT/DUSP10/EGFR/NOTCH1/ZEB1/TCF7L2/VEGFC/BMP6/PRKCA/NODAL/EMC10/PYGO2/AIMP1/AGGF1/SHH/HTRA1/FRS2/NOD2/RBPJ/SCG2/CCL11/CYP7B1/EGFL7/LEP/HRAS/JUN/NKX2-5/NOG/ZNF703/ZFP36L1/HMGB1/NRARP/TNF/TNF/ZNF580/NRAS/TNF/TNF/TNF/TNF/TNF/TNF/NME1/NEAT1/PDCD6/PRKDC/ITGB3/B2M/CDKN1C/AKT3/UHRF1/PTEN/TINF2 | 134 |
| GO:0045445 | myoblast differentiation | 53/3662 | 101/15509 | 3.03707e-10 | 7.81068e-09 | 4.6972e-09 | IFRD1/IGF1/ARID1B/PITX1/ACTB/MBNL3/SMARCB1/CCL17/TGFB1/SMARCD2/DDX5/PPARD/MAPK14/SDC1/EPAS1/BCL9/ARID1A/SOX4/SOX15/FLOT2/BTG1/RB1/IGFBP3/NOTCH1/TCF7L2/ITGB1/IL18/MBNL1/XKR8/MAML1/RANBP3L/SHH/HIF1AN/BRD7/RBPJ/KAT5/DDIT3/PLEC/PLCB1/ZFP36L1/BCL9L/ARID2/MAP3K5/TNF/TNF/NRAS/TNF/TNF/TNF/TNF/TNF/TNF/SMARCB1 | 53 |
| GO:0060907 | positive regulation of macrophage cytokine production | 25/3662 | 33/15509 | 3.59414e-10 | 9.20515e-09 | 5.53581e-09 | CD74/P2RX7/PYCARD/LILRB1/NOD1/WNT5A/CD36/TLR4/MAPKAPK2/TLR3/NOD2/CARD9/TLR7/HLA-G/HLA-G/HLA-G/HLA-G/HLA-G/HLA-G/HLA-G/LILRB1/HLA-G/LILRB1/LILRB1/LILRB1 | 25 |
| GO:0045589 | regulation of regulatory T cell differentiation | 31/3662 | 46/15509 | 3.61223e-10 | 9.21342e-09 | 5.54079e-09 | FOXP3/MDK/IFNG/BCL6/FOXO3/DUSP10/IL2RG/CTLA4/LGALS9/KAT5/CD28/KLHL25/SOCS1/LILRB4/CR1/HLA-G/HLA-DRA/HLA-G/HLA-DRA/HLA-DRA/HLA-G/HLA-G/HLA-DRA/HLA-G/HLA-G/HLA-G/LILRB4/HLA-G/HLA-DRA/LILRB4/LILRB4 | 31 |
| GO:0002544 | chronic inflammatory response | 24/3662 | 31/15509 | 3.75111e-10 | 9.52844e-09 | 5.73024e-09 | FOXP3/IL4/TNFAIP3/IL10/THBS1/CYP19A1/CXCL13/VCAM1/CCL11/TNF/TNF/LTA/TNF/LTA/TNF/TNF/TNF/TNF/LTA/LTA/TNF/LTA/CCL5/CCL5 | 24 |
| GO:0006959 | humoral immune response | 102/3662 | 247/15509 | 4.20731e-10 | 1.06436e-08 | 6.40089e-09 | LTF/SLC11A1/POU2F2/TFE3/FCGR2B/ST6GAL1/PTPRC/CD59/LYZ/CTSG/IL7/FCER2/GPI/GATA3/C1QBP/CCL2/HPX/CD81/POU2AF1/IFNG/IL17A/GNLY/CFHR3/CLU/SEMG1/H2BC11/IL1B/C3/CCR7/FOXJ1/SFTPD/NOTCH2/IL6/TNFRSF21/NOTCH1/CXCL13/MS4A1/PF4/MBL2/NOD2/RBPJ/CXCL8/FGA/A2M/CD28/HLA-DQB1/F2/H2BC21/ZP3/CD55/PRTN3/ELANE/IFNA1/HMGN2/RPL39/CR1/TNF/HLA-E/PSMB10/HLA-DQB1/HLA-DQB1/TNF/HLA-E/HLA-A/HLA-A/LTA/TNF/HLA-A/HLA-A/HLA-E/HLA-DQB1/LTA/HLA-A/TNF/TNF/TNF/HLA-A/HLA-E/TNF/HLA-E/LTA/HLA-DQB1/LTA/HLA-A/HLA-DQB1/TNF/HLA-DQB1/HLA-E/HLA-A/HLA-E/LTA/CFB/CFB/CFB/CFB/CFB/PTPRC/H2BC6/H2BC7/ELANE/PRTN3/GPI | 102 |
| GO:1901652 | response to peptide | 165/3662 | 454/15509 | 4.27532e-10 | 1.07717e-08 | 6.47792e-09 | CRY1/IGF1/CPS1/CASR/CYBA/KCNQ1/F7/NGFR/PKM/ROCK1/FCGR2B/ACTN2/OPRK1/GSK3B/RAB10/CHMP5/MMP2/PXN/NUDC/ICAM1/CDC6/XBP1/RANGAP1/APEX1/PCK2/NFKBIA/MMP9/BMP7/TSC2/ABCC1/CSK/PLAT/SLC39A14/KLF1/JAK3/GSK3A/NOD1/CXCL12/RPS6KB1/AREG/MAPK14/CCND3/KAT2B/NCL/ITGA4/STAT1/SRSF4/SLC2A1/TNFAIP3/ARG1/FOXO3/NR4A3/EIF2B2/CRHR1/EGR1/CRY2/CAT/TNFSF10/INHBA/EGR2/NR4A1/LRP1/NCOA5/IL1B/MAX/ID1/STAT5A/IRF5/BCL2L2/CDO1/GDF15/ASS1/SESN2/PRKAA1/LPIN3/EPHB2/MEN1/PTPN22/APC/CD36/EDNRB/IL10/TLR4/SORL1/KHK/CYP1B1/RB1/IGF1R/MEAK7/TNFRSF11A/APP/RAB13/PKLR/PARP1/CCNA2/PIK3R1/OGT/NOTCH1/EIF4EBP2/SESN3/SOGA1/FOXO1/POU4F2/GJA1/BCL2L11/NR4A2/APPL1/ADIPOR1/BTG2/SHC1/JAK1/SCNN1D/VCAM1/INHBB/PRKCD/GPER1/CDK5/CYBB/ZNF592/SLC27A4/NOD2/AHCYL1/ADRB2/PTK2/FOS/SLC25A33/KLF11/BSG/RELA/ESRRA/DAG1/STAT5B/LEP/PTPN2/LPL/GRB2/ERFE/PTPN11/OXTR/ADIPOQ/PLCB1/FOXO4/SOCS1/ZFP36L1/CARD9/TRPV1/SRC/MTOR/TNF/TNF/TNF/TNF/TNF/TNF/TNF/TNF/EIF6/PRKDC/ITGB3/GH1/PKLR/PIP4K2B/NEFL/ABCC1/LRP6 | 165 |
| GO:0060284 | regulation of cell development | 174/3662 | 485/15509 | 4.55042e-10 | 1.14184e-08 | 6.86683e-09 | BAD/KDM1A/HOXA11/TMEM98/IFRD1/PAFAH1B1/TYROBP/LTF/UFL1/IGF1/TNFRSF1B/GRN/CDH1/NTN1/KDM4A/ROCK1/SIRT2/CDC42/PLXNA2/FBLN1/PCM1/TP73/XRCC5/LRP2/GSK3B/ADD1/ABL1/ADNP/BMP7/SMAD7/OLFM4/LILRB1/TGFB1/GSK3A/PTN/EZH2/CXCL12/BMPR1A/WNT3/C1QBP/EFNB3/MDK/CORO1C/IFNG/NEDD9/IL5/DBN1/WNT5A/HES1/IL1A/FN1/ID2/HDAC1/MPL/SPP1/CXCR4/RECK/EGR2/OBSL1/IL1B/NKX2-2/BMP2/ID1/NR1D1/YWHAH/LIF/PER2/EPHB2/KRAS/BHLHE40/NOTCH2/NGF/LRP4/SERPINE2/EDNRB/IL6/DBNL/KIAA0319/SORL1/ACTR2/FGF2/RB1/SMAD4/CRABP2/DUSP10/HES6/CTDSP1/SLIT2/NTRK2/NOTCH1/ITGB1/VEGFC/POU4F2/POU4F1/NODAL/KIT/DPYSL5/SKI/FAIM/DMTN/TBC1D24/DISC1/FRZB/HEYL/MELTF/SLC9B2/SHH/GPER1/CDK5/CX3CR1/SEMA4C/RGS14/LIMS1/SEMA3E/LPAR3/MAP6/FGG/FGA/CCL11/PDE3A/DAG1/LIG4/ZDHHC21/BDNF/RCC2/CALR/CDH4/F2/ADIPOQ/PLAG1/PLCB1/ANXA2/RFLNB/NOG/SS18L1/CIB1/NF2/DCC/SPRY4/MME/TRPV1/SYNGAP1/MBP/MTOR/GPRASP3/TGM2/GDI1/TNF/TNF/LTA/TNF/LTA/TNF/TNF/TNF/TNF/LTA/LTA/TNF/LTA/TWF2/SHANK3/PRKDC/CUX1/ITGB3/B2M/LILRB1/LILRB1/LILRB1/NEFL/WNT3/WNT3/LILRB1/PTEN | 174 |
| GO:0034101 | erythrocyte homeostasis | 62/3662 | 127/15509 | 4.78794e-10 | 1.1966e-08 | 7.19613e-09 | SLC4A1/KMT2E/UFL1/ALAS1/KCNQ1/HIPK2/SPI1/ACIN1/GATA1/ERCC2/GPI/KLF1/JAK3/HOXA5/GATA3/HOXB6/SLC11A2/SH2B3/MAPK14/RHAG/HSPA9/SMAD5/BCL6/STAT1/ID2/EPAS1/PRDX1/MYB/FOXO3/PTBP3/INHBA/THRA/PRMT1/ZFP36/EPO/ABCB10/IREB2/RB1/ARNT/DYRK3/NCAPG2/KIT/ALAS2/DMTN/TAL1/BAP1/CASP3/SFXN1/EPB42/INPP5D/AHSP/STAT5B/PTPN2/RPS17/ZFP36L1/CDIN1/L3MBTL3/MAFB/PRKDC/B2M/INPP5D/GPI | 62 |
| GO:0050727 | regulation of inflammatory response | 137/3662 | 361/15509 | 5.12881e-10 | 1.27664e-08 | 7.6775e-09 | SELE/BTK/UFL1/IGF1/HGF/BIRC3/TNFRSF1B/GRN/FOXP3/KARS1/HYAL2/VPS35/FCGR2B/MKRN2/PTPRC/ESR1/OSM/PSMA6/NFKBIA/MMP9/HCK/ACP5/SETD6/ABCC1/MEFV/PYCARD/HAMP/PIK3CG/SERPINE1/AKNA/GATA3/CTSC/MDK/CD81/MVK/IFNG/PPARD/MAPK14/IL12B/IL4/BCL6/WNT5A/SNX4/PARK7/ASH1L/TNFAIP3/VAMP8/AREL1/TEK/IL1B/C3/CCR7/NR1D1/IRF3/ZFP36/APOE/NDFIP1/SYT11/IL2RA/DAGLA/NT5E/EDNRB/IL6/IL10/TLR4/CCN3/CYP19A1/IL21/RB1/FURIN/TNFRSF11A/SOD1/APP/DUSP10/PLK2/IL18/NDUFC2/PSMB4/NLRX1/ALOX15/CAMK2N1/BAP1/PRKCD/RICTOR/TLR3/GPER1/SYK/NOD2/GPX4/CEBPB/IL16/RELA/STAT5B/PTPN2/LPL/CD28/LACC1/ADIPOQ/ZP3/CNR2/TLR7/CD47/SRC/SHPK/ELANE/TNF/HLA-E/TMSB4X/TNF/HLA-E/LTA/TNF/HLA-E/LTA/TNF/TNF/TNF/HLA-E/TNF/HLA-E/LTA/LTA/TNF/HLA-E/HLA-E/LTA/NEAT1/CEBPA/NAIP/PTPRC/CCL5/CCL5/NAIP/ELANE/ABCC1/NAIP/GGT1 | 137 |
| GO:0034248 | regulation of cellular amide metabolic process | 149/3662 | 401/15509 | 5.17008e-10 | 1.28177e-08 | 7.70831e-09 | UPF1/IGF1/EIF2AK2/PUM2/EIF4B/ELAVL1/PKM/RHOA/ROCK1/PDK3/ELP1/PICALM/MLH1/MKNK1/DDX1/BZW1/TUT7/TMED2/PPP1R15A/MAPKAPK5/GCN1/AARS1/AGO1/CIRBP/MKNK2/GZMB/PCIF1/GSK3A/MTPN/HSPB1/EIF3B/EIF4H/EXOSC3/LARP4B/CASC3/RPS6KB1/C1QBP/DPH1/EIF4G2/DDX6/IFNG/XRN1/EIF1B/NCL/PASK/DPH5/FOXO3/EIF2B2/MTRF1/PAIP2/SERP1/CLU/PTK2B/TARDBP/ORMDL2/SOX4/CNOT1/TRAP1/PIN1/ZFP36/APOE/SESN2/RARA/PER2/PRKAA1/RTN3/ELP2/NIBAN1/EIF4E2/IL6/BZW2/IREB2/NCBP1/SORL1/THBS1/CYP1B1/LARP1B/TARBP2/RTN1/TOB1/EIF4A3/GRB7/APP/CCN1/POLR2D/CNOT9/EIF3H/NTRK2/EIF4EBP2/MTG1/SLC2A13/CDC123/GUF1/ZFP36L2/RMND1/USP16/EIF4A2/CNOT11/PPP1R15B/BTG2/ZNF385A/RPL26/PRKCD/CASP3/RPUSD4/NOD2/EFNA1/PTAFR/ELP5/PA2G4/PGAM1/ENC1/ORMDL3/EIF2AK3/PAIP1/DCP2/RELA/EIF1/PDE12/TYMS/SHMT1/CD28/CALR/TRNAU1AP/NPM1/KLHL25/EIF3C/ZFP36L1/YTHDF3/SECISBP2/DAPK1/MTOR/SELENOT/GIGYF2/TNF/SARNP/TNF/TNF/TNF/TNF/TNF/TNF/TNF/EIF6/PRKDC/LSM14A/RBM8A/CCL5/CCL5 | 149 |
| GO:0002263 | cell activation involved in immune response | 107/3662 | 264/15509 | 5.74075e-10 | 1.40637e-08 | 8.45767e-09 | ITGAL/TMEM98/ST3GAL1/BTK/TYROBP/SLC11A1/CD74/GRN/GAB2/PARP3/C12orf4/FOXP3/KARS1/SPI1/FCGR2B/TBX21/MLH1/STXBP2/IL4R/PTPRC/LAT2/ICAM1/MSH2/IL12RB1/ABL1/XBP1/CD40/SMAD7/GATA1/CD40LG/PYCARD/NBN/LILRB1/IL27RA/TGFB1/JAK3/PIK3CG/EXOSC3/GATA3/NSD2/MDK/CD81/POU2AF1/IFNG/AICDA/IL12B/IL4/BCL6/CD86/SNX4/MYB/VAMP8/NR4A3/PTK2B/CD80/CD244/SHLD2/LRP1/RAC2/NDFIP1/RARA/NOTCH2/LCP1/IL6/HLX/IL10/STXBP1/TLR4/IRF4/IL21/SLC15A4/IRF8/APP/CPLX2/IL18/KIT/CD1C/ITGB2/IL6R/TNFSF13/SYK/CX3CR1/LGALS9/PTAFR/ITGAM/PRKCE/CCL19/LIG4/RAG2/CD19/CD28/HMGB1/IFNA1/ENTPD7/MTOR/CR1/CD177/HLA-DRA/HLA-DRA/HLA-DRA/HLA-DRA/PTPRC/LILRB1/LILRB1/LILRB1/HLA-DRA/LILRB1 | 107 |
| GO:0002429 | immune response-activating cell surface receptor signaling pathway | 107/3662 | 264/15509 | 5.74075e-10 | 1.40637e-08 | 8.45767e-09 | CD38/CD79B/BTK/TYROBP/CD22/BTN3A1/FOXP3/FCGR2B/PTPRC/LAT2/BAX/SPG21/BAG6/ABL1/NFATC2/HCK/CSK/KCNN4/PRKD2/CD79A/GATA3/LPXN/CD81/PDE4D/ZAP70/CD160/NR4A3/EIF2B2/RBCK1/CCR7/NECTIN2/PTPN22/CMTM3/TNFRSF21/CD8A/MS4A1/APPL1/SPPL3/ICOSLG/CTLA4/PRKCD/SYK/MBL2/BTNL9/INPP5D/PTK2/PRKCE/RELA/HRAS/PTPN2/CD19/CD28/HLA-DQB1/PAK2/CACNB4/PDE4B/BTN3A2/LILRB4/PLSCR1/CD47/SRC/CR1/BAG6/HLA-DQB1/HLA-DQB1/MICB/HLA-A/HLA-A/HLA-DPB1/NCR3/HLA-DPB1/HLA-A/HLA-A/MICB/NCR3/HLA-DQB1/HLA-DPB1/HLA-A/MICB/BAG6/HLA-A/HLA-DPB1/BAG6/HLA-DPB1/HLA-DPB1/MICB/HLA-DQB1/MICB/HLA-A/HLA-DQB1/HLA-DQB1/BAG6/BAG6/HLA-A/NCR3/HLA-DPB1/NCR3/NCR3/HLA-DPB1/NCR3/MICB/PTPRC/IKBKG/LILRB4/LILRB4/LILRB4/INPP5D | 107 |
| GO:0002757 | immune response-activating signal transduction | 107/3662 | 264/15509 | 5.74075e-10 | 1.40637e-08 | 8.45767e-09 | CD38/CD79B/BTK/TYROBP/CD22/BTN3A1/FOXP3/FCGR2B/PTPRC/LAT2/BAX/SPG21/BAG6/ABL1/NFATC2/HCK/CSK/KCNN4/PRKD2/CD79A/GATA3/LPXN/CD81/PDE4D/ZAP70/CD160/NR4A3/EIF2B2/RBCK1/CCR7/NECTIN2/PTPN22/CMTM3/TNFRSF21/CD8A/MS4A1/APPL1/SPPL3/ICOSLG/CTLA4/PRKCD/SYK/MBL2/BTNL9/INPP5D/PTK2/PRKCE/RELA/HRAS/PTPN2/CD19/CD28/HLA-DQB1/PAK2/CACNB4/PDE4B/BTN3A2/LILRB4/PLSCR1/CD47/SRC/CR1/BAG6/HLA-DQB1/HLA-DQB1/MICB/HLA-A/HLA-A/HLA-DPB1/NCR3/HLA-DPB1/HLA-A/HLA-A/MICB/NCR3/HLA-DQB1/HLA-DPB1/HLA-A/MICB/BAG6/HLA-A/HLA-DPB1/BAG6/HLA-DPB1/HLA-DPB1/MICB/HLA-DQB1/MICB/HLA-A/HLA-DQB1/HLA-DQB1/BAG6/BAG6/HLA-A/NCR3/HLA-DPB1/NCR3/NCR3/HLA-DPB1/NCR3/MICB/PTPRC/IKBKG/LILRB4/LILRB4/LILRB4/INPP5D | 107 |
| GO:0002925 | positive regulation of humoral immune response mediated by circulating immunoglobulin | 18/3662 | 20/15509 | 5.7861e-10 | 1.4119e-08 | 8.49091e-09 | PTPRC/FCER2/HPX/NOD2/TNF/TNF/LTA/TNF/LTA/TNF/TNF/TNF/TNF/LTA/LTA/TNF/LTA/PTPRC | 18 |
| GO:0051402 | neuron apoptotic process | 98/3662 | 236/15509 | 6.44751e-10 | 1.56712e-08 | 9.42441e-09 | TYROBP/FAS/GRN/HSPA5/NGFR/HIPK2/ERBB3/MAP2K4/RHOA/ROCK1/TP63/BAX/KDM2B/AARS1/MSH2/HSP90AB1/ABL1/MYBL2/ADNP/IL27RA/GPI/GSK3A/CASP2/GATA3/UNC5B/CCL2/ZPR1/CCND1/MDK/PARK7/FASLG/FOXO3/PTK2B/CNTFR/TMTC4/MAX/KDR/APOE/KRAS/NGF/SRPK2/IL10/STXBP1/TFAP2A/MAP3K12/TMBIM6/RB1/ARRB2/SOD1/APP/PARP1/TNFRSF21/NONO/NTRK2/THRB/POU4F1/BCL2L11/NR4A2/BTG2/CASP3/TERT/FOXQ1/CDK5/NSMF/FADD/CX3CR1/ITGAM/SEMA3E/BCL2L1/CEBPB/LIG4/HRAS/DDIT3/BDNF/CDK5R1/JUN/NQO1/F2R/PRKN/CLN3/FZD9/SYNGAP1/NTRK1/GPRASP3/TNF/AKT1S1/TNF/TNF/TNF/TNF/TNF/TNF/TNF/NAIP/NAIP/NEFL/NAIP/GPI | 98 |
| GO:0031667 | response to nutrient levels | 159/3662 | 436/15509 | 6.69743e-10 | 1.62151e-08 | 9.75148e-09 | MPO/PON1/HFE/SNAI2/CPS1/RRAGD/FAS/CASR/CLEC16A/HSPA5/CYBA/EIF2AK2/F7/KDM4A/SIRT2/NUCB2/ASNS/MBD3/OXCT1/SEH1L/BAX/GCN1/COMT/SH3GLB1/XBP1/PCK2/BMP7/NPRL3/SFRP1/HAMP/USF2/MAPK8/RPS6KB1/RNF167/HSPA8/CCND1/FOLR1/CYP27B1/VDR/PPARD/MAPK14/IL1A/STAT1/IGFBP2/ELAPOR1/SLC2A1/NENF/ARG1/FOXO3/SPP1/DNMT3A/TRIM25/CAT/TRIM24/SIRT5/CDKN1A/RUNX2/MAX/BECN1/ATG14/ZFP36/ALDH1A2/CD68/APOE/EPO/GDF15/ASS1/SESN2/RARA/PRKAA1/MYBBP1A/HNRNPA1/GLUL/TTC5/SORL1/CYP1B1/GABARAPL1/BNIP2/IGF1R/BBS4/CYP1A1/MEAK7/TNFRSF11A/PMAIP1/SOD1/ENSA/PKLR/OGT/ALAD/ZEB1/SESN3/FOXO1/KLF10/WIPI2/STC1/BRSK1/WNT4/OMA1/VCAM1/ATF3/INHBB/TGFBR2/ALB/RICTOR/TNFRSF11B/CYBB/AQP3/ZFYVE1/SLC27A4/NOD2/MN1/ADRB2/FOS/MGMT/PPM1D/EIF2AK3/KAT5/BRSK2/LEP/DDIT3/LPL/A2M/TYMS/PLEC/RMI1/SSTR2/NQO1/ADIPOQ/SLC8A1/CNTN2/FOXO4/GAS2L1/PRR5/AKR1C3/TRPV1/SRC/KANK2/MAP3K5/ATG7/NTRK1/F5/MTOR/TNF/TNF/LTA/TNF/LTA/TNF/TNF/TNF/TNF/LTA/LTA/TNF/LTA/ADSL/GH1/PKLR/LOC102724560 | 159 |
| GO:0046641 | positive regulation of alpha-beta T cell proliferation | 27/3662 | 38/15509 | 7.92718e-10 | 1.91178e-08 | 1.14971e-08 | PTPRC/CD81/IL12B/ZAP70/PTPN22/IL18/TGFBR2/SYK/LGALS9/CD28/CD55/HLA-E/HLA-E/HLA-A/HLA-A/HLA-A/HLA-A/HLA-E/HLA-A/HLA-A/HLA-E/HLA-E/HLA-A/HLA-E/HLA-A/HLA-E/PTPRC | 27 |
| GO:0002253 | activation of immune response | 130/3662 | 340/15509 | 8.12721e-10 | 1.95242e-08 | 1.17415e-08 | CD38/CD79B/BTK/TYROBP/CD22/BTN3A1/FOXP3/FCGR2B/XRCC5/PTPRC/CD59/LAT2/BAX/MAVS/SPG21/BAG6/ABL1/NFATC2/HCK/PYCARD/CSK/KCNN4/PRKD2/CD79A/GATA3/C1QBP/LPXN/CD81/PDE4D/ZAP70/CFHR3/CD160/NR4A3/EIF2B2/CLU/IL1B/C3/RBCK1/CCR7/NECTIN2/TRIM5/PTPN22/TLR4/CMTM3/TNFRSF21/NONO/CD8A/MS4A1/APPL1/SPPL3/ICOSLG/CTLA4/PRKCD/SYK/MBL2/BTNL9/NOD2/INPP5D/PTK2/PRKCE/RELA/HRAS/PTPN2/A2M/CD19/CD28/HLA-DQB1/PAK2/CACNB4/PDE4B/BTN3A2/LILRB4/HEXIM1/PLSCR1/HMGB1/CD55/CD47/SRC/CR1/BAG6/HLA-DQB1/HLA-DQB1/MICB/HLA-A/HLA-A/HLA-DPB1/NCR3/HLA-DPB1/HLA-A/HLA-A/MICB/NCR3/HLA-DQB1/HLA-DPB1/HLA-A/MICB/BAG6/HLA-A/HLA-DPB1/BAG6/HLA-DPB1/HLA-DPB1/MICB/HLA-DQB1/MICB/HLA-A/HLA-DQB1/HLA-DQB1/BAG6/BAG6/HLA-A/NCR3/HLA-DPB1/NCR3/NCR3/HLA-DPB1/NCR3/MICB/CFB/CFB/CFB/CFB/CFB/PRKDC/PTPRC/IKBKG/LILRB4/LILRB4/LILRB4/INPP5D | 130 |
| GO:0050864 | regulation of B cell activation | 65/3662 | 137/15509 | 8.33574e-10 | 1.99478e-08 | 1.19963e-08 | BAD/CD38/BTK/TYROBP/CD22/CD74/HMGB3/PARP3/FOXP3/FCGR2B/TBX21/MLH1/PTPRC/MSH2/XBP1/CD40/NFATC2/SFRP1/IL7/IL27RA/TGFB1/AHR/EXOSC3/NSD2/CD81/IL4/IL5/BCL6/ID2/TNFAIP3/SHLD2/INHBA/PKN1/CDKN1A/FOXJ1/NDFIP1/EPHB2/AKIRIN2/IL6/IL10/TLR4/IL21/SLC15A4/TNFRSF21/IL2RG/ZFP36L2/MMP14/TNFRSF13C/TNFSF13/CTLA4/CASP3/SYK/NOD2/TNIP2/INPP5D/STAT5B/CD19/CD28/ZFP36L1/CR1/TNFRSF13B/PTPRC/MIF/INPP5D/PTEN | 65 |
| GO:0007346 | regulation of mitotic cell cycle | 157/3662 | 431/15509 | 9.42027e-10 | 2.24565e-08 | 1.35049e-08 | CDC27/KMT2E/PAFAH1B1/IGF1/FHL1/YTHDC2/ARID1B/SIRT2/ASNS/CDC42/ACTB/TP73/NDC80/ZMPSTE24/ZW10/ANAPC5/BIRC5/ZNF268/PSME1/CDC6/MSH2/ABL1/CDC7/BCL7C/SMARCB1/TTC28/PDGFB/APEX1/BMP7/CDC25B/RBBP8/RAB11A/NBN/ERCC2/CASP2/EZH2/RPS6KB1/SMARCD2/CCL2/CCND1/BCL7A/FBXO5/SMOC2/CCND3/CUL9/CCNG1/RAD50/PPP2CA/PDGFRB/BCL6/HES1/TTL/IL1A/ID2/CDC20/ARID1A/PKD2/TEX14/INHBA/OBSL1/CDKN1A/IL1B/HSPA2/PIN1/PKMYT1/CDKN1C/PSME3/BTG1/CCNB1/CCNH/CDCA8/APC/BORA/IL10/TMEM8B/RDX/NUSAP1/CENPE/EGF/NABP2/BRCA2/RB1/CUL4A/CYP1A1/APP/DTL/INTS3/CTDSP1/PLK2/EGFR/MKI67/SPC25/ZFP36L2/PRKCA/ADAMTS1/XPC/EME1/LSM11/APPL1/CUL4B/BTG2/PRMT2/BRSK1/MRNIP/DBF4B/RPL26/TAL1/ERCC3/TERT/BRD7/WEE1/RRM1/RFWD3/BUB1/AVEN/CDK1/TRIAP1/RRM2/CKS1B/NABP1/STAT5B/ZWILCH/ANGEL2/CTDSP2/AURKAIP1/CD28/AURKB/RCC2/PTPN11/CACNB4/PLCB1/CHEK2/FOXO4/CDK10/MUC1/PBX1/ZFP36L1/ASAH2/ARID2/KANK2/TFDP1/PIM3/GIGYF2/TNF/TNF/TNF/TNF/TNF/TNF/TNF/TNF/PDXP/PRKDC/CDKN1C/AATF/SMARCB1/PTEN | 157 |
| GO:0045639 | positive regulation of myeloid cell differentiation | 51/3662 | 98/15509 | 9.61737e-10 | 2.28385e-08 | 1.37347e-08 | SCIN/CD4/TYROBP/CD74/ACIN1/GATA1/TGFB1/HOXA5/CSF3/IFNG/NEDD9/MAPK14/IL17A/IL12B/IL5/STAT1/ID2/MPL/FOXO3/INHBA/PRMT1/LIF/NOTCH2/ABCB10/RB1/ARNT/POU4F2/POU4F1/PRKCA/KLF10/RUNX1/TAL1/PF4/SLC9B2/FADD/INPP5D/FOS/STAT5B/CTNNBIP1/CSF1/ZFP36L1/TNF/TNF/TNF/TNF/TNF/TNF/TNF/TNF/PRKDC/INPP5D | 51 |
| GO:0001503 | ossification | 143/3662 | 384/15509 | 9.7012e-10 | 2.29496e-08 | 1.38015e-08 | MRC2/LTF/UFL1/IGF1/SNAI2/HGF/RUNX3/CASR/FGFR2/RHOA/CBFB/FGFR3/PRKACA/TP63/GLI2/GSK3B/ZMPSTE24/TXLNG/ACHE/MMP2/P2RX7/HNRNPC/MMP9/BMP7/RASSF2/SMAD7/GATA1/XYLT1/SFRP1/ERCC2/FBL/TGFB1/CLEC11A/PTN/BMPR1A/KAZALD1/DKK1/WNT3/CCDC47/DDX5/MAP2K6/AREG/ZBTB16/MDK/CALCA/CYP27B1/VDR/FBXO5/MAPK14/PEX7/SMAD5/WNT5A/HSPE1/FHL2/SPP1/PTK2B/CAT/SRGN/EGR2/RUNX2/RRBP1/BMP2/THRA/SBDS/TWSG1/MYBBP1A/HSD17B4/MEN1/LRP4/IL6/ADAMTS7/TFAP2A/ITGA11/SMAD6/FGF2/FBN2/COL2A1/TOB1/SMAD4/TNFRSF11A/EPHA2/CCN1/EGFR/IGFBP3/RBMX/NOTCH1/VEGFC/CRIM1/BMP6/KLF10/SLC26A2/MMP14/SKI/STC1/RUNX1/IL6R/PSMC2/ALOX15/WNT4/H3-3A/RANBP3L/SHH/TPM4/RBPJ/BMP1/MN1/ADRB2/PTK2/RIOX1/S1PR1/EIF2AK3/CEBPB/ESRRA/LEP/FAM20C/CTNNBIP1/PTPN11/SLC8A1/RFLNB/NOG/CSF1/NOTUM/PBX1/IFITM1/WNT7B/FZD9/COL13A1/RXRB/TNF/TNF/CEBPD/TNF/TNF/TNF/TNF/TNF/TNF/CEBPA/LOC102724560/CRIM1/WNT3/WNT3/PRKACA | 143 |
| GO:0032677 | regulation of interleukin-8 production | 45/3662 | 82/15509 | 9.885e-10 | 2.32955e-08 | 1.40095e-08 | CD74/HYAL2/PTPRC/MAVS/TLR8/PYCARD/PRKD2/CD33/NOD1/SERPINE1/WNT5A/PARK7/CD244/IL1B/CHI3L1/PTPN22/IL6/IL10/TLR4/TLR3/SYK/NOD2/FADD/LGALS9/CD14/RELA/LEP/DDIT3/ADIPOQ/F2R/HMGB1/TLR7/ELANE/TNF/TMSB4X/TNF/ZNF580/TNF/TNF/TNF/TNF/TNF/TNF/PTPRC/ELANE | 45 |
| GO:1904646 | cellular response to amyloid-beta | 30/3662 | 45/15509 | 1.04194e-09 | 2.44618e-08 | 1.47109e-08 | IGF1/NGFR/FCGR2B/GSK3B/ICAM1/ABCC1/ITGA4/FOXO3/LRP1/BCL2L2/EPHB2/CD36/TLR4/IGF1R/APP/PARP1/GJA1/BCL2L11/VCAM1/CDK5/ADRB2/TNF/TNF/TNF/TNF/TNF/TNF/TNF/TNF/ABCC1 | 30 |
| GO:0002676 | regulation of chronic inflammatory response | 20/3662 | 24/15509 | 1.0761e-09 | 2.51685e-08 | 1.51359e-08 | FOXP3/IL4/TNFAIP3/IL10/CYP19A1/TNF/TNF/LTA/TNF/LTA/TNF/TNF/TNF/TNF/LTA/LTA/TNF/LTA/CCL5/CCL5 | 20 |
| GO:0042742 | defense response to bacterium | 109/3662 | 273/15509 | 1.10961e-09 | 2.58547e-08 | 1.55486e-08 | MPO/CD4/LTF/SLC11A1/GRN/CYBA/SIRT2/GSDMB/ARG2/SEH1L/MAVS/P2RX7/LYZ/MARCHF2/CTSG/ACP5/PYCARD/IL27RA/HAMP/NOD1/SERPINE1/TNFSF8/AICDA/IL17A/IL12B/CCL20/GNLY/CD160/SEMG1/H2BC11/IL1B/RBCK1/RNASE1/SYT11/SFTPD/NOTCH2/CD36/AKIRIN2/IL6/IL10/TLR4/IRF8/EPHA2/LYST/LCN2/IL18/MR1/CXCL13/SHC1/IL6R/PRKCD/TLR3/SYK/MBL2/NOD2/RBPJ/FGA/CEBPB/RNF213/SELP/RAG2/F2/ADGRB1/MICA/H2BC21/PRG2/CARD9/ELANE/RPL39/TNF/HLA-E/PPP1R11/TNF/HLA-E/HLA-A/HLA-A/LTA/TNF/HLA-A/HLA-A/HLA-E/LTA/HLA-A/TNF/TNF/TNF/HLA-A/HLA-E/TNF/HLA-E/LTA/MICA/LTA/HLA-A/TNF/MICA/HLA-E/MICA/HLA-A/HLA-E/LTA/NAIP/HP/RNASE4/H2BC6/NAIP/H2BC7/ELANE/NAIP | 109 |
| GO:0060326 | cell chemotaxis | 113/3662 | 286/15509 | 1.14192e-09 | 2.6508e-08 | 1.59414e-08 | CD74/HGF/F7/SPI1/FGFR1/MMP2/DNM1L/PDGFB/CTSG/FLT1/CCL22/CCL17/ABCC1/PRKD2/PIK3CG/PTN/MET/HSPB1/SERPINE1/CREB3/CXCL12/C1QBP/CCL2/MDK/CALCA/NEDD9/SMOC2/HBEGF/IL4/PDGFRB/WNT5A/CCL20/PADI2/CSF3R/PGF/PTK2B/CXCR4/NR4A1/NUP85/IL1B/CCR7/SBDS/KDR/RAC2/MTUS1/SFTPD/PDGFRA/EDNRB/IL6/IL10/CCN3/CCL21/THBS1/CYP19A1/FGF2/ARRB2/TNFRSF11A/EPHA2/RAB13/LYST/SLIT2/TPBG/NOTCH1/VEGFC/CXCL13/KIT/ITGB2/CXCR5/IL6R/CCR5/VCAM1/CXCR1/PF4/PRKCD/SYK/NOD2/CX3CR1/LGALS9/PTK2/CXCL8/S1PR1/SCG2/CCL11/BSG/IL16/CCL19/CYP7B1/CCR9/PLEC/CALR/CXCR2/CSF1R/CCR4/CSF1/PDE4B/CXCR3/CNR2/HMGB1/PPIA/DPP4/PARVA/TMSB4X/ZNF580/CCL5/CCL5/CCL4/CCL18/CCL4/MIF/CCL4/CCL18/CCL18/ABCC1 | 113 |
| GO:0002477 | antigen processing and presentation of exogenous peptide antigen via MHC class Ib | 16/3662 | 17/15509 | 1.20497e-09 | 2.77636e-08 | 1.66965e-08 | TAP2/HLA-E/TAP2/TAP2/HLA-E/TAP2/HLA-E/TAP2/TAP2/HLA-E/HLA-E/TAP2/HLA-E/HLA-E/TAP2/B2M | 16 |
| GO:2000566 | positive regulation of CD8-positive, alpha-beta T cell proliferation | 16/3662 | 17/15509 | 1.20497e-09 | 2.77636e-08 | 1.66965e-08 | PTPN22/HLA-E/HLA-E/HLA-A/HLA-A/HLA-A/HLA-A/HLA-E/HLA-A/HLA-A/HLA-E/HLA-E/HLA-A/HLA-E/HLA-A/HLA-E | 16 |
| GO:2001198 | regulation of dendritic cell differentiation | 22/3662 | 28/15509 | 1.263e-09 | 2.89929e-08 | 1.74358e-08 | FCGR2B/LILRB1/LGALS9/CEBPB/HMGB1/HLA-G/HLA-B/HLA-G/HLA-B/HLA-B/HLA-B/HLA-G/HLA-B/HLA-G/HLA-G/HLA-G/HLA-G/LILRB1/HLA-G/LILRB1/LILRB1/LILRB1 | 22 |
| GO:0035967 | cellular response to topologically incorrect protein | 59/3662 | 121/15509 | 1.32779e-09 | 3.03676e-08 | 1.82626e-08 | MBTPS2/UFL1/BAK1/HSPA5/HERPUD1/EIF2AK2/ATXN3/DERL2/TMED2/PPP1R15A/BAX/BAG6/XBP1/UGGT2/BFAR/CREB3/TMEM33/HSPA8/CCND1/PACRG/HSPA9/SERP1/TMTC4/HSPA2/AKIRIN2/ABCB10/DERL1/TMBIM6/PIK3R1/DNAJB12/BAG3/HSPB8/BCL2L11/PPP1R15B/ATF3/VCP/EIF2AK3/DDIT3/PTPN2/ERN1/YOD1/CREB3L2/PRKN/RNF5/HSPA1L/BAG6/DAXX/DAXX/HSPA1L/HSPA1L/DAXX/BAG6/DAXX/BAG6/DAXX/BAG6/HSPA1L/BAG6/HSPA1L | 59 |
| GO:0008630 | intrinsic apoptotic signaling pathway in response to DNA damage | 54/3662 | 107/15509 | 1.3523e-09 | 3.08145e-08 | 1.85313e-08 | BAD/KDM1A/SNAI2/CD74/CD44/TNFRSF1B/BAK1/USP28/FNIP2/HIPK2/TMEM161A/TP63/MLH1/TP73/BAX/MSH2/BAG6/ABL1/PYCARD/CASP2/CXCL12/CLU/CDKN1A/DYRK2/BCL2L2/BCL2L10/BRCA2/BCL2A1/EPHA2/PIK3R1/BCL2L11/ZNF385A/RPL26/SHISA5/DDIT4/TRIAP1/BCL2L1/CHEK2/MUC1/BAG6/TNF/TNF/TNF/TNF/BAG6/TNF/TNF/BAG6/TNF/TNF/BAG6/BAG6/PRKDC/MIF | 54 |
| GO:0010631 | epithelial cell migration | 113/3662 | 287/15509 | 1.45142e-09 | 3.29519e-08 | 1.98167e-08 | ITGA3/DCN/SNAI2/GRN/FLT4/ATP2B4/SP100/RHOA/ROCK1/FGFR1/PXN/APOH/ANGPT2/ABL1/PDGFB/MYH9/MMP9/CD40/FERMT1/RAB11A/GPI/PRKD2/TGFB1/PIK3CG/PTN/MET/HSPB1/TGFBR1/GATA3/LPXN/CORO1C/IFNG/PPARD/SMOC2/HBEGF/IL4/WNT5A/GADD45A/NRP2/TEK/PTK2B/PKN1/NR4A1/ID1/RRAS/STAT5A/KDR/APOE/LOXL2/GLUL/CCN3/THBS1/CYP1B1/FGF2/EGF/EPHA2/DUSP10/RAB13/RHOB/SLIT2/PLK2/NOTCH1/ITGB1/VEGFC/PRKCA/CXCL13/KIT/STC1/ADIPOR1/PKN3/EMC10/TGFBR2/NOS3/MAPRE2/ADAM9/EFNA1/PTK2/ZEB2/PRKCE/SCG2/JUN/SVBP/CALR/PTPN11/ADGRB1/PTP4A3/CIB1/CLN3/HMGB1/SRC/KANK2/DPP4/MTOR/CSNK2B/TNF/TMSB4X/TNF/ZNF580/TNF/CSNK2B/CSNK2B/TNF/TNF/CSNK2B/TNF/TNF/TNF/CSNK2B/PDCD6/ITGB3/AKT3/GPI/PTEN | 113 |
| GO:1904892 | regulation of receptor signaling pathway via STAT | 51/3662 | 99/15509 | 1.53091e-09 | 3.46298e-08 | 2.08257e-08 | PTPRC/PIBF1/DOT1L/TGFB1/JAK3/SH2B3/IFNG/IL12B/IL4/IL5/PPP2CA/HES1/GADD45A/PTK2B/LIF/EPHB2/ELP2/IL6/IL10/CYP1B1/EGF/NOTCH1/KIT/ADIPOR1/IL6R/IL24/CDK5/MST1/LEP/PTPN2/CDK5R1/F2/F2R/SOCS1/HGS/NF2/IFNA1/TNF/CRLF2/TNF/TNF/TNF/TNF/TNF/TNF/TNF/IL10RB/GH1/PTPRC/CCL5/CCL5 | 51 |
| GO:0046632 | alpha-beta T cell differentiation | 56/3662 | 113/15509 | 1.61468e-09 | 3.6392e-08 | 2.18855e-08 | TMEM98/RUNX3/FOXP3/PRDM1/AP3D1/RHOA/CBFB/TBX21/IL4R/IL12RB1/ABL1/SMAD7/JAK3/TNFSF8/GATA3/ZBTB16/IFNG/IL12B/IL4/BCL6/CD86/ZAP70/MYB/CD80/BCL11B/RARA/AP3B1/IL6/HLX/IRF4/IL21/ARMC5/IL2RG/IL18/RUNX1/IL6R/TGFBR2/SHH/SYK/LGALS9/CCL19/KLHL25/SOCS1/LILRB4/HMGB1/ENTPD7/MTOR/PNP/HLA-DRA/HLA-DRA/HLA-DRA/HLA-DRA/LILRB4/HLA-DRA/LILRB4/LILRB4 | 56 |
| GO:0009612 | response to mechanical stimulus | 87/3662 | 205/15509 | 1.62461e-09 | 3.64831e-08 | 2.19403e-08 | BAD/MPO/MAP3K14/FAS/BAK1/CYBA/KCNQ1/MAP2K4/RHOA/MMP2/P2RX7/ANGPT2/NFKBIA/CD40/TLR8/PIEZO1/GPI/MTPN/PTN/CASP2/ENG/CXCL12/MAPK8/RPS6KB1/MDK/MAPK14/STAT1/IGFBP2/GADD45A/SLC2A1/PKD2/PPL/TNFRSF10B/PTK2B/TNFRSF8/CXCR4/KCNJ2/IL1B/FOSB/CHI3L1/SERPINE2/TLR4/KIAA0319/THBS1/FGF2/IGF1R/TNFRSF11A/GSN/BAG3/BMP6/XPC/MMP14/KIT/BTG2/CAPN2/ANKRD23/TGFBR2/TLR3/STRBP/FADD/PTK2/MAP3K2/FOS/CDH2/RELA/DAG1/FOSL1/JUN/PLEC/SLC8A1/CSF1/TLR7/SRC/LHFPL5/NTRK1/TNF/TNF/TNF/TNF/TNF/TNF/TNF/TNF/SHANK3/ITGB3/TXNIP/GPI | 87 |
| GO:0042176 | regulation of protein catabolic process | 126/3662 | 330/15509 | 1.63553e-09 | 3.65956e-08 | 2.2008e-08 | OSBPL7/RHBDF1/MYLIP/HFE/PSMC4/RNF14/UFL1/TNFRSF1B/CDH1/HERPUD1/CTSA/ATXN3/ROCK1/SIRT2/VPS35/PRKACA/NSF/MKRN2/SIRT6/UBE2K/LRP2/GSK3B/XPO1/PSMC5/PSME1/HECTD1/BAG6/HSP90AB1/MARCHF2/PSMC6/EEF1A2/USP14/SMAD7/N4BP1/AXIN1/SNRNP70/SGTA/HAMP/GSK3A/DVL1/PSMD3/SH3D19/CD81/IFNG/USP5/WNT5A/ODC1/PARK7/CDC20/TNFAIP3/FBXL5/RAD23B/CLU/LRP1/USP9X/IL1B/PIN1/MGAT3/CBFA2T3/APOE/PSME3/NDFIP1/HSPBP1/APC/SERPINE2/IL10/SORL1/RDX/FURIN/CSNK1D/SMAD4/DTL/PLK2/GNA12/EGFR/TLK2/MSN/OGT/SNX12/EIF3H/ALAD/FOXO1/RNF144A/USP25/EEF1A1/CUL4B/PSMC2/RYBP/RCHY1/SHH/VCP/PSMC3/BTRC/ADAM9/RELA/PSMD1/GLMN/PSMD2/CHMP6/NQO1/ADGRB1/RGMA/ANXA2/CHEK2/PRKN/HGS/USP7/ATG7/SVIP/BAG6/TNF/TNF/TNF/TNF/BAG6/TNF/TNF/BAG6/TNF/TNF/BAG6/BAG6/CEBPA/PRKACA/F8A1/ITCH | 126 |
| GO:0032637 | interleukin-8 production | 45/3662 | 83/15509 | 1.66719e-09 | 3.717e-08 | 2.23534e-08 | CD74/HYAL2/PTPRC/MAVS/TLR8/PYCARD/PRKD2/CD33/NOD1/SERPINE1/WNT5A/PARK7/CD244/IL1B/CHI3L1/PTPN22/IL6/IL10/TLR4/TLR3/SYK/NOD2/FADD/LGALS9/CD14/RELA/LEP/DDIT3/ADIPOQ/F2R/HMGB1/TLR7/ELANE/TNF/TMSB4X/TNF/ZNF580/TNF/TNF/TNF/TNF/TNF/TNF/PTPRC/ELANE | 45 |
| GO:0002820 | negative regulation of adaptive immune response | 40/3662 | 70/15509 | 1.68454e-09 | 3.7422e-08 | 2.2505e-08 | HFE/PARP3/FOXP3/FCGR2B/TBX21/IL4R/PTPRC/SMAD7/LILRB1/IL27RA/JAK3/AHR/PPP3CB/IL4/BCL6/CD160/ARG1/FOXJ1/NDFIP1/ALOX15/NOD2/LILRB4/CD55/CR1/HLA-G/HLA-G/HLA-G/HLA-G/HLA-G/HLA-G/HLA-G/PTPRC/LILRB1/LILRB4/HLA-G/LILRB1/LILRB1/LILRB1/LILRB4/LILRB4 | 40 |
| GO:0002366 | leukocyte activation involved in immune response | 105/3662 | 262/15509 | 1.74908e-09 | 3.87171e-08 | 2.32838e-08 | ITGAL/TMEM98/ST3GAL1/BTK/TYROBP/SLC11A1/CD74/GRN/GAB2/PARP3/C12orf4/FOXP3/KARS1/SPI1/FCGR2B/TBX21/MLH1/STXBP2/IL4R/PTPRC/LAT2/ICAM1/MSH2/IL12RB1/ABL1/XBP1/CD40/SMAD7/GATA1/CD40LG/PYCARD/NBN/LILRB1/IL27RA/TGFB1/JAK3/PIK3CG/EXOSC3/GATA3/NSD2/MDK/CD81/POU2AF1/IFNG/AICDA/IL12B/IL4/BCL6/CD86/SNX4/MYB/VAMP8/NR4A3/PTK2B/CD80/CD244/SHLD2/RAC2/NDFIP1/RARA/NOTCH2/LCP1/IL6/HLX/IL10/STXBP1/TLR4/IRF4/IL21/SLC15A4/IRF8/CPLX2/IL18/KIT/CD1C/ITGB2/IL6R/TNFSF13/SYK/CX3CR1/LGALS9/PTAFR/ITGAM/PRKCE/CCL19/LIG4/RAG2/CD19/CD28/HMGB1/IFNA1/ENTPD7/MTOR/CR1/CD177/HLA-DRA/HLA-DRA/HLA-DRA/HLA-DRA/PTPRC/LILRB1/LILRB1/LILRB1/HLA-DRA/LILRB1 | 105 |
| GO:0002823 | negative regulation of adaptive immune response based on somatic recombination of immune receptors built from immunoglobulin superfamily domains | 38/3662 | 65/15509 | 1.75859e-09 | 3.87892e-08 | 2.33272e-08 | HFE/PARP3/FOXP3/FCGR2B/TBX21/IL4R/PTPRC/SMAD7/LILRB1/IL27RA/JAK3/AHR/PPP3CB/IL4/BCL6/ARG1/FOXJ1/NDFIP1/NOD2/LILRB4/CD55/CR1/HLA-G/HLA-G/HLA-G/HLA-G/HLA-G/HLA-G/HLA-G/PTPRC/LILRB1/LILRB4/HLA-G/LILRB1/LILRB1/LILRB1/LILRB4/LILRB4 | 38 |
| GO:0036037 | CD8-positive, alpha-beta T cell activation | 31/3662 | 48/15509 | 1.79333e-09 | 3.94152e-08 | 2.37036e-08 | HFE/RUNX3/CBFB/LILRB1/TNFSF8/PTPN22/RUNX1/SOCS1/LILRB4/HLA-E/HLA-E/HLA-A/HLA-A/HLA-A/HLA-A/HLA-E/HLA-A/HLA-A/HLA-E/HLA-E/HLA-A/HLA-E/HLA-A/HLA-E/LILRB1/LILRB4/LILRB1/LILRB1/LILRB1/LILRB4/LILRB4 | 31 |
| GO:0002285 | lymphocyte activation involved in immune response | 80/3662 | 184/15509 | 1.8914e-09 | 4.13806e-08 | 2.48856e-08 | ITGAL/TMEM98/ST3GAL1/SLC11A1/CD74/PARP3/FOXP3/SPI1/FCGR2B/TBX21/MLH1/IL4R/PTPRC/ICAM1/MSH2/IL12RB1/ABL1/XBP1/CD40/SMAD7/CD40LG/NBN/LILRB1/IL27RA/TGFB1/JAK3/EXOSC3/GATA3/NSD2/MDK/CD81/POU2AF1/IFNG/AICDA/IL12B/IL4/BCL6/CD86/MYB/PTK2B/CD80/CD244/SHLD2/NDFIP1/RARA/NOTCH2/LCP1/IL6/HLX/IL10/TLR4/IRF4/IL21/SLC15A4/IRF8/IL18/CD1C/IL6R/TNFSF13/LGALS9/CCL19/LIG4/RAG2/CD19/CD28/HMGB1/IFNA1/ENTPD7/MTOR/CR1/HLA-DRA/HLA-DRA/HLA-DRA/HLA-DRA/PTPRC/LILRB1/LILRB1/LILRB1/HLA-DRA/LILRB1 | 80 |
| GO:0046425 | regulation of receptor signaling pathway via JAK-STAT | 49/3662 | 94/15509 | 1.89611e-09 | 4.13806e-08 | 2.48856e-08 | PTPRC/PIBF1/DOT1L/JAK3/SH2B3/IFNG/IL12B/IL4/IL5/PPP2CA/HES1/GADD45A/PTK2B/LIF/EPHB2/ELP2/IL6/IL10/CYP1B1/EGF/NOTCH1/KIT/ADIPOR1/IL6R/IL24/CDK5/MST1/LEP/PTPN2/CDK5R1/F2/F2R/SOCS1/HGS/NF2/IFNA1/TNF/TNF/TNF/TNF/TNF/TNF/TNF/TNF/IL10RB/GH1/PTPRC/CCL5/CCL5 | 49 |
| GO:0048015 | phosphatidylinositol-mediated signaling | 76/3662 | 172/15509 | 1.97594e-09 | 4.29715e-08 | 2.58423e-08 | WNT16/DCN/IGF1/HGF/GAB2/PREX2/ERBB3/SIRT2/FGFR1/OSM/PIK3IP1/PDGFB/PPP1R16B/FLT1/TSC2/PIK3CG/GATA3/UNC5B/CSF3/RPS6KB1/C1QBP/PPARD/PDGFRB/FN1/CD160/TEK/CAT/FLT3/BECN1/KDR/PDGFRA/SERPINE2/PLCB2/PLCE1/FGF2/EGF/IGF1R/KCNH1/PDGFC/PIK3R1/EGFR/OGT/NTRK2/PLCH2/IL18/KIT/PLCD3/GPER1/PTK2/PTAFR/SEMA3E/SELP/LEP/CD28/F2/F2R/CSF1R/PLCB1/ROR1/ZFP36L1/PRR5/PLCD1/SRC/NTRK1/TNF/TNF/TNF/TNF/TNF/TNF/TNF/TNF/GH1/CCL5/CCL5/PTEN | 76 |
| GO:0050868 | negative regulation of T cell activation | 61/3662 | 128/15509 | 2.19992e-09 | 4.76751e-08 | 2.8671e-08 | HFE/CD74/RUNX3/FOXP3/CBFB/FCGR2B/TBX21/IL4R/ARG2/CTSG/SMAD7/LILRB1/JAK3/MDK/IL4/BCL6/CD86/ARG1/CD80/TWSG1/FOXJ1/NDFIP1/SFTPD/PTPN22/IL2RA/HLX/IL10/TNFRSF21/RUNX1/CTLA4/CASP3/SHH/PRDX2/LGALS9/CEBPB/GLMN/RAG2/PTPN2/SOCS1/LILRB4/HMGB1/PDCD1LG2/NRARP/CR1/HLA-G/HLA-G/HLA-G/HLA-G/HLA-G/HLA-G/HLA-G/LILRB1/LILRB4/HLA-G/LILRB1/LILRB1/LILRB1/LILRB4/LILRB4/PTEN/ITCH | 61 |
| GO:0010934 | macrophage cytokine production | 30/3662 | 46/15509 | 2.31827e-09 | 4.98912e-08 | 3.00037e-08 | CD74/P2RX7/ACP5/PYCARD/LILRB1/TGFB1/NOD1/WNT5A/CD36/TLR4/NLRX1/MAPKAPK2/TLR3/NOD2/PRG2/CARD9/TLR7/UBE2J1/HLA-G/HLA-G/HLA-G/HLA-G/HLA-G/HLA-G/HLA-G/LILRB1/HLA-G/LILRB1/LILRB1/LILRB1 | 30 |
| GO:0010935 | regulation of macrophage cytokine production | 30/3662 | 46/15509 | 2.31827e-09 | 4.98912e-08 | 3.00037e-08 | CD74/P2RX7/ACP5/PYCARD/LILRB1/TGFB1/NOD1/WNT5A/CD36/TLR4/NLRX1/MAPKAPK2/TLR3/NOD2/PRG2/CARD9/TLR7/UBE2J1/HLA-G/HLA-G/HLA-G/HLA-G/HLA-G/HLA-G/HLA-G/LILRB1/HLA-G/LILRB1/LILRB1/LILRB1 | 30 |
| GO:0007584 | response to nutrient | 66/3662 | 143/15509 | 2.59536e-09 | 5.56611e-08 | 3.34736e-08 | SNAI2/CASR/F7/OXCT1/XBP1/BMP7/SFRP1/HAMP/USF2/RPS6KB1/CCND1/FOLR1/CYP27B1/VDR/PPARD/IL1A/STAT1/IGFBP2/ARG1/SPP1/DNMT3A/TRIM25/CAT/TRIM24/RUNX2/BECN1/ALDH1A2/EPO/ASS1/RARA/CYP1B1/IGF1R/CYP1A1/ENSA/PKLR/OGT/ALAD/STC1/VCAM1/TGFBR2/TNFRSF11B/CYBB/AQP3/SLC27A4/NOD2/MN1/MGMT/LEP/LPL/A2M/TYMS/NQO1/ADIPOQ/SLC8A1/AKR1C3/KANK2/F5/MTOR/LTA/LTA/LTA/LTA/LTA/ADSL/PKLR/LOC102724560 | 66 |
| GO:0140014 | mitotic nuclear division | 111/3662 | 283/15509 | 2.61631e-09 | 5.59168e-08 | 3.36274e-08 | CDC27/BAZ1B/IGF1/SPAST/ARID1B/RHOA/SIRT2/CDC42/SMC1A/NDE1/ACTB/SPAG5/NDC80/PIBF1/ATRX/SEH1L/CHMP5/ZW10/TPX2/NSFL1C/ANAPC5/BIRC5/NUDC/KIF4A/CDC6/BCL7C/SMARCB1/PDGFB/MYBL2/BMP7/CHMP4B/UBE2I/RAB11A/ARHGEF10/BCCIP/SMC3/SMARCD2/BCL7A/FBXO5/CUL9/MACROH2A1/PDGFRB/SMC4/KAT2B/IL1A/CDC20/NSL1/ARID1A/SLF2/TEX14/NAA50/PDS5A/CENPK/OBSL1/IL1B/BECN1/PIN1/PKMYT1/MAU2/CEP85/CHMP1A/CCNB1/PSRC1/CDCA8/APC/BORA/NUMA1/NUSAP1/KIF23/CENPE/EGF/RB1/KIF2C/CENPC/BOD1/NCAPG2/MKI67/SPC25/SMARCA5/USP16/MAP9/REEP3/BRD7/GOLGA2/BUB1/KAT5/ZWILCH/BANF1/AURKAIP1/CHMP6/ANKLE2/CD28/AURKB/CHEK2/KMT5A/DRG1/ARID2/TNF/TNF/TNF/TNF/TNF/TNF/TNF/TNF/KIFC1/PDXP/LSM14A/SMARCB1/NDE1/SPICE1 | 111 |
| GO:2000514 | regulation of CD4-positive, alpha-beta T cell activation | 42/3662 | 76/15509 | 2.67449e-09 | 5.69398e-08 | 3.42426e-08 | RUNX3/FOXP3/CBFB/TBX21/IL4R/ARG2/IL12RB1/SMAD7/JAK3/GATA3/CD81/IFNG/IL12B/IL4/BCL6/CD86/CD160/MYB/CD80/TWSG1/NDFIP1/RARA/IL2RA/HLX/IRF4/IL2RG/IL18/RUNX1/TGFBR2/LGALS9/CCL19/CD28/KLHL25/SOCS1/HMGB1/CD55/HLA-DRA/HLA-DRA/HLA-DRA/HLA-DRA/HLA-DRA/ITCH | 42 |
| GO:0031098 | stress-activated protein kinase signaling cascade | 96/3662 | 235/15509 | 2.68255e-09 | 5.69398e-08 | 3.42426e-08 | WNT16/PAFAH1B1/NOX1/MAPK8IP2/HGF/FAS/CASR/FLT4/EIF2AK2/TRAF1/HIPK2/MAP2K4/SPI1/RHOA/FCGR2B/TRAF4/OPRK1/RNF13/ZMPSTE24/MECOM/GADD45B/BIRC7/RASSF2/AXIN1/PYCARD/SFRP1/NOD1/FKTN/AMBP/MAPK8/MAP2K6/CRYAB/FOXM1/MAPK14/WNT5A/IL1A/GADD45A/PRDX1/PTK2B/IL1B/BMP2/CCR7/PRMT1/ZFP36/EDA2R/TRAF3/MEN1/PTPN22/MDFIC/CCM2/TLR4/CCL21/MAP3K12/IGF1R/APP/DUSP10/ARL6IP5/EGFR/FOXO1/MBIP/MAPKAPK2/TLR3/NOD2/SEMA4C/LGALS9/GPS1/CCL19/LEP/HRAS/PLCB1/IRAK1/PRKN/ZFP36L1/CARD9/WNT7B/HMGB1/PPIA/TLR7/MAP3K5/TNF/DAXX/DAXX/TNF/TNF/DAXX/TNF/TNF/TNF/DAXX/TNF/DAXX/TNF/NAIP/NAIP/NAIP/ITCH | 96 |
| GO:0006338 | chromatin remodeling | 125/3662 | 329/15509 | 2.70018e-09 | 5.71184e-08 | 3.435e-08 | KDM1A/BAZ1B/ARID1B/FOXP3/BICRA/KDM4A/SIRT2/MBD3/TP63/ACTB/SIRT6/ATRX/MECOM/RAD54L/ESR1/HNRNPC/SUPT16H/BCL7C/CECR2/SMARCB1/CHD8/ACTR5/SMARCA1/RBBP7/AXIN1/CHRAC1/DOT1L/ZNHIT1/EZH2/GATA3/SMARCD2/EZH1/BCL7A/CHD4/HCFC2/AICDA/FAM172A/MACROH2A1/KAT2B/INO80D/SF3B1/HDAC1/PADI2/KDM5B/DR1/ARID1A/MYB/DNMT3A/HELLS/CHD6/H1-3/H2BC11/DEK/YEATS4/HP1BP3/DNMT1/MYBBP1A/WBP2/LOXL2/PPHLN1/ANP32B/HMGA1/TET1/SMARCAL1/RB1/ANP32E/SSRP1/HMGA2/SMARCA5/H2BC5/CHAF1B/PADI4/CTBP1/LMNA/TAF6L/RBBP4/MYSM1/H3-3A/NUDT5/BRD7/GATAD2A/CHAF1A/H1-4/BRD3/PPM1D/HCFC1/KAT5/NPM1/H2AC25/SETD2/H2BC21/H1-2/CENPP/H2AX/H1-0/ARID2/HMGB1/H2BC26/PHF2/L3MBTL3/BRD2/DAXX/DAXX/DNAJC9/BRD2/DAXX/DAXX/BRD2/DAXX/H2BC15/BRD2/BRD2/H4C15/H4C14/H4C12/H2BC6/H3C6/SMARCB1/TADA2A/H4C5/H4C4/H2BC7/H3C10/PADI4/H3C2 | 125 |
| GO:0060562 | epithelial tube morphogenesis | 121/3662 | 316/15509 | 2.81617e-09 | 5.93695e-08 | 3.57038e-08 | HOXA11/CASR/NTN1/TIE1/FGFR2/RHOA/PRKACA/GLI2/SIRT6/TULP3/LRP2/PGR/TMED2/KDM2B/ESR1/HECTD1/ABL1/CECR2/MTHFD1/BMP7/LAMA1/NDRG4/TSC2/EYA1/SFRP1/PRKD2/TGFB1/TMEM59L/MET/HOXA5/ENG/DVL1/GATA3/AREG/FOLR1/MDK/VDR/NPHP3/WNT5A/HES1/KDM5B/PKD2/GNA13/MTHFD1L/CXCR4/SOX4/BMP2/KDR/PODXL/LAMA5/RARA/KRAS/NOTCH2/AHI1/SPRY2/CCM2/NKX2-1/FGF2/EGF/BBS4/ITGAX/GREB1L/SMAD4/EPHA2/RHOB/SLIT2/ADAMTS16/KLHL3/NOTCH1/NODAL/MMP14/SKI/ARHGAP35/DVL3/WNT4/VANGL2/RBM15/TGFBR2/CASP3/SHH/BTRC/RBPJ/SEMA4C/ARL13B/SEMA3E/CCL11/RARG/DAG1/GLMN/CTNNBIP1/CXCR2/SETD2/RGMA/CSF1R/NKX2-5/NOG/CSF1/PBX1/SRC/NRARP/BRD2/FKBPL/CSNK2B/TNF/TCTN1/TNF/BRD2/TNF/CSNK2B/CSNK2B/TNF/TNF/CSNK2B/TNF/TNF/BRD2/TNF/CSNK2B/BRD2/BRD2/PRKACA | 121 |
| GO:0090132 | epithelium migration | 113/3662 | 290/15509 | 2.94058e-09 | 6.1782e-08 | 3.71546e-08 | ITGA3/DCN/SNAI2/GRN/FLT4/ATP2B4/SP100/RHOA/ROCK1/FGFR1/PXN/APOH/ANGPT2/ABL1/PDGFB/MYH9/MMP9/CD40/FERMT1/RAB11A/GPI/PRKD2/TGFB1/PIK3CG/PTN/MET/HSPB1/TGFBR1/GATA3/LPXN/CORO1C/IFNG/PPARD/SMOC2/HBEGF/IL4/WNT5A/GADD45A/NRP2/TEK/PTK2B/PKN1/NR4A1/ID1/RRAS/STAT5A/KDR/APOE/LOXL2/GLUL/CCN3/THBS1/CYP1B1/FGF2/EGF/EPHA2/DUSP10/RAB13/RHOB/SLIT2/PLK2/NOTCH1/ITGB1/VEGFC/PRKCA/CXCL13/KIT/STC1/ADIPOR1/PKN3/EMC10/TGFBR2/NOS3/MAPRE2/ADAM9/EFNA1/PTK2/ZEB2/PRKCE/SCG2/JUN/SVBP/CALR/PTPN11/ADGRB1/PTP4A3/CIB1/CLN3/HMGB1/SRC/KANK2/DPP4/MTOR/CSNK2B/TNF/TMSB4X/TNF/ZNF580/TNF/CSNK2B/CSNK2B/TNF/TNF/CSNK2B/TNF/TNF/TNF/CSNK2B/PDCD6/ITGB3/AKT3/GPI/PTEN | 113 |
| GO:0051052 | regulation of DNA metabolic process | 168/3662 | 475/15509 | 3.0441e-09 | 6.37409e-08 | 3.83327e-08 | KDM1A/UPF1/DBF4/HGF/PARP3/ARID1B/FOXP3/RAD51/FAM168A/TMEM161A/MAP2K4/SPI1/SMG6/MBD3/TBX21/GLI2/ACTB/MLH1/SIRT6/XRCC5/PTPRC/ZMPSTE24/ATRX/NOX4/BAX/ATXN7L3/MAPKAPK5/FUS/HNRNPC/CDC6/MSH2/BRPF3/HSP90AB1/CDC7/BCL7C/SMARCB1/TFIP11/PDGFB/GINS1/CD40/ACTR5/RBBP8/JADE3/EYA1/NBN/CHRAC1/ERCC2/IL27RA/PRKD2/TGFB1/GSK3A/EXOSC3/GATA3/SMC3/RECQL5/SMARCD2/NSD2/BCL7A/FOXM1/AICDA/FBXO5/EYA4/SMOC2/IL4/RAD50/PPP2CA/PDGFRB/BCL6/KPNA1/XRN1/KAT2B/INO80D/ARID1A/SLF2/PTK2B/PDS5A/SHLD2/MORF4L2/USP9X/H1-3/CDKN1A/DEK/YEATS4/AUNIP/POT1/DKC1/NDFIP1/MEN1/HNRNPA1/CCT7/TAF5L/EPC2/IL6/IL10/CYP1B1/ACTR2/SMARCAL1/FGF2/EGF/SLC15A4/NABP2/BRCA2/CUL4A/IGF1R/PIF1/ARRB2/PARP1/CCNA2/EGFR/RADX/PPP4C/HMGA2/SMARCA5/CCDC117/MRNIP/DBF4B/TNFSF13/TAF6L/S100A11/PRKCD/BRD7/CCT2/RNF169/MCM7/ZNF91/NUDT16L1/H1-4/CDK1/MGMT/TADA3/EXOSC10/DCP2/KAT5/KCTD13/RMI2/ZBTB38/MAGEF1/CD28/TAF7/AURKB/MAPK15/ADIPOQ/NPM1/SETD2/USP7/H1-2/H2AX/H1-0/ARID2/HMGB1/TRRAP/SRC/TFDP1/SMG5/TNF/TNF/TNF/TNF/TNF/TNF/TNF/TNF/PRKDC/TEN1/RTEL1/PTPRC/SMARCB1/TINF2 | 168 |
| GO:0001667 | ameboidal-type cell migration | 146/3662 | 400/15509 | 3.13335e-09 | 6.53889e-08 | 3.93237e-08 | ITGA3/PAFAH1B1/DCN/SNAI2/GRN/FLT4/ATP2B4/SP100/RHOA/ROCK1/HYAL2/CDC42/FGFR1/PXN/APOH/ANGPT2/ABL1/PDGFB/MYH9/MMP9/CD40/BMP7/FERMT1/RAB11A/SYDE1/GPI/PRKD2/TGFB1/HAS1/PIK3CG/PTN/MET/HSPB1/TGFBR1/GATA3/ACTA2/C1QBP/LPXN/FOLR1/CORO1C/IFNG/PPARD/SMOC2/HBEGF/IL4/AMOTL2/WNT5A/ITGA4/FN1/GADD45A/NRP2/GNA13/TEK/PTK2B/PKN1/NR4A1/ID1/RRAS/STAT5A/KDR/APOE/LAMA5/AKAP12/CAP1/LOXL2/GLUL/EDNRB/CCN3/THBS1/CYP1B1/FGF2/EGF/EPHA2/DUSP10/RAB13/RHOB/SLIT2/PLK2/TPBG/GNA12/NOTCH1/ITGB1/ARID5B/VEGFC/GJA1/PRKCA/CXCL13/NODAL/KIT/APPL1/DMTN/STC1/ADIPOR1/PKN3/EMC10/TGFBR2/PITX2/SHH/NOS3/MAPRE2/ADAM9/SEMA4C/EFNA1/PTK2/ZEB2/SEMA3E/CDH2/PRKCE/SCG2/JUN/SVBP/PLEC/RCC2/CALR/PTPN11/ADGRB1/SLC8A1/PTP4A3/CIB1/YTHDF3/CLN3/HMGB1/SRC/KANK2/DPP4/MTOR/CSNK2B/TNF/TMSB4X/TNF/ZNF580/TNF/CSNK2B/CSNK2B/TNF/TNF/CSNK2B/TNF/TNF/TNF/CSNK2B/PDCD6/ITGB3/AKT3/GPI/PTEN | 146 |
| GO:0071887 | leukocyte apoptotic process | 55/3662 | 112/15509 | 3.44195e-09 | 7.1588e-08 | 4.30518e-08 | ST3GAL1/BTK/CD74/FAS/BAK1/ST6GAL1/ARG2/BAX/P2RX7/BIRC7/LILRB1/CLC/PRKD2/KDELR1/JAK3/CXCL12/BCL6/WNT5A/FASLG/GPAM/PKN1/CCR7/IRF3/BCL11B/IL2RA/IL6/IL10/CCL21/TNFRSF21/BCL2L11/MERTK/TSC22D3/CASP3/RAG1/NOD2/FADD/LGALS9/PRELID1/EFNA1/BCL2L1/PTCRA/ORMDL3/CCL19/AURKB/CXCR2/CHEK2/NOC2L/CCL5/CCL5/LILRB1/LILRB1/MIF/LILRB1/LILRB1/PTEN | 55 |
| GO:0045066 | regulatory T cell differentiation | 31/3662 | 49/15509 | 3.77749e-09 | 7.83039e-08 | 4.70906e-08 | FOXP3/MDK/IFNG/BCL6/FOXO3/DUSP10/IL2RG/CTLA4/LGALS9/KAT5/CD28/KLHL25/SOCS1/LILRB4/CR1/HLA-G/HLA-DRA/HLA-G/HLA-DRA/HLA-DRA/HLA-G/HLA-G/HLA-DRA/HLA-G/HLA-G/HLA-G/LILRB4/HLA-G/HLA-DRA/LILRB4/LILRB4 | 31 |
| GO:0002664 | regulation of T cell tolerance induction | 22/3662 | 29/15509 | 4.05976e-09 | 8.38747e-08 | 5.04408e-08 | FOXP3/CLC/IL2RA/TGFBR2/LILRB4/HLA-G/HLA-B/HLA-G/HLA-B/HLA-B/HLA-B/HLA-G/HLA-B/HLA-G/HLA-G/HLA-G/HLA-G/LILRB4/HLA-G/LILRB4/LILRB4/ITCH | 22 |
| GO:0090130 | tissue migration | 114/3662 | 295/15509 | 4.37864e-09 | 9.01621e-08 | 5.42219e-08 | ITGA3/DCN/SNAI2/GRN/FLT4/ATP2B4/SP100/RHOA/ROCK1/FGFR1/PXN/APOH/ANGPT2/ABL1/PDGFB/MYH9/MMP9/CD40/FERMT1/RAB11A/GPI/PRKD2/TGFB1/PIK3CG/PTN/MET/HSPB1/TGFBR1/GATA3/ACTA2/LPXN/CORO1C/IFNG/PPARD/SMOC2/HBEGF/IL4/WNT5A/GADD45A/NRP2/TEK/PTK2B/PKN1/NR4A1/ID1/RRAS/STAT5A/KDR/APOE/LOXL2/GLUL/CCN3/THBS1/CYP1B1/FGF2/EGF/EPHA2/DUSP10/RAB13/RHOB/SLIT2/PLK2/NOTCH1/ITGB1/VEGFC/PRKCA/CXCL13/KIT/STC1/ADIPOR1/PKN3/EMC10/TGFBR2/NOS3/MAPRE2/ADAM9/EFNA1/PTK2/ZEB2/PRKCE/SCG2/JUN/SVBP/CALR/PTPN11/ADGRB1/PTP4A3/CIB1/CLN3/HMGB1/SRC/KANK2/DPP4/MTOR/CSNK2B/TNF/TMSB4X/TNF/ZNF580/TNF/CSNK2B/CSNK2B/TNF/TNF/CSNK2B/TNF/TNF/TNF/CSNK2B/PDCD6/ITGB3/AKT3/GPI/PTEN | 114 |
| GO:0006979 | response to oxidative stress | 146/3662 | 402/15509 | 4.59422e-09 | 9.4288e-08 | 5.67032e-08 | BAD/WNT16/CD38/MPO/NOX1/BTK/HGF/GLRX2/BAK1/AIFM2/TMEM161A/HYAL2/SIRT2/SLC25A24/MMP2/SLC23A2/PXN/PTGS1/ABL1/GSKIP/APEX1/DHRS2/MMP9/BMP7/ABCC1/GSR/ERCC2/MET/HSPB1/EZH2/MAPK8/PPIF/AREG/CRYAB/MACROH2A1/PDGFRB/IL1A/STAT1/SDC1/EPAS1/PARK7/PRDX1/PRDX6/TNFAIP3/ARG1/FOXO3/PKD2/NR4A3/PTK2B/CAT/CHD6/STAU1/BECN1/TRAP1/MGAT3/APOE/PXDN/CYP2E1/SESN2/C19orf12/PRKAA1/PDGFRA/CD36/IL6/IL10/TLR4/IL18BP/CYP1B1/MEAK7/SOD1/APP/ARNT/PARP1/RHOB/ARL6IP5/EGFR/NONO/NAPRT/ALAD/SESN3/FOXO1/NR4A2/MMP14/FANCC/PPP1R15B/NDUFS2/TBC1D24/SELENON/CAPN2/ERCC3/FABP1/PRKCD/CASP3/NOS3/TP53INP1/FXN/MBL2/GPX4/PRDX2/ADAM9/RGS14/CDK1/FOS/MGMT/RELA/ATP2A2/BANF1/FOSL1/JUN/ERN1/NQO1/ADIPOQ/SLC8A1/PRKN/AKR1C3/PPIA/DAPK1/SRC/MAP3K5/ND6/ZNF277/TNF/TNF/MICB/GPX3/ZNF580/CHUK/TNF/MICB/MICB/TNF/TNF/TNF/TNF/MICB/MICB/TNF/GAS5/MICB/HBB/HP/TXNIP/SRXN1/PCGF2/TPO/ABCC1 | 146 |
| GO:0050731 | positive regulation of peptidyl-tyrosine phosphorylation | 80/3662 | 187/15509 | 4.68214e-09 | 9.57752e-08 | 5.75975e-08 | CD4/IGF1/CNTN1/CD74/HGF/CD44/ERBB3/FGFR3/PTPRC/DLG3/PIBF1/NOX4/ABL1/OSM/PDGFB/CD40/ADNP/GATA1/EHD4/TGFB1/CSF3/UNC119/AREG/HPX/CD81/IFNG/NEDD9/HBEGF/IL12B/IL4/IL5/HES1/PTK2B/CD80/FLT3/LIF/EPO/LRP4/CD36/IL6/IL21/EGF/ARRB2/EGFR/IL18/BMP6/KIT/IL6R/IL24/RICTOR/IL3/CSF2/SYK/NOD2/EFNA1/ALK/CSPG4/LEP/PTPN11/PAK2/ADIPOQ/CSF1R/SRC/MTOR/TNF/TNF/TNF/TNF/TNF/TNF/TNF/TNF/ITGB3/GH1/PECAM1/PTPRC/CCL5/CD24/CCL5/MIF | 80 |
| GO:0030183 | B cell differentiation | 63/3662 | 136/15509 | 4.95652e-09 | 1.00808e-07 | 6.06241e-08 | BAD/CD79B/ST3GAL1/BTK/HMGB3/BAK1/SPI1/KLF6/TCF3/FCGR2B/PTPRC/BAX/MSH2/ABL1/XBP1/CD40LG/SFRP1/IL7/LYL1/CD79A/JAK3/EZH2/POU2AF1/AICDA/IL4/BCL6/ITGA4/ID2/PTK2B/FLT3/INHBA/NOTCH2/IL6/IL10/IL21/IRF8/DCAF1/PIK3R1/IL2RG/ITGB1/ZFP36L2/HHEX/MS4A1/MMP14/KIT/VCAM1/SYK/RAG1/RBPJ/INPP5D/STAT5B/RAG2/PTPN2/CD19/ZFP36L1/FZD9/PAX5/IFNA1/NTRK1/CR1/PRKDC/PTPRC/INPP5D | 63 |
| GO:0032735 | positive regulation of interleukin-12 production | 30/3662 | 47/15509 | 4.9607e-09 | 1.00808e-07 | 6.06241e-08 | CD40/CD40LG/MDK/IFNG/MAPK14/IL17A/IL12B/CCR7/IRF5/CD36/TLR4/IRF8/TLR3/SYK/NOD2/LGALS9/IL16/CCL19/RELA/LEP/PLCB1/HMGB1/HLA-G/HLA-G/HLA-G/HLA-G/HLA-G/HLA-G/HLA-G/HLA-G | 30 |
| GO:0000302 | response to reactive oxygen species | 77/3662 | 178/15509 | 4.98397e-09 | 1.0095e-07 | 6.07094e-08 | BAD/MPO/BTK/HGF/GLRX2/BAK1/HYAL2/MMP2/PXN/ABL1/APEX1/MMP9/BMP7/MET/EZH2/MAPK8/PPIF/AREG/CRYAB/PDGFRB/IL1A/STAT1/SDC1/PARK7/PRDX1/TNFAIP3/ARG1/FOXO3/PKD2/NR4A3/PTK2B/CAT/BECN1/TRAP1/APOE/CYP2E1/SESN2/PRKAA1/PDGFRA/CD36/IL6/IL10/IL18BP/CYP1B1/SOD1/RHOB/EGFR/SESN3/FANCC/PPP1R15B/CAPN2/FABP1/PRKCD/CASP3/NOS3/FXN/PRDX2/ADAM9/CDK1/FOS/RELA/FOSL1/JUN/ERN1/NQO1/SLC8A1/AKR1C3/SRC/MAP3K5/ND6/ZNF277/ZNF580/CHUK/HBB/HP/TXNIP/PCGF2 | 77 |
| GO:1903038 | negative regulation of leukocyte cell-cell adhesion | 64/3662 | 139/15509 | 5.06696e-09 | 1.02296e-07 | 6.15193e-08 | HFE/CD74/RUNX3/FOXP3/CBFB/FCGR2B/TBX21/IL4R/ARG2/CTSG/SMAD7/LILRB1/JAK3/CXCL12/MDK/IL4/BCL6/CD86/ARG1/CD80/TWSG1/FOXJ1/ASS1/NDFIP1/SFTPD/PTPN22/IL2RA/HLX/IL10/CCL21/TNFRSF21/RUNX1/CTLA4/CASP3/SHH/PRDX2/LGALS9/CEBPB/GLMN/RAG2/PTPN2/SOCS1/LILRB4/HMGB1/PDCD1LG2/NRARP/CR1/HLA-G/HLA-G/HLA-G/HLA-G/HLA-G/HLA-G/HLA-G/LILRB1/LILRB4/HLA-G/LILRB1/LILRB1/LILRB1/LILRB4/LILRB4/PTEN/ITCH | 64 |
| GO:0051403 | stress-activated MAPK cascade | 93/3662 | 228/15509 | 5.178e-09 | 1.04199e-07 | 6.26634e-08 | WNT16/PAFAH1B1/NOX1/MAPK8IP2/HGF/FAS/CASR/FLT4/EIF2AK2/TRAF1/HIPK2/MAP2K4/SPI1/FCGR2B/TRAF4/OPRK1/MECOM/GADD45B/BIRC7/RASSF2/AXIN1/PYCARD/SFRP1/NOD1/FKTN/AMBP/MAPK8/MAP2K6/CRYAB/FOXM1/MAPK14/WNT5A/IL1A/GADD45A/PRDX1/PTK2B/IL1B/BMP2/CCR7/PRMT1/ZFP36/EDA2R/TRAF3/MEN1/PTPN22/MDFIC/CCM2/TLR4/CCL21/MAP3K12/IGF1R/APP/DUSP10/ARL6IP5/EGFR/FOXO1/MBIP/MAPKAPK2/TLR3/NOD2/SEMA4C/LGALS9/GPS1/CCL19/LEP/HRAS/PLCB1/IRAK1/PRKN/ZFP36L1/CARD9/WNT7B/HMGB1/PPIA/TLR7/MAP3K5/TNF/DAXX/DAXX/TNF/TNF/DAXX/TNF/TNF/TNF/DAXX/TNF/DAXX/TNF/NAIP/NAIP/NAIP/ITCH | 93 |
| GO:0043523 | regulation of neuron apoptotic process | 86/3662 | 206/15509 | 5.22556e-09 | 1.04816e-07 | 6.30342e-08 | TYROBP/GRN/HIPK2/ERBB3/MAP2K4/RHOA/ROCK1/BAX/KDM2B/AARS1/MSH2/HSP90AB1/ABL1/MYBL2/ADNP/IL27RA/GPI/GSK3A/CASP2/GATA3/UNC5B/CCL2/ZPR1/CCND1/MDK/PARK7/FASLG/FOXO3/PTK2B/CNTFR/KDR/APOE/KRAS/NGF/SRPK2/IL10/STXBP1/TFAP2A/MAP3K12/ARRB2/SOD1/PARP1/NONO/NTRK2/POU4F1/BCL2L11/NR4A2/BTG2/CASP3/TERT/FOXQ1/CDK5/NSMF/CX3CR1/ITGAM/SEMA3E/BCL2L1/CEBPB/LIG4/HRAS/DDIT3/BDNF/CDK5R1/JUN/NQO1/F2R/PRKN/CLN3/FZD9/SYNGAP1/NTRK1/GPRASP3/TNF/AKT1S1/TNF/TNF/TNF/TNF/TNF/TNF/TNF/NAIP/NAIP/NEFL/NAIP/GPI | 86 |
| GO:0045787 | positive regulation of cell cycle | 118/3662 | 309/15509 | 5.30969e-09 | 1.0616e-07 | 6.38425e-08 | CDC27/KMT2E/DBF4/PAF1/PAFAH1B1/IGF1/SPAST/YTHDC2/FGFR2/RHOA/SIRT2/ASNS/CDC42/SPAG5/NDC80/ATRX/NSFL1C/ANAPC5/BIRC5/CCNK/CDC6/ABL1/CDC7/PDGFB/APEX1/CDC25B/RAB11A/EZH2/RPS6KB1/ZPR1/CCND1/FBXO5/SMOC2/CCND3/MACROH2A1/PDGFRB/SMC4/KAT2B/WNT5A/HES1/TTL/IL1A/PKD2/SLF2/IL1B/BECN1/HSPA2/SOX15/RARA/CCNB1/PSRC1/RPS15A/CDCA8/SRPK2/IL10/NUMA1/RDX/NUSAP1/KIF23/EGF/BRCA2/RB1/CUL4A/IGF1R/CYP1A1/APP/DTL/DYRK3/PKP4/EGFR/NCAPG2/BCL2L11/PRKCA/ADAMTS1/LSM11/CUL4B/CXCR5/DBF4B/TAL1/WNT4/TERT/RRM1/CDK1/PRKCE/RHNO1/RRM2/HCFC1/KAT5/CKS1B/STAT5B/FOSL1/CDK5R1/CD28/AURKB/RCC2/CALR/PTPN11/MAPK15/NPM1/PLCB1/CHEK2/CDK10/PBX1/PLSCR1/SRC/TFDP1/TNF/TNF/TNF/TNF/TNF/TNF/TNF/TNF/ZBED6/CCPG1/PAGR1/LRP6 | 118 |
| GO:0043370 | regulation of CD4-positive, alpha-beta T cell differentiation | 32/3662 | 52/15509 | 5.75513e-09 | 1.14695e-07 | 6.89758e-08 | RUNX3/FOXP3/CBFB/TBX21/IL4R/IL12RB1/SMAD7/JAK3/GATA3/IFNG/IL12B/IL4/BCL6/CD86/MYB/CD80/RARA/HLX/IRF4/IL2RG/IL18/RUNX1/LGALS9/CCL19/KLHL25/SOCS1/HMGB1/HLA-DRA/HLA-DRA/HLA-DRA/HLA-DRA/HLA-DRA | 32 |
| GO:0043542 | endothelial cell migration | 88/3662 | 213/15509 | 6.38492e-09 | 1.26839e-07 | 7.62786e-08 | DCN/SNAI2/GRN/FLT4/ATP2B4/SP100/RHOA/FGFR1/PXN/APOH/ANGPT2/ABL1/PDGFB/MYH9/CD40/GPI/PRKD2/TGFB1/PIK3CG/PTN/MET/HSPB1/TGFBR1/GATA3/LPXN/SMOC2/WNT5A/GADD45A/NRP2/TEK/PTK2B/NR4A1/ID1/RRAS/STAT5A/KDR/APOE/LOXL2/GLUL/CCN3/THBS1/CYP1B1/FGF2/EGF/EPHA2/RAB13/RHOB/SLIT2/PLK2/NOTCH1/ITGB1/VEGFC/PRKCA/CXCL13/STC1/EMC10/NOS3/EFNA1/PTK2/SCG2/SVBP/CALR/ADGRB1/PTP4A3/CIB1/CLN3/HMGB1/DPP4/CSNK2B/TNF/TMSB4X/TNF/ZNF580/TNF/CSNK2B/CSNK2B/TNF/TNF/CSNK2B/TNF/TNF/TNF/CSNK2B/PDCD6/ITGB3/AKT3/GPI/PTEN | 88 |
| GO:0050798 | activated T cell proliferation | 29/3662 | 45/15509 | 6.47472e-09 | 1.28212e-07 | 7.71043e-08 | IGF1/BTN3A1/FOXP3/IL12RB1/ABL1/PYCARD/IL27RA/CLC/JAK3/IL12B/IGFBP2/ARG1/GPAM/TNFSF9/EPO/IL2RA/IL18/ICOSLG/CASP3/FADD/LGALS9/STAT5B/LILRB4/HMGB1/PDCD1LG2/CD24/LILRB4/LILRB4/LILRB4 | 29 |
| GO:0048017 | inositol lipid-mediated signaling | 76/3662 | 176/15509 | 6.87853e-09 | 1.35774e-07 | 8.16523e-08 | WNT16/DCN/IGF1/HGF/GAB2/PREX2/ERBB3/SIRT2/FGFR1/OSM/PIK3IP1/PDGFB/PPP1R16B/FLT1/TSC2/PIK3CG/GATA3/UNC5B/CSF3/RPS6KB1/C1QBP/PPARD/PDGFRB/FN1/CD160/TEK/CAT/FLT3/BECN1/KDR/PDGFRA/SERPINE2/PLCB2/PLCE1/FGF2/EGF/IGF1R/KCNH1/PDGFC/PIK3R1/EGFR/OGT/NTRK2/PLCH2/IL18/KIT/PLCD3/GPER1/PTK2/PTAFR/SEMA3E/SELP/LEP/CD28/F2/F2R/CSF1R/PLCB1/ROR1/ZFP36L1/PRR5/PLCD1/SRC/NTRK1/TNF/TNF/TNF/TNF/TNF/TNF/TNF/TNF/GH1/CCL5/CCL5/PTEN | 76 |
| GO:0014065 | phosphatidylinositol 3-kinase signaling | 64/3662 | 140/15509 | 7.19954e-09 | 1.4166e-07 | 8.51916e-08 | WNT16/DCN/IGF1/HGF/PREX2/ERBB3/SIRT2/FGFR1/OSM/PIK3IP1/PDGFB/PPP1R16B/FLT1/TSC2/PIK3CG/GATA3/UNC5B/CSF3/C1QBP/PPARD/PDGFRB/FN1/CD160/TEK/CAT/FLT3/BECN1/KDR/PDGFRA/SERPINE2/FGF2/EGF/IGF1R/PDGFC/PIK3R1/EGFR/NTRK2/IL18/KIT/GPER1/PTK2/SEMA3E/SELP/LEP/CD28/F2/F2R/ROR1/ZFP36L1/PRR5/SRC/NTRK1/TNF/TNF/TNF/TNF/TNF/TNF/TNF/TNF/GH1/CCL5/CCL5/PTEN | 64 |
| GO:0009636 | response to toxic substance | 91/3662 | 223/15509 | 7.35413e-09 | 1.44243e-07 | 8.67454e-08 | KDM1A/MPO/PON1/CPS1/BAK1/CDH1/RAD51/ABCB1/BAX/SLC7A8/PTGS1/DHRS2/BMP7/GSR/AHR/RPS6KB1/SRSF9/PDGFRB/SDC1/PARK7/KDM5B/PRDX1/PRDX6/MTARC2/ARG1/ABCG2/DNMT3A/EPHX2/UBIAD1/CAT/APOE/PXDN/ASS1/SESN2/GSTM1/CD36/CYP1B1/CYP1A1/SOD1/SLC47A1/EPHX1/ALAD/GSTO1/FANCC/ADAMTS13/INHBB/FABP1/ALB/NOS3/TP53INP1/GPX4/NXN/PRDX2/CDK1/FOS/MGMT/CNP/PDZK1/TYMS/NQO1/SNN/PRKN/SLC22A5/MBP/TXNRD1/SELENOT/TNF/TNF/GPX3/LTC4S/HBE1/HBD/TNF/TNF/TNF/TNF/TNF/TNF/HBB/HP/SRXN1/CCL5/CCL5/CCL4/CCL4/NEFL/TPO/GSTT1/CCL4/ADAMTS13/LTC4S | 91 |
| GO:0032642 | regulation of chemokine production | 49/3662 | 97/15509 | 7.43636e-09 | 1.45396e-07 | 8.74386e-08 | SNAI2/CD74/EIF2AK2/IL4R/ARG2/MAVS/MEFV/PYCARD/IL7/IFNG/IL17A/WNT5A/EGR1/IL1B/IL6/IL10/TLR4/APP/EPHA2/IL18/IL6R/TLR3/SYK/NOD2/LGALS9/LPL/ADIPOQ/CSF1R/SIGIRR/LILRB4/CARD9/HMGB1/TLR7/ELANE/MBP/TNF/TNF/ACKR1/TNF/TNF/TNF/TNF/TNF/TNF/LILRB4/MIF/ELANE/LILRB4/LILRB4 | 49 |
| GO:0045620 | negative regulation of lymphocyte differentiation | 31/3662 | 50/15509 | 7.6927e-09 | 1.49915e-07 | 9.01565e-08 | CD74/RUNX3/HMGB3/FOXP3/CBFB/TBX21/IL4R/SMAD7/SFRP1/JAK3/MDK/IL4/BCL6/ID2/INHBA/FOXJ1/HLX/RUNX1/CTLA4/SHH/PRDX2/RAG2/PTPN2/SOCS1/LILRB4/HMGB1/NRARP/CR1/LILRB4/LILRB4/LILRB4 | 31 |
| GO:0050830 | defense response to Gram-positive bacterium | 55/3662 | 114/15509 | 7.71588e-09 | 1.49915e-07 | 9.01565e-08 | SEH1L/P2RX7/LYZ/CTSG/ACP5/PYCARD/IL27RA/NOD1/TNFSF8/IL17A/H2BC11/IL1B/RNASE1/CD36/IL6/EPHA2/IL18/MR1/MBL2/NOD2/H2BC21/CARD9/RPL39/TNF/HLA-E/PPP1R11/TNF/HLA-E/HLA-A/HLA-A/LTA/TNF/HLA-A/HLA-A/HLA-E/LTA/HLA-A/TNF/TNF/TNF/HLA-A/HLA-E/TNF/HLA-E/LTA/LTA/HLA-A/TNF/HLA-E/HLA-A/HLA-E/LTA/RNASE4/H2BC6/H2BC7 | 55 |
| GO:0030218 | erythrocyte differentiation | 56/3662 | 117/15509 | 8.13151e-09 | 1.57497e-07 | 9.47161e-08 | SLC4A1/KMT2E/UFL1/ALAS1/KCNQ1/HIPK2/SPI1/ACIN1/GATA1/ERCC2/KLF1/JAK3/HOXA5/GATA3/SLC11A2/SH2B3/MAPK14/RHAG/HSPA9/SMAD5/BCL6/STAT1/ID2/EPAS1/MYB/FOXO3/PTBP3/INHBA/THRA/PRMT1/ZFP36/EPO/ABCB10/RB1/ARNT/DYRK3/NCAPG2/KIT/ALAS2/DMTN/TAL1/BAP1/CASP3/SFXN1/EPB42/INPP5D/AHSP/STAT5B/PTPN2/ZFP36L1/CDIN1/L3MBTL3/MAFB/PRKDC/B2M/INPP5D | 56 |
| GO:0010506 | regulation of autophagy | 114/3662 | 298/15509 | 8.56552e-09 | 1.65387e-07 | 9.94606e-08 | BAD/OSBPL7/DCN/UFL1/HGF/RRAGD/ATP6V0A1/CLEC16A/PHF23/CTSA/KDM4A/ROCK1/TBC1D25/SIRT2/VPS35/CSNK2A2/PRKACA/MID2/GSK3B/ZMPSTE24/ATG16L1/DNM1L/ABL1/SH3GLB1/EEF1A2/CHMP4B/NPRL3/TSC2/MEFV/PYCARD/SNRNP70/GSK3A/MET/NOD1/HSPB1/TRIM14/MAPK8/EIF4G2/IFNG/IL4/SNX4/ATP6V1A/TMEM59/PARK7/ELAPOR1/LEPR/ATP6V0B/FOXO3/CAPNS1/BECN1/ATG14/KDR/SESN2/TRIM5/TRIM22/PRKAA1/TBC1D14/PTPN22/IL10/ATP6V1G1/TRIM65/ABL2/PLK2/TLK2/ATP6V1B2/C9orf72/SESN3/SOGA1/FOXO1/ITPR1/BAG3/HSPB8/BCL2L11/UCHL1/ATP6V1C1/DRAM2/EEF1A1/TAB3/FYCO1/CASP3/CDK5/TP53INP1/DEPP1/GOLGA2/NOD2/TRIM68/ADRB2/TRIM8/ORMDL3/SNX32/KAT5/GPR137/LEP/DDIT3/ATG13/TMEM39A/CDK5R1/WDR6/ERN1/MAPK15/EXOC7/PRKN/CLN3/HMGB1/DAPK1/SVIP/MTOR/DCAF12/RNF5/TRIM13/MAGEA3/IKBKG/PIP4K2B/PRKACA | 114 |
| GO:0090218 | positive regulation of lipid kinase activity | 24/3662 | 34/15509 | 8.71583e-09 | 1.67766e-07 | 1.00892e-07 | FGFR3/CDC42/EPHA8/PDGFB/EEF1A2/FLT1/TGFB1/CD81/PDGFRB/TEK/PTK2B/FLT3/CCR7/ATG14/PDGFRA/CCL21/FGF2/KIT/NOD2/PTK2/CCL19/CD19/F2/SRC | 24 |
| GO:0045862 | positive regulation of proteolysis | 128/3662 | 345/15509 | 9.50036e-09 | 1.82301e-07 | 1.09633e-07 | BAD/CASP10/OSBPL7/PSMC4/RNF14/FAS/TNFRSF1B/BAK1/GRN/HERPUD1/CYFIP2/NGFR/ATXN3/RHOA/PSME4/SIRT2/FBXW11/PICALM/MKRN2/SIRT6/FBLN1/GSK3B/BAX/PSMC5/PSME1/HECTD1/BAG6/MYH9/PSMC6/SMAD7/AXIN1/MEFV/PYCARD/SGTA/PDCD5/GSK3A/NOD1/CASP2/PLGRKT/DVL1/SH3D19/CTSC/IFNG/USP5/PERP/FN1/HSPE1/CDC20/FASLG/CLU/PTK2B/TNFSF10/SEMG1/IL1B/CBFA2T3/APOE/ADRM1/PSME3/HSPBP1/AKIRIN2/TANK/ANP32B/MTCH1/BCL2L10/EGF/FURIN/CSNK1D/PMAIP1/APP/CCN1/ARL6IP5/OGT/GSN/RNF144A/BCL2L11/NODAL/MMP14/PSMC2/DISC1/RCHY1/MELTF/GPER1/SYK/VCP/PSMC3/BTRC/FADD/ADAM9/LGALS9/PRELID1/EFNA1/PTK2/ANTXR1/EIF2AK3/AURKAIP1/GRIN1/MAGEF1/SVBP/F2R/RGMA/ANXA2/CNTN2/PRKN/CARD9/HMGB1/DAPK1/SRC/MAP3K5/MBP/CR1/BAG6/TNF/PSENEN/TNF/FIS1/TNF/TNF/BAG6/TNF/TNF/BAG6/TNF/TNF/BAG6/BAG6/CEBPA/PDCD6/PTEN | 128 |
| GO:0016571 | histone methylation | 65/3662 | 144/15509 | 1.02554e-08 | 1.96183e-07 | 1.17981e-07 | NFYA/KDM1A/KMT2E/PAF1/AASS/ARID4B/PRDM1/KDM4A/NFYC/ATRX/MECOM/DNMT3B/SMARCB1/SETD6/DOT1L/FBL/EZH2/GATA3/EZH1/NSD2/HCFC2/MACROH2A1/KDM3A/ASH1L/MYB/PHF19/H1-3/PRMT1/ASH2L/PRDM12/DNMT1/PRMT7/MEN1/TET1/SKIC8/SMAD4/CARM1/BOD1/OGT/NSD3/SMARCA5/RNF20/PRMT2/LMNA/GFI1/PYGO2/NSD1/NNMT/SETD5/H1-4/COPRS/HCFC1/TRMT112/SUZ12/SETD2/SETD3/KMT5A/TET3/H1-2/PAX5/WDR5/WDR5B/NCOA6/SMARCB1/PAGR1 | 65 |
| GO:1904645 | response to amyloid-beta | 32/3662 | 53/15509 | 1.12384e-08 | 2.14325e-07 | 1.28891e-07 | IGF1/NGFR/FCGR2B/GSK3B/MMP2/ICAM1/MMP9/ABCC1/ITGA4/FOXO3/LRP1/BCL2L2/EPHB2/CD36/TLR4/IGF1R/APP/PARP1/GJA1/BCL2L11/VCAM1/CDK5/ADRB2/TNF/TNF/TNF/TNF/TNF/TNF/TNF/TNF/ABCC1 | 32 |
| GO:2000112 | regulation of cellular macromolecule biosynthetic process | 151/3662 | 424/15509 | 1.14158e-08 | 2.17041e-07 | 1.30525e-07 | UPF1/IGF1/EIF2AK2/PUM2/SOAT1/EIF4B/ELAVL1/PKM/RHOA/ROCK1/ELP1/MLH1/MKNK1/DDX1/BZW1/GSK3B/TUT7/TMED2/PPP1R15A/MAPKAPK5/GCN1/AARS1/AGO1/CIRBP/MKNK2/GZMB/PCIF1/GATA1/JAK3/GSK3A/MTPN/HSPB1/EIF3B/EIF4H/FKTN/EXOSC3/LARP4B/CASC3/RPS6KB1/C1QBP/DPH1/EIF4G2/DDX6/HBEGF/XRN1/EIF1B/NCL/PASK/DPH5/FOXO3/EIF2B2/PPP1R3C/MTRF1/PAIP2/SERP1/PTK2B/TARDBP/SOX4/CNOT1/NECAB3/CCR7/PRMT1/TRAP1/DYRK2/ZFP36/SESN2/RARA/PER2/ELP2/ABCB10/NIBAN1/ITM2C/EIF4E2/IL6/BZW2/IREB2/NCBP1/CCL21/THBS1/CYP1B1/LARP1B/TARBP2/TOB1/EIF4A3/GRB7/APP/POLR2D/CNOT9/SLC25A37/EIF3H/EIF4EBP2/TCF7L2/MTG1/CDC123/GUF1/ZFP36L2/RMND1/USP16/EIF4A2/CNOT11/PPP1R15B/BTG2/ZNF385A/RPL26/RPUSD4/GOLGA2/PTAFR/ELP5/PA2G4/ENC1/EIF2AK3/PAIP1/CCL19/DCP2/EIF1/PDE12/ATG13/TYMS/SHMT1/CD28/CALR/TRNAU1AP/NPM1/PLCB1/KLHL25/EIF3C/ZFP36L1/YTHDF3/SECISBP2/DAPK1/SLC2A10/SVIP/MTOR/SELENOT/GIGYF2/TNF/SARNP/TNF/TNF/TNF/TNF/TNF/TNF/TNF/EIF6/PRKDC/LSM14A/RBM8A/CCL5/CCL5/AATF | 151 |
| GO:0032602 | chemokine production | 49/3662 | 98/15509 | 1.14825e-08 | 2.17642e-07 | 1.30886e-07 | SNAI2/CD74/EIF2AK2/IL4R/ARG2/MAVS/MEFV/PYCARD/IL7/IFNG/IL17A/WNT5A/EGR1/IL1B/IL6/IL10/TLR4/APP/EPHA2/IL18/IL6R/TLR3/SYK/NOD2/LGALS9/LPL/ADIPOQ/CSF1R/SIGIRR/LILRB4/CARD9/HMGB1/TLR7/ELANE/MBP/TNF/TNF/ACKR1/TNF/TNF/TNF/TNF/TNF/TNF/LILRB4/MIF/ELANE/LILRB4/LILRB4 | 49 |
| GO:0002517 | T cell tolerance induction | 22/3662 | 30/15509 | 1.18141e-08 | 2.23243e-07 | 1.34254e-07 | FOXP3/CLC/IL2RA/TGFBR2/LILRB4/HLA-G/HLA-B/HLA-G/HLA-B/HLA-B/HLA-B/HLA-G/HLA-B/HLA-G/HLA-G/HLA-G/HLA-G/LILRB4/HLA-G/LILRB4/LILRB4/ITCH | 22 |
| GO:0042063 | gliogenesis | 111/3662 | 290/15509 | 1.29497e-08 | 2.43959e-07 | 1.46713e-07 | TMEM98/PAFAH1B1/CD9/UFL1/CNTN1/TNFRSF1B/GRN/HEXB/SYNE2/NTN1/ERBB3/KDM4A/RHOA/SIRT2/WDR1/TP73/LRP2/ABL1/CSK/ARHGEF10/ERCC2/TGFB1/PTN/EZH2/ZMIZ1/CCL2/CNTNAP1/AREG/MDK/IFNG/HES1/ID2/HDAC1/LEPR/EIF2B2/CLU/PTK2B/CXCR4/EGR2/LRP1/SOX4/MYRF/IL1B/NKX2-2/BMP2/NR1D1/RRAS/LIF/WASF3/KRAS/TSPAN2/SERPINE2/IL6/NKX2-1/TLR4/FGF2/RB1/SOD1/APP/DUSP10/TNFRSF21/NTRK2/NOTCH1/PARD3/VEGFC/MMP14/SKI/CUL4B/B4GALT5/NDUFS2/MXRA8/DISC1/SLC25A46/SHH/CDK5/CX3CR1/CDK1/CDH2/LAMB2/DAG1/CSPG4/CNP/CDK5R1/KCNJ10/PLEC/SUZ12/PTPN11/F2/PLAG1/CSF1R/NOG/CNTN2/CSF1/POU3F2/ROR1/NF2/MTOR/TNF/TNF/LTA/TNF/LTA/TNF/TNF/TNF/TNF/LTA/LTA/TNF/LTA/PTEN | 111 |
| GO:0051348 | negative regulation of transferase activity | 95/3662 | 238/15509 | 1.30265e-08 | 2.44661e-07 | 1.47135e-07 | MVP/PARP3/IPO5/HYAL2/PTPRC/GSK3B/RTRAF/ABL1/GADD45B/PIK3IP1/GSKIP/BMP7/SMAD7/TSC2/PYCARD/CSK/SFRP1/GSK3A/HSPB1/DVL1/CHORDC1/CORO1C/SH2B3/IFNG/FBXO5/MACROH2A1/KAT2B/PRKAR2A/PARK7/GADD45A/CDC20/TNFAIP3/PKN1/CDKN1A/IL1B/BMP2/ZFP36/POT1/AJUBA/CDKN1C/APOE/CEP85/VPS25/EPHB2/MEN1/PTPN22/APC/SPRY2/SORL1/TARBP2/RB1/WARS1/PIF1/DUSP10/NCAPG2/HHEX/UCHL1/GNAQ/EIF4A2/CAMK2N1/PRKCD/DUSP7/CASP3/PKIG/RGS14/ORMDL3/PTPN2/CHMP6/PLEC/TAF7/PAK2/ADIPOQ/NPM1/SLC8A1/PRKN/NF2/LILRB4/HEXIM1/SPRY4/PPIA/SRC/AKT1S1/IPO7/DBNDD2/CEBPA/TEN1/PTPRC/CDKN1C/LILRB4/PIP4K2B/LILRB4/LILRB4/LRP6/PTEN/CHORDC1 | 95 |
| GO:0001818 | negative regulation of cytokine production | 106/3662 | 274/15509 | 1.41658e-08 | 2.65256e-07 | 1.5952e-07 | BTK/HFE/TYROBP/LTF/IGF1/SLC11A1/HGF/SARS1/FOXP3/CDH3/NAV3/FCGR2B/TBX21/ARG2/PTPRC/PIBF1/HSP90AB1/SMAD7/TLR8/ACP5/N4BP1/MEFV/PYCARD/CSK/LILRB1/IL27RA/TGFB1/CD33/JAK3/EZH2/GATA3/C1QBP/IFNG/IL12B/IL4/BCL6/FN1/TNFAIP3/ARG1/INHBA/SRGN/CCR7/ZFP36/TWSG1/FOXJ1/NDFIP1/RARA/SYT11/EPHB2/SFTPD/PTPN22/IL6/IL10/TLR4/THBS1/PPM1B/FURIN/ARRB2/EPHA2/TNFRSF21/MERTK/CD96/NLRX1/INHBB/NDRG2/NOD2/CX3CR1/INPP5D/LGALS9/KAT5/DDIT3/BANF1/F2/ADIPOQ/TRAIP/SIGIRR/PRG2/LILRB4/HMGB1/SLC2A10/ELANE/PDCD1LG2/CR1/TNF/PPP1R11/TMSB4X/TNF/TNF/TNF/TNF/TNF/ORM1/TNF/TNF/PTPRC/CD24/LILRB1/LILRB4/LILRB1/LILRB1/ELANE/LILRB1/LILRB4/LILRB4/INPP5D/ITCH | 106 |
| GO:0051897 | positive regulation of protein kinase B signaling | 52/3662 | 107/15509 | 1.43584e-08 | 2.68052e-07 | 1.61202e-07 | IGF1/F7/FGFR1/LRP2/NOX4/HSP90AB1/OSM/RASD2/TGFB1/PIK3CG/MET/TGFBR1/ENG/GATA3/CSF3/C1QBP/HBEGF/PARK7/TEK/IAPP/CCR7/GDF15/CHI3L1/SPRY2/CCL21/THBS1/FGF2/EGF/IGF1R/ARRB2/TPBG/EGFR/TCF7L2/ITGB1/IL18/RICTOR/CX3CR1/PTK2/CCL19/LEP/CD28/AKR1C3/SRC/TNF/TNF/CPNE1/TNF/TNF/TNF/TNF/TNF/TNF | 52 |
| GO:0002675 | positive regulation of acute inflammatory response | 25/3662 | 37/15509 | 1.73022e-08 | 3.22038e-07 | 1.93668e-07 | BTK/OSM/PIK3CG/PARK7/IL1B/C3/CCR7/IL6/TNFRSF11A/ZP3/TNF/HLA-E/TNF/HLA-E/TNF/HLA-E/TNF/TNF/TNF/HLA-E/TNF/HLA-E/TNF/HLA-E/HLA-E | 25 |
| GO:0016570 | histone modification | 147/3662 | 413/15509 | 1.8588e-08 | 3.44935e-07 | 2.07438e-07 | NFYA/KDM1A/KMT2E/PAF1/AASS/MED24/BAZ1B/UFL1/SNAI2/FOXP3/RAD51/ARID4B/HPF1/PRDM1/KDM4A/NFYC/SPI1/SIRT2/MBD3/ACTB/SIRT6/UBE2A/ZMPSTE24/ATRX/MECOM/ATXN7L3/DNMT3B/KDM2B/BRPF3/SMARCB1/RBBP7/JADE3/SETD6/DOT1L/FBL/PRKD2/EZH2/GATA3/MAPK8/EZH1/NSD2/NAA40/CHD4/HCFC2/PHC1/ZNF451/SKP1/MACROH2A1/BCL6/KAT2B/SF3B1/KDM3A/PARK7/HDAC1/ASH1L/KDM5B/DR1/MYB/PHF19/KDM3B/NAA50/MORF4L2/H1-3/DEK/PRMT1/YEATS4/LIF/ASH2L/PRDM12/DNMT1/PER2/MYBBP1A/WBP2/PRMT7/MEN1/DDB2/TAF5L/EPC2/IRF4/TET1/BRCA2/SKIC8/SMAD4/CARM1/BOD1/NCAPG2/OGT/NSD3/KAT14/MBIP/SMARCA5/RNF20/USP16/BRPF1/SKI/CUL4B/ELK4/CTBP1/PRMT2/LMNA/TAF6L/RBBP4/MYSM1/GFI1/PYGO2/RYBP/BAP1/NSD1/BRD7/RAG1/NNMT/GATAD2A/SETD5/H1-4/RIOX1/RIOX2/TADA3/JMJD1C/COPRS/HCFC1/KAT5/TRMT112/KDM2A/MSL2/SUZ12/TAF7/AURKB/PCGF5/SETD2/SETD3/KMT5A/MUC1/USP7/TET3/H1-2/NOC2L/PAX5/WDR5/TRRAP/WDR5B/PHF2/NCOA6/SMARCB1/UHRF1/TADA2A/PCGF2/PAGR1 | 147 |
| GO:1901653 | cellular response to peptide | 124/3662 | 335/15509 | 1.88915e-08 | 3.49521e-07 | 2.10196e-07 | IGF1/CPS1/CASR/CYBA/NGFR/PKM/ROCK1/FCGR2B/ACTN2/GSK3B/RAB10/CHMP5/PXN/ICAM1/CDC6/XBP1/RANGAP1/APEX1/PCK2/TSC2/ABCC1/CSK/PLAT/SLC39A14/KLF1/JAK3/GSK3A/NOD1/RPS6KB1/CCND3/KAT2B/NCL/ITGA4/STAT1/ARG1/FOXO3/NR4A3/CRHR1/INHBA/NR4A1/LRP1/NCOA5/IL1B/MAX/ID1/STAT5A/BCL2L2/GDF15/ASS1/PRKAA1/LPIN3/EPHB2/MEN1/PTPN22/APC/CD36/TLR4/SORL1/CYP1B1/RB1/IGF1R/APP/RAB13/PKLR/PARP1/CCNA2/PIK3R1/OGT/EIF4EBP2/SESN3/SOGA1/FOXO1/POU4F2/GJA1/BCL2L11/NR4A2/APPL1/ADIPOR1/SHC1/JAK1/SCNN1D/VCAM1/INHBB/PRKCD/GPER1/CDK5/ZNF592/SLC27A4/NOD2/AHCYL1/ADRB2/PTK2/FOS/SLC25A33/KLF11/RELA/ESRRA/STAT5B/LEP/PTPN2/LPL/GRB2/ERFE/PTPN11/ADIPOQ/PLCB1/FOXO4/SOCS1/ZFP36L1/SRC/TNF/TNF/TNF/TNF/TNF/TNF/TNF/TNF/PRKDC/ITGB3/GH1/PKLR/PIP4K2B/ABCC1 | 124 |
| GO:0043666 | regulation of phosphoprotein phosphatase activity | 36/3662 | 64/15509 | 1.93378e-08 | 3.56714e-07 | 2.14521e-07 | ROCK1/PTPRC/GSK3B/PPP1R15A/FKBP1A/HSP90AB1/PPP6R2/CD33/PDGFRB/PTPA/MASTL/CRY2/STYXL1/CALM2/BOD1/GNA12/PPP1R15B/CALM3/PPP1R2/MAGI2/MTOR/CSNK2B/TNF/PPP1R11/TNF/TNF/CSNK2B/CSNK2B/TNF/TNF/CSNK2B/TNF/TNF/TNF/CSNK2B/PTPRC | 36 |
| GO:0001936 | regulation of endothelial cell proliferation | 61/3662 | 134/15509 | 1.95529e-08 | 3.58778e-07 | 2.15763e-07 | FLT4/CYBA/NGFR/TIE1/SIRT6/FGFR1/APOH/PDGFB/PPP1R16B/FLT1/PRKD2/TGFBR1/CXCL12/CCL2/MDK/IL12B/WNT5A/ITGA4/STAT1/PDCL3/NRP2/ARG1/PGF/TEK/NR4A1/BMP2/STAT5A/KDR/ALDH1A2/APOE/IL10/THBS1/FGF2/EGF/ARNT/VEGFC/BMP6/PRKCA/EMC10/AIMP1/AGGF1/SCG2/CCL11/EGFL7/LEP/JUN/HMGB1/NRARP/TNF/TNF/ZNF580/NRAS/TNF/TNF/TNF/TNF/TNF/TNF/PDCD6/ITGB3/AKT3 | 61 |
| GO:0031960 | response to corticosteroid | 68/3662 | 155/15509 | 1.95655e-08 | 3.58778e-07 | 2.15763e-07 | BAD/CPS1/CYBA/PTPRU/RHOA/PCK2/PLAT/GSK3A/ENG/RPS6KB1/AREG/CCND1/MDK/IGFBP2/SDC1/ARG1/FOXO3/KLF9/FLT3/FOSB/ZFP36/CDO1/EPO/ASS1/IL6/IL10/IL1RN/CYP1B1/IGF1R/PARP1/SLIT2/ALAD/NOTCH1/ZFP36L2/BCL2L11/BMP6/STC1/CALM3/SCNN1D/CASP3/GPER1/CYBB/ABCA3/DDIT4/ADAM9/PTAFR/FOS/FOSL1/A2M/TYMS/SSTR2/ADIPOQ/PAPPA/SLIT3/ZFP36L1/UBE2L3/WNT7B/AKR1C3/SRC/TNF/TNF/TNF/TNF/TNF/TNF/TNF/TNF/NEFL | 68 |
| GO:0072594 | establishment of protein localization to organelle | 143/3662 | 400/15509 | 2.11208e-08 | 3.86155e-07 | 2.32227e-07 | AGK/POLA2/TOMM34/CDH1/HSPA5/HERPUD1/SEC61A1/TNPO3/AP3D1/IPO5/SEC61A2/ELAVL1/HYAL2/CSNK2A2/LMAN1/SIRT6/TNPO1/RAB10/IPO11/BAX/MAVS/NUP50/BAG6/HSP90AB1/SH3GLB1/TIMM13/RNF215/SAMM50/GZMB/TIMM9/NFKBIA/FERMT1/CHMP4B/NXT2/UBL4A/KPNA3/MON1B/TSC2/RAB11A/SGTA/PDCD5/TGFB1/TNPO2/GSK3A/MAPK8/RANGRF/GRPEL1/ZPR1/HSPA8/IFNG/MAN1A1/MAPK14/PEX7/MACROH2A1/KPNA1/SPCS1/MFN2/TNFAIP3/CLU/TARDBP/CRY2/CSE1L/CDKN1A/NUP153/NUP85/BECN1/ATG14/RAC2/POT1/CD68/DKC1/HACL1/VPS25/TIMM10B/PRKAA1/WBP2/NXT1/AP3B1/IPO8/CD36/MDFIC/AKIRIN2/CCT7/VPS36/NMT1/SORL1/NABP2/BRCA2/SRP14/SAE1/SRPRB/PIK3R1/NOTCH1/IMMP1L/TIMM8B/BAG3/RANBP2/HEATR3/APPL1/ZFAND2B/CALM3/LMNA/PEX19/BAP1/PRKCD/TERT/SHH/SYK/CCT2/CHP2/SRP68/PKIG/MFF/CDK1/TOMM20/LEP/DDIT3/ATG13/TOMM5/PTTG1IP/AP3M1/PRKN/HGS/UBE2L3/IPO4/UBL5/IPO9/HSPA1L/BAG6/IPO7/HSPA1L/FIS1/HSPA1L/BAG6/BAG6/BAG6/HSPA1L/BAG6/HSPA1L/TIMM23/TXNIP/SQSTM1/IPO4 | 143 |
| GO:0002274 | myeloid leukocyte activation | 90/3662 | 224/15509 | 2.15677e-08 | 3.93167e-07 | 2.36444e-07 | KMT2E/BTK/TYROBP/SLC11A1/CD74/GRN/GAB2/C12orf4/KARS1/SPI1/HYAL2/FCGR2B/STXBP2/IL4R/PTPRC/LAT2/CTSG/DHRS2/GATA1/PYCARD/CD33/HAMP/PIK3CG/CTSC/IFNG/IL4/WNT5A/SNX4/FN1/VAMP8/NR4A3/CLU/NR1D1/RAC2/NECTIN2/SYT11/NOTCH2/IL6/IL10/STXBP1/TLR4/IRF4/THBS1/APP/CPLX2/IL18/KIT/ITGB2/TGFBR2/PRKCD/TLR3/CSF2/SYK/RBPJ/CX3CR1/RHOH/ADAM9/TNIP2/LGALS9/PTAFR/CXCL8/ITGAM/PRKCE/JUN/CXCR2/CSF1/LILRB4/PLSCR1/CNR2/HMGB1/TRPV1/SHPK/TNF/CD177/CRLF2/TNF/TNF/TNF/TNF/TNF/TNF/TNF/CEBPA/PTPRC/CCL5/CCL5/LILRB4/MIF/LILRB4/LILRB4 | 90 |
| GO:0006469 | negative regulation of protein kinase activity | 77/3662 | 183/15509 | 2.16907e-08 | 3.94249e-07 | 2.37095e-07 | MVP/IPO5/HYAL2/PTPRC/RTRAF/ABL1/GADD45B/GSKIP/BMP7/TSC2/PYCARD/SFRP1/HSPB1/DVL1/CHORDC1/CORO1C/SH2B3/IFNG/MACROH2A1/KAT2B/PRKAR2A/PARK7/GADD45A/TNFAIP3/PKN1/CDKN1A/IL1B/BMP2/CDKN1C/APOE/CEP85/VPS25/EPHB2/MEN1/PTPN22/APC/SPRY2/SORL1/TARBP2/RB1/WARS1/DUSP10/NCAPG2/HHEX/UCHL1/GNAQ/CAMK2N1/PRKCD/DUSP7/CASP3/PKIG/RGS14/PTPN2/CHMP6/PLEC/TAF7/PAK2/ADIPOQ/NPM1/SLC8A1/NF2/LILRB4/HEXIM1/SPRY4/PPIA/AKT1S1/IPO7/DBNDD2/CEBPA/PTPRC/CDKN1C/LILRB4/LILRB4/LILRB4/LRP6/PTEN/CHORDC1 | 77 |
| GO:0042542 | response to hydrogen peroxide | 53/3662 | 111/15509 | 2.24823e-08 | 4.07443e-07 | 2.45029e-07 | BAD/HGF/GLRX2/BAK1/MMP2/ABL1/APEX1/MET/EZH2/PPIF/AREG/CRYAB/PDGFRB/STAT1/SDC1/PARK7/TNFAIP3/ARG1/FOXO3/NR4A3/PTK2B/CAT/BECN1/TRAP1/PRKAA1/IL6/IL10/IL18BP/CYP1B1/SOD1/RHOB/PPP1R15B/CAPN2/FABP1/PRKCD/CASP3/FXN/ADAM9/CDK1/RELA/FOSL1/ERN1/NQO1/SLC8A1/SRC/MAP3K5/ND6/ZNF277/ZNF580/HBB/HP/TXNIP/PCGF2 | 53 |
| GO:0035304 | regulation of protein dephosphorylation | 47/3662 | 94/15509 | 2.2725e-08 | 4.1064e-07 | 2.46952e-07 | PTBP1/ROCK1/PTPRC/GSK3B/PPP1R15A/FKBP1A/HSP90AB1/PPP6R2/PPP1R16B/TGFB1/CD33/PPP2R5D/PDGFRB/PTPA/MASTL/CRY2/PIN1/STYXL1/ENSA/CALM2/BOD1/GNA12/SPPL3/PPP1R15B/CALM3/PRKCD/NSMF/ANKLE2/PPP1R2/MAGI2/PPIA/MTOR/CSNK2B/TNF/PPP1R11/TNF/TNF/CSNK2B/CSNK2B/TNF/TNF/CSNK2B/TNF/TNF/TNF/CSNK2B/PTPRC | 47 |
| GO:0046006 | regulation of activated T cell proliferation | 27/3662 | 42/15509 | 2.34024e-08 | 4.20429e-07 | 2.52838e-07 | IGF1/FOXP3/IL12RB1/PYCARD/IL27RA/CLC/JAK3/IL12B/IGFBP2/ARG1/GPAM/TNFSF9/EPO/IL2RA/IL18/ICOSLG/CASP3/FADD/LGALS9/STAT5B/LILRB4/HMGB1/PDCD1LG2/CD24/LILRB4/LILRB4/LILRB4 | 27 |
| GO:1904707 | positive regulation of vascular associated smooth muscle cell proliferation | 27/3662 | 42/15509 | 2.34024e-08 | 4.20429e-07 | 2.52838e-07 | IGF1/MMP2/PDGFB/MMP9/BMPR1A/MFN2/NR4A3/DNMT1/IL10/FGF2/GJA1/ADAMTS1/LDLRAP1/TERT/FRS2/JUN/ERN1/SRC/MAP3K5/TNF/TNF/TNF/TNF/TNF/TNF/TNF/TNF | 27 |
| GO:0043254 | regulation of protein-containing complex assembly | 134/3662 | 370/15509 | 2.40101e-08 | 4.301e-07 | 2.58654e-07 | DHX33/SCIN/BAK1/HSPA5/FNIP2/CYFIP2/EIF2AK2/RNF4/RHOA/NAV3/SIRT2/VPS35/SPTB/CDC42/ADD2/GSK3B/BAX/ADD1/ESR1/ABL1/SH3GLB1/TFIP11/PSMC6/TCL1A/FERMT1/HCK/RIOK3/COTL1/MEFV/PIEZO1/PYCARD/MED25/TGFB1/MTPN/MET/DKK1/CSF3/RANGRF/CRYAB/HSPA8/ARPC3/IFNG/IL5/DBN1/HES1/PARK7/CAPZA1/STMN1/SLF2/CLU/PTK2B/IAPP/EML2/THRA/CCR7/CDC42EP1/AJUBA/APOE/ARPC1B/PSRC1/HRK/CD36/LCP1/DBNL/STXBP1/TLR4/CCL21/ATAT1/NUMA1/SORL1/RDX/SMAD6/RB1/SLAIN1/WARS1/BBS4/TBCD/PARP1/SLIT2/ARHGAP18/MSN/GSN/CDC42EP2/BCL2L11/GBP5/CXCL13/DMTN/SPTBN4/ALOX15/TAL1/ARPC5/H3-3A/CDC42EP3/SPTA1/PRKCD/RICTOR/ANKRA2/CSF2/SYK/VCP/ABCA3/PRKCE/CCL11/HCFC1/SPTBN2/SELP/CDK5R1/FLII/GRB2/CTNNBIP1/PTPN11/BBS10/MAPK15/INPP5J/DRG1/HMGB1/MMP1/SRC/SPTAN1/SVIP/MTOR/IQANK1/TNF/TMSB4X/TNF/TNF/TNF/TNF/TNF/TNF/TNF/ARPC1A/TWF2/BRK1 | 134 |
| GO:0042060 | wound healing | 148/3662 | 418/15509 | 2.45189e-08 | 4.37948e-07 | 2.63374e-07 | SLC4A1/ADIPOR2/CD9/IGF1/SLC11A1/CD44/F7/CDH3/ERBB3/MYLK/FGFR2/RHOA/LMAN1/ACTB/MCAM/FBLN1/CD59/CHMP5/APOH/DSP/XBP1/PDGFB/MYH9/CTSG/PROCR/CD40/FERMT1/CHMP4B/GATA1/CD40LG/DGKH/PLAT/TGFB1/TFPI2/PIK3CG/HSPB1/SERPINE1/TGFBR1/ACTA2/HGFAC/VWF/WNT5B/SH2B3/PPARD/MAPK14/SMOC2/HBEGF/PDGFRB/WNT5A/IL1A/FN1/SDC1/MPL/SERPINC1/TNFAIP3/PPL/GNA13/CXCR4/F13A1/CDKN1A/AHNAK/KDR/AJUBA/APOE/COL5A1/CHMP1A/SYT11/AP3B1/EPHB2/ARL8B/NOTCH2/PDGFRA/CD36/SERPINE2/IL6/STXBP1/TLR4/THBS1/MYOF/FGF2/ADAMTS18/SMAD4/FKBP10/CCN1/GNA12/AK3/ITGB1/DST/MERTK/DGKE/PRKCA/GNAQ/DMTN/ARHGAP35/ADAMTS13/ALOX15/WNT4/IL24/TGFBR2/PF4/PRKCD/ANXA5/F2RL2/CASP3/SHH/NOS3/SYK/FUNDC2/HPS6/PRDX2/PTK2/PRKCE/C1GALT1C1/FGG/FGA/JMJD1C/DAG1/SELP/HRAS/SMAD2/CHMP6/PLEC/F2/F2R/ANXA2/NOG/ADRA2C/PLSCR1/BLOC1S3/PPIA/MRTFA/SRC/MAP3K5/F5/MTOR/TNF/TNF/TNF/TNF/TNF/TNF/SFTA3/TNF/TNF/HBB/ITGB3/ADAMTS13/PTEN | 148 |
| GO:0048511 | rhythmic process | 104/3662 | 270/15509 | 2.52028e-08 | 4.48871e-07 | 2.69943e-07 | NFYA/CRY1/BMAL2/HSPA5/PER3/F7/NGFR/FBXW11/SIRT6/PGR/OPRK1/GSK3B/MMP2/DNM1L/ESR1/ADNP/PTN/CASP2/EZH2/AHR/MAPK8/RAI1/DDX5/HLF/MAP2K6/MDK/KAT2B/ID2/HDAC1/KDM5B/FOXO3/KLF9/ENOX1/EGR1/TARDBP/CRY2/INHBA/USP9X/ID1/NR1D1/FBXL12/ASS1/TOP2A/PER2/PRKAA1/MYBBP1A/BHLHE40/PDGFRA/NKX2-1/CYP1B1/CUL4A/IGF1R/ARRB2/CSNK1D/TNFRSF11A/DTL/PARP1/SLIT2/NONO/OGT/NTRK2/GAS2/ADAMTS1/KLF10/GNAQ/NR2F6/CASP3/CSF2/GDF9/ADCY1/NOS3/CDK5/ENOX2/BTRC/CDK1/KAT5/KDM2A/STAT5B/LEP/FZD4/A2M/CDK5R1/TYMS/OXTR/ADIPOQ/BTBD9/SLIT3/USP7/ZP3/SRC/ATG7/NTRK1/MTOR/CIPC/TNF/TNF/TNF/TNF/TNF/TNF/TNF/TNF/PRKDC/PTEN | 104 |
| GO:0097696 | receptor signaling pathway via STAT | 70/3662 | 162/15509 | 2.58967e-08 | 4.59908e-07 | 2.76581e-07 | IGF1/FGFR3/PTPRC/PIBF1/OSM/CD40/DOT1L/TGFB1/JAK3/HAMP/CCL2/HPX/SH2B3/IFNG/IL12B/IL4/IL5/PPP2CA/HES1/STAT1/GADD45A/PKD2/PTK2B/FLT3/STAT5A/LIF/EPO/EPHB2/ELP2/IL6/IL10/CYP1B1/IL21/EGF/NOTCH1/IL18/KIT/ADIPOR1/IL6R/JAK1/IL24/IL3/CSF2/CDK5/MST1/STAT5B/LEP/PTPN2/CDK5R1/F2/F2R/CSF1R/SOCS1/HGS/NF2/IFNA1/TNF/CRLF2/TNF/TNF/TNF/TNF/TNF/TNF/TNF/IL10RB/GH1/PTPRC/CCL5/CCL5 | 70 |
| GO:0032760 | positive regulation of tumor necrosis factor production | 49/3662 | 100/15509 | 2.65761e-08 | 4.70624e-07 | 2.83025e-07 | BTK/TYROBP/CYBA/PTPRC/MAVS/PYCARD/NOD1/HSPB1/IFNG/IL17A/IL12B/WNT5A/IL1A/CLU/TNFRSF8/AKAP12/EPHB2/CD36/IL6/TLR4/THBS1/APP/PIK3R1/MAPKAPK2/PF4/TLR3/SYK/CYBB/NOD2/FADD/LGALS9/PTAFR/CD14/CCL19/LEP/LPL/PTPN11/CARD9/HMGB1/HLA-E/HLA-E/HLA-E/HLA-E/ORM1/HLA-E/HLA-E/HLA-E/PTPRC/MIF | 49 |
| GO:0007259 | receptor signaling pathway via JAK-STAT | 68/3662 | 156/15509 | 2.67517e-08 | 4.72267e-07 | 2.84013e-07 | IGF1/FGFR3/PTPRC/PIBF1/OSM/CD40/DOT1L/JAK3/HAMP/CCL2/HPX/SH2B3/IFNG/IL12B/IL4/IL5/PPP2CA/HES1/STAT1/GADD45A/PKD2/PTK2B/FLT3/STAT5A/LIF/EPO/EPHB2/ELP2/IL6/IL10/CYP1B1/IL21/EGF/NOTCH1/IL18/KIT/ADIPOR1/IL6R/JAK1/IL24/IL3/CSF2/CDK5/MST1/STAT5B/LEP/PTPN2/CDK5R1/F2/F2R/CSF1R/SOCS1/HGS/NF2/IFNA1/TNF/TNF/TNF/TNF/TNF/TNF/TNF/TNF/IL10RB/GH1/PTPRC/CCL5/CCL5 | 68 |
| GO:0034504 | protein localization to nucleus | 103/3662 | 267/15509 | 2.68212e-08 | 4.72267e-07 | 2.84013e-07 | TMEM98/PAF1/POLA2/CDH1/NGFR/TNPO3/IPO5/ELAVL1/SP100/HYAL2/SIRT6/GSK3B/XPO1/TNPO1/IPO11/MAVS/NUP50/HSP90AB1/RANGAP1/NFKBIA/BMP7/FERMT1/NXT2/KPNA3/TSC2/TGFB1/TNPO2/DNAJB6/DVL1/RANGRF/ZBTB16/ZPR1/IFNG/MAPK14/SKP1/KPNA1/PARK7/TARDBP/CRY2/CSE1L/CDKN1A/NUP153/NUP85/PIN1/LIF/SESN2/DKC1/SYNE1/NXT1/IPO8/CD36/MDFIC/AKIRIN2/CCT7/GLUL/XPA/TAF8/TRIM29/BBS4/TOR1AIP1/PARP1/PIK3R1/NOTCH1/BAG3/HHEX/RANBP2/HEATR3/APPL1/LMNA/PRKCD/TERT/SHH/CDK5/SYK/CCT2/CHP2/PKIG/NMD3/CDK1/TRIM8/ORMDL3/EIF2AK3/LEP/LARP7/CALR/F2/NPM1/CACNB4/PTTG1IP/SUMO3/NF2/LILRB4/RRP7A/IPO4/SRC/IPO9/IPO7/TXNIP/LILRB4/LILRB4/LILRB4/SQSTM1/IPO4 | 103 |
| GO:0001935 | endothelial cell proliferation | 65/3662 | 147/15509 | 2.75667e-08 | 4.84019e-07 | 2.9108e-07 | FLT4/CYBA/NGFR/TIE1/SIRT6/FGFR1/APOH/PDGFB/PPP1R16B/FLT1/PRKD2/TGFBR1/CXCL12/CCL2/MDK/IL12B/WNT5A/ITGA4/STAT1/PDCL3/NRP2/ARG1/PGF/TEK/NR4A1/BMP2/STAT5A/KDR/ALDH1A2/APOE/LOXL2/IL10/THBS1/FGF2/EGF/EPHA2/ARNT/VEGFC/BMP6/PRKCA/MMP14/EMC10/AIMP1/AGGF1/SCG2/CCL11/EGFL7/LEP/JUN/ERN1/HMGB1/NRARP/TNF/TNF/ZNF580/NRAS/TNF/TNF/TNF/TNF/TNF/TNF/PDCD6/ITGB3/AKT3 | 65 |
| GO:0034341 | response to interferon-gamma | 62/3662 | 138/15509 | 2.76713e-08 | 4.84463e-07 | 2.91348e-07 | SLC11A1/CD74/SP100/CDC42/IL12RB1/CD40/HCK/CCL22/CCL17/MEFV/RPS6KB1/CCL2/HPX/CYP27B1/IFNG/IL12B/WNT5A/CCL20/STAT1/FASLG/ARG1/ASS1/STXBP1/TLR4/CCL21/ACTR2/IRF8/GSN/CDC42EP2/GBP5/ADAMTS13/JAK1/TLR3/LGALS9/KIF5B/CCL11/CCL19/PDE12/PTPN2/CIITA/SOCS1/IFITM1/DAPK1/CD47/TNF/TNF/TNF/TNF/TNF/TNF/TNF/HLA-DPA1/TNF/CCL5/CCL5/CCL4/CCL18/CCL4/CCL4/CCL18/CCL18/ADAMTS13 | 62 |
| GO:0001822 | kidney development | 106/3662 | 277/15509 | 2.77484e-08 | 4.84463e-07 | 2.91348e-07 | HOXA11/ITGA3/PROM1/IFT88/PRDM1/SEC61A1/FGFR2/RHOA/HYAL2/GLI2/NOTCH3/ITGA8/TP73/ARG2/LRP2/HSPB11/ZMPSTE24/BAX/ANGPT2/BAG6/PDGFB/MMP9/BMP7/SMAD7/RPGRIP1L/EYA1/SFRP1/TMEM59L/TGFBR1/GATA3/ACTA2/ZBTB16/SMAD5/PDGFRB/NPHP3/WNT5A/HES1/SNX17/STAT1/ODC1/SDC1/PKD2/HELLS/TEK/EGR1/CAT/SOX4/NUP85/BMP2/LIF/PODXL/ALDH1A2/FOXJ1/LAMA5/ASS1/RARA/NOTCH2/LRP4/PDGFRA/AHI1/EDNRB/TFAP2A/SMAD6/ARL3/PLCE1/FGF2/ENPEP/GREB1L/SMAD4/REN/SLIT2/ADAMTS16/KLHL3/NOTCH1/ARID5B/FREM2/BCL2L11/BMP6/ADAMTS1/IL6R/WNT4/VANGL2/PYGO2/HEYL/SHH/FADD/LAMB2/ZNG1A/SMAD2/CTNNBIP1/CXCR2/ADIPOQ/NOG/PBX1/MAGI2/WNT7B/MME/KANK2/BAG6/BAG6/BAG6/BAG6/BAG6/ITGB3/PECAM1/CD24 | 106 |
| GO:0046640 | regulation of alpha-beta T cell proliferation | 33/3662 | 57/15509 | 2.87128e-08 | 4.99893e-07 | 3.00627e-07 | FOXP3/ARG2/PTPRC/CD81/IL12B/ZAP70/TWSG1/NDFIP1/PTPN22/IL2RA/IL18/TGFBR2/SYK/LGALS9/CD28/CD55/HLA-E/HLA-E/HLA-A/HLA-A/HLA-A/HLA-A/HLA-E/HLA-A/HLA-A/HLA-E/HLA-E/HLA-A/HLA-E/HLA-A/HLA-E/PTPRC/ITCH | 33 |
| GO:0006914 | autophagy | 165/3662 | 478/15509 | 2.92408e-08 | 5.06241e-07 | 3.04444e-07 | BAD/OSBPL7/DCN/UFL1/HGF/RRAGD/IFT88/ATP6V0A1/CLEC16A/PHF23/VMP1/CTSA/KDM4A/ROCK1/TBC1D25/SIRT2/VPS35/CSNK2A2/PRKACA/MARK2/MID2/GSK3B/ZMPSTE24/ATG16L1/CHMP5/DNM1L/NSFL1C/ABL1/SH3GLB1/SNAP29/XBP1/EEF1A2/CHMP4B/SRPX/NPRL3/TSC2/MEFV/PYCARD/SNRNP70/GSK3A/MET/NOD1/HSPB1/TRIM14/MAPK8/ACBD5/HSPA8/EIF4G2/IFNG/IL4/SNX4/ATP6V1A/TMEM59/PARK7/ELAPOR1/LEPR/MFN2/ATP6V0B/VAMP8/FOXO3/STBD1/CLU/CAPNS1/BECN1/ATG14/KDR/SESN2/CHMP1A/VPS25/C19orf12/TRIM5/TRIM22/PRKAA1/TBC1D14/SYT11/ARL8B/PTPN22/SNX14/VPS36/IL10/ATP6V1G1/GABARAPL1/TMBIM6/ULK3/IRF8/TRIM65/RETREG3/ABL2/SNAPIN/PLK2/KLHL3/TLK2/OGT/ATP6V1B2/C9orf72/SESN3/EI24/SOGA1/VPS51/FOXO1/ITPR1/VTI1A/BAG3/HSPB8/BCL2L11/UCHL1/ATP6V1C1/DRAM2/EEF1A1/TAB3/WIPI2/FYCO1/SLC25A46/CASP3/CDK5/TP53INP1/VCP/DEPP1/FUNDC2/ZFYVE1/GOLGA2/NOD2/TRIM68/UBXN6/ATG16L2/ADRB2/TRIM8/ORMDL3/SNX32/KAT5/GPR137/RNF213/ATP2A2/LEP/DDIT3/ATG13/CHMP6/TMEM39A/CDK5R1/WDR6/ERN1/YOD1/MAPK15/EXOC7/PRKN/HGS/CLN3/HMGB1/DAPK1/SRC/ATG7/SVIP/MTOR/DCAF12/RNF5/TRIM13/RIMOC1/FIS1/MAGEA3/PGAM5/IKBKG/LIX1L/PIP4K2B/SQSTM1/PRKACA | 165 |
| GO:0061919 | process utilizing autophagic mechanism | 165/3662 | 478/15509 | 2.92408e-08 | 5.06241e-07 | 3.04444e-07 | BAD/OSBPL7/DCN/UFL1/HGF/RRAGD/IFT88/ATP6V0A1/CLEC16A/PHF23/VMP1/CTSA/KDM4A/ROCK1/TBC1D25/SIRT2/VPS35/CSNK2A2/PRKACA/MARK2/MID2/GSK3B/ZMPSTE24/ATG16L1/CHMP5/DNM1L/NSFL1C/ABL1/SH3GLB1/SNAP29/XBP1/EEF1A2/CHMP4B/SRPX/NPRL3/TSC2/MEFV/PYCARD/SNRNP70/GSK3A/MET/NOD1/HSPB1/TRIM14/MAPK8/ACBD5/HSPA8/EIF4G2/IFNG/IL4/SNX4/ATP6V1A/TMEM59/PARK7/ELAPOR1/LEPR/MFN2/ATP6V0B/VAMP8/FOXO3/STBD1/CLU/CAPNS1/BECN1/ATG14/KDR/SESN2/CHMP1A/VPS25/C19orf12/TRIM5/TRIM22/PRKAA1/TBC1D14/SYT11/ARL8B/PTPN22/SNX14/VPS36/IL10/ATP6V1G1/GABARAPL1/TMBIM6/ULK3/IRF8/TRIM65/RETREG3/ABL2/SNAPIN/PLK2/KLHL3/TLK2/OGT/ATP6V1B2/C9orf72/SESN3/EI24/SOGA1/VPS51/FOXO1/ITPR1/VTI1A/BAG3/HSPB8/BCL2L11/UCHL1/ATP6V1C1/DRAM2/EEF1A1/TAB3/WIPI2/FYCO1/SLC25A46/CASP3/CDK5/TP53INP1/VCP/DEPP1/FUNDC2/ZFYVE1/GOLGA2/NOD2/TRIM68/UBXN6/ATG16L2/ADRB2/TRIM8/ORMDL3/SNX32/KAT5/GPR137/RNF213/ATP2A2/LEP/DDIT3/ATG13/CHMP6/TMEM39A/CDK5R1/WDR6/ERN1/YOD1/MAPK15/EXOC7/PRKN/HGS/CLN3/HMGB1/DAPK1/SRC/ATG7/SVIP/MTOR/DCAF12/RNF5/TRIM13/RIMOC1/FIS1/MAGEA3/PGAM5/IKBKG/LIX1L/PIP4K2B/SQSTM1/PRKACA | 165 |
| GO:1904996 | positive regulation of leukocyte adhesion to vascular endothelial cell | 22/3662 | 31/15509 | 3.15836e-08 | 5.45278e-07 | 3.27921e-07 | SELE/RHOA/NFAT5/MDK/ITGA4/IL6/ITGB2/PTAFR/RELA/SELP/IRAK1/FUT4/ELANE/TNF/TNF/TNF/TNF/TNF/TNF/TNF/TNF/ELANE | 22 |
| GO:0046967 | cytosol to endoplasmic reticulum transport | 15/3662 | 17/15509 | 3.19596e-08 | 5.50238e-07 | 3.30903e-07 | TAP1/ATP2A2/TAP2/TAP2/TAP1/TAP2/TAP2/TAP1/TAP2/TAP1/TAP1/TAP2/TAP1/TAP2/TAP2 | 15 |
| GO:0071674 | mononuclear cell migration | 81/3662 | 197/15509 | 3.25393e-08 | 5.58667e-07 | 3.35973e-07 | ITGAL/SPI1/RHOA/CDC42/TBX21/ICAM1/ABL1/PDGFB/CTSG/FLT1/CCL22/CCL17/PYCARD/IL27RA/PIK3CG/SERPINE1/CREB3/GATA3/CXCL12/C1QBP/CCL2/MDK/CALCA/NEDD9/IL4/WNT5A/CCL20/ZAP70/ITGA4/PADI2/PTK2B/CXCR4/CCR7/IL6/CCN3/CCL21/THBS1/TNFRSF11A/APP/ABL2/SLIT2/MSN/CXCL13/IL6R/CCR5/CXCR1/FADD/CX3CR1/LGALS9/PTK2/S1PR1/CCL11/CCL19/CYP7B1/PLEC/CALR/CXCR2/CSF1R/PLCB1/CSF1/HMGB1/FUT4/CD47/TNF/TNF/TNF/TNF/TNF/TNF/TNF/TNF/ITGB3/PECAM1/CCL5/CCL5/CCL4/CCL18/CCL4/CCL4/CCL18/CCL18 | 81 |
| GO:0010594 | regulation of endothelial cell migration | 71/3662 | 166/15509 | 3.42218e-08 | 5.85931e-07 | 3.52369e-07 | DCN/GRN/FLT4/ATP2B4/SP100/RHOA/FGFR1/APOH/ANGPT2/ABL1/PDGFB/CD40/GPI/PRKD2/TGFB1/PIK3CG/PTN/MET/HSPB1/GATA3/SMOC2/WNT5A/GADD45A/NRP2/TEK/PTK2B/RRAS/STAT5A/KDR/APOE/GLUL/THBS1/FGF2/EGF/EPHA2/RHOB/SLIT2/PLK2/NOTCH1/VEGFC/PRKCA/CXCL13/STC1/EMC10/NOS3/EFNA1/PTK2/SVBP/CALR/ADGRB1/CIB1/HMGB1/CSNK2B/TNF/TMSB4X/TNF/ZNF580/TNF/CSNK2B/CSNK2B/TNF/TNF/CSNK2B/TNF/TNF/TNF/CSNK2B/PDCD6/ITGB3/AKT3/GPI | 71 |
| GO:0014015 | positive regulation of gliogenesis | 39/3662 | 73/15509 | 3.45974e-08 | 5.90729e-07 | 3.55254e-07 | UFL1/TNFRSF1B/NTN1/TP73/LRP2/TGFB1/PTN/MDK/HES1/ID2/HDAC1/CXCR4/EGR2/IL1B/NKX2-2/BMP2/LIF/KRAS/SERPINE2/IL6/NOTCH1/VEGFC/SHH/DAG1/PLAG1/MTOR/TNF/TNF/LTA/TNF/LTA/TNF/TNF/TNF/TNF/LTA/LTA/TNF/LTA | 39 |
| GO:0035966 | response to topologically incorrect protein | 69/3662 | 160/15509 | 3.57348e-08 | 6.06806e-07 | 3.64922e-07 | MBTPS2/UFL1/BAK1/HSPA5/HERPUD1/EIF2AK2/ATXN3/DERL2/TMED2/PPP1R15A/BAX/BAG6/HSP90AB1/XBP1/UGGT2/BFAR/HSPB1/CREB3/TMEM33/HSPA8/CCND1/PACRG/HSPA9/HSPE1/MFN2/SERP1/CLU/TMTC4/HSPA2/CHAC1/AKIRIN2/ABCB10/DERL1/THBS1/TMBIM6/MANF/PIK3R1/DNAJB12/SERPINH1/BAG3/HSPB8/BCL2L11/PPP1R15B/ATF3/CREBRF/VCP/EIF2AK3/DDIT3/PTPN2/ERN1/YOD1/CREB3L2/PRKN/RNF5/HSPA1L/BAG6/DAXX/DAXX/HSPA1L/HSPA1L/DAXX/BAG6/DAXX/BAG6/DAXX/BAG6/HSPA1L/BAG6/HSPA1L | 69 |
| GO:0072331 | signal transduction by p53 class mediator | 69/3662 | 160/15509 | 3.57348e-08 | 6.06806e-07 | 3.64922e-07 | KDM1A/E2F2/SNAI2/CD74/CD44/USP28/HIPK2/SP100/RPS6KA6/TP63/TP73/ZMPSTE24/ATRX/BAX/MAPKAPK5/MSH2/BAG6/PYCARD/NBN/YJU2/CASP2/ZNHIT1/DDX5/MAP2K6/FOXM1/NOP2/PERP/FOXO3/TRIM24/CDKN1A/SOX4/EEF1E1/DYRK2/SESN2/EDA2R/MYBBP1A/BRCA2/PMAIP1/DYRK3/TP53BP2/PLK2/POU4F2/POU4F1/ZNF385A/RPL26/SHISA5/DDIT4/HINT1/PPM1D/TRIAP1/KAT5/AURKB/NPM1/PTTG1IP/CHEK2/KMT5A/PRKN/MUC1/HEXIM1/USP7/SPRED2/MTOR/BAG6/BAG6/BAG6/BAG6/BAG6/BOP1/MIF | 69 |
| GO:0009896 | positive regulation of catabolic process | 160/3662 | 462/15509 | 3.70158e-08 | 6.26842e-07 | 3.76972e-07 | BAD/UPF1/OSBPL7/MYLIP/DCN/PSMC4/RNF14/UFL1/IGF1/TNFRSF1B/HERPUD1/ATXN3/ROCK1/SIRT2/VPS35/NSF/MKRN2/MLH1/SIRT6/MID2/LRP2/GSK3B/TUT7/ATG16L1/BAX/PSMC5/P2RX7/HECTD1/BAG6/SH3GLB1/MARCHF2/PSMC6/SMAD7/AXIN1/NPRL3/TSC2/MEFV/SGTA/HAMP/GSK3A/NOD1/TRIM14/EXOSC3/DVL1/SH3D19/CD81/IFNG/USP5/IL4/WNT5A/SNX4/TMEM59/PARK7/ELAPOR1/CDC20/TNFAIP3/FBXL5/FOXO3/CLU/PTK2B/TARDBP/LRP1/CNOT1/IL1B/BECN1/ZFP36/KDR/CBFA2T3/APOE/SESN2/NDFIP1/TRIM5/TRIM22/PRKAA1/GRSF1/HSPBP1/APC/IL6/TTC5/SORL1/RDX/EGF/FURIN/TOB1/CSNK1D/TRIM65/APP/ARNT/DTL/POLR2D/CNOT9/PLK2/MSN/C9orf72/SESN3/FOXO1/RNF144A/BAG3/HSPB8/ZFP36L2/BCL2L11/CUL4B/CNOT11/ZC3H18/BTG2/PSMC2/DISC1/FABP1/RCHY1/FYCO1/PRKCD/TP53INP1/VCP/PSMC3/NOD2/TRIM68/GPD1/ADAM9/ADRB2/PTK2/PRKCE/TRIM8/ORMDL3/PAIP1/DCP2/KAT5/PDE12/ATG13/MAGEF1/RGMA/PRKN/ZFP36L1/YTHDF3/HMGB1/DAPK1/ATG7/SVIP/MTOR/GIGYF2/DXO/BAG6/TNF/TRIM13/TNF/TNF/TNF/BAG6/TNF/TNF/BAG6/TNF/TNF/BAG6/BAG6/GAS5/CEBPA/IKBKG/PIP4K2B/PTEN/ITCH | 160 |
| GO:0046633 | alpha-beta T cell proliferation | 34/3662 | 60/15509 | 3.7206e-08 | 6.27396e-07 | 3.77305e-07 | FOXP3/ARG2/PTPRC/ELF4/CD81/IL12B/ZAP70/TWSG1/NDFIP1/PTPN22/IL2RA/IL18/TGFBR2/SYK/LGALS9/CD28/CD55/HLA-E/HLA-E/HLA-A/HLA-A/HLA-A/HLA-A/HLA-E/HLA-A/HLA-A/HLA-E/HLA-E/HLA-A/HLA-E/HLA-A/HLA-E/PTPRC/ITCH | 34 |
| GO:0010608 | post-transcriptional regulation of gene expression | 166/3662 | 483/15509 | 3.7251e-08 | 6.27396e-07 | 3.77305e-07 | UPF1/SLC11A1/TNFRSF1B/EIF2AK2/PUM2/EIF4B/ELAVL1/PKM/RHOA/ROCK1/ELP1/MLH1/MKNK1/DDX1/BZW1/TUT7/ZMPSTE24/TMED2/PPP1R15A/MAPKAPK5/GCN1/FUS/AARS1/ALKBH5/ESR1/HNRNPC/AGO1/CIRBP/MKNK2/ZC3H7B/GZMB/ZC3H14/APEX1/PCIF1/TGFB1/DDX49/MTPN/HSPB1/EIF3B/EIF4H/EXOSC3/TRDMT1/LARP4B/CASC3/RPS6KB1/C1QBP/DDX5/DPH1/EIF4G2/DDX6/MAPK14/XRN1/EIF1B/NCL/PASK/DPH5/FOXO3/EIF2B2/NRDE2/MTRF1/PAIP2/SERP1/PTK2B/TARDBP/ZC3H7A/SOX4/CNOT1/TRAP1/ATG14/ZFP36/AJUBA/SESN2/DKC1/RARA/PER2/MYCN/ELP2/NIBAN1/EIF4E2/IL6/BZW2/IREB2/NCBP1/THBS1/CYP1B1/LARP1B/TARBP2/TOB1/EIF4A3/GRB7/APP/POLR2D/CNOT9/EGFR/EIF3H/EIF4EBP2/MTG1/CDC123/GUF1/ZFP36L2/CARHSP1/PRKCA/RMND1/USP16/EIF4A2/CNOT11/ZC3H18/PPP1R15B/BTG2/ZNF385A/RPL26/MAPKAPK2/PRKCD/TERT/FASTK/RPUSD4/TRUB1/PTAFR/ELP5/PA2G4/ENC1/EIF2AK3/PAIP1/CLP1/DCP2/EIF1/ANGEL2/PDE12/TYMS/SHMT1/CD28/CALR/TRNAU1AP/NPM1/RBM10/KLHL25/EIF3C/ZFP36L1/YTHDF3/SECISBP2/FOCAD/DAPK1/MTOR/SELENOT/SPOUT1/GIGYF2/DXO/TNF/SARNP/TNF/TNF/TNF/TNF/TNF/TNF/TNF/GAS5/EIF6/NEAT1/PRKDC/LSM14A/RBM8A/SPACA6-AS1/CCL5/CCL5/TAF15 | 166 |
| GO:0034620 | cellular response to unfolded protein | 48/3662 | 98/15509 | 3.7372e-08 | 6.27728e-07 | 3.77505e-07 | MBTPS2/UFL1/BAK1/HSPA5/HERPUD1/EIF2AK2/DERL2/TMED2/PPP1R15A/BAX/XBP1/BFAR/CREB3/TMEM33/HSPA8/CCND1/PACRG/HSPA9/SERP1/TMTC4/HSPA2/ABCB10/DERL1/TMBIM6/PIK3R1/BAG3/HSPB8/BCL2L11/PPP1R15B/ATF3/VCP/EIF2AK3/DDIT3/PTPN2/ERN1/YOD1/CREB3L2/PRKN/HSPA1L/DAXX/DAXX/HSPA1L/HSPA1L/DAXX/DAXX/DAXX/HSPA1L/HSPA1L | 48 |
| GO:0001655 | urogenital system development | 120/3662 | 325/15509 | 3.75105e-08 | 6.28351e-07 | 3.77879e-07 | HOXA11/ITGA3/PROM1/IFT88/PRDM1/SEC61A1/FGFR2/RHOA/HYAL2/TP63/GLI2/NOTCH3/ITGA8/HOXA9/TP73/ARG2/LRP2/HSPB11/ZMPSTE24/BAX/MMP2/ESR1/ANGPT2/BAG6/PDGFB/MMP9/BMP7/SMAD7/RPGRIP1L/EYA1/SFRP1/TMEM59L/TGFBR1/GATA3/ACTA2/ZBTB16/SMAD5/PDGFRB/NPHP3/WNT5A/HES1/SNX17/STAT1/ODC1/SDC1/PKD2/HELLS/TEK/EGR1/CAT/SOX4/NUP85/BMP2/LIF/PODXL/ALDH1A2/FOXJ1/LAMA5/ASS1/RARA/EPHB2/NOTCH2/LRP4/PDGFRA/AHI1/EDNRB/TFAP2A/SMAD6/CYP19A1/ARL3/PLCE1/FGF2/ENPEP/GREB1L/SMAD4/REN/SLIT2/ADAMTS16/KLHL3/NOTCH1/ARID5B/FREM2/BCL2L11/BMP6/ADAMTS1/IL6R/WNT4/VANGL2/PYGO2/HEYL/SHH/TTC8/FRS2/FADD/LAMB2/ZNG1A/CYP7B1/RARG/SMAD2/CTNNBIP1/CXCR2/ADIPOQ/PLAG1/EPHB3/NOG/PBX1/MAGI2/WNT7B/MME/KANK2/BAG6/BAG6/BAG6/BAG6/BAG6/HOXA10/ITGB3/PECAM1/CD24/PTEN | 120 |
| GO:0002687 | positive regulation of leukocyte migration | 65/3662 | 148/15509 | 3.79187e-08 | 6.33478e-07 | 3.80963e-07 | CD74/F7/SPI1/RHOA/DNM1L/ICAM1/ABL1/PYCARD/PTN/SERPINE1/CREB3/CXCL12/C1QBP/MDK/NEDD9/IL4/WNT5A/IL1A/CCL20/ITGA4/PGF/PTK2B/CCR7/RAC2/IL6/CCL21/THBS1/APP/ABL2/PIK3R1/VEGFC/CXCL13/MMP14/IL6R/FADD/CX3CR1/LGALS9/PTK2/PTAFR/CXCL8/CCL19/SELP/CALR/CXCR2/CSF1R/CSF1/ZP3/HMGB1/FUT4/CD47/TNF/TNF/ZNF580/TNF/TNF/TNF/TNF/TNF/TNF/ITGB3/CCL5/CCL5/CCL4/CCL4/CCL4 | 65 |
| GO:2001236 | regulation of extrinsic apoptotic signaling pathway | 64/3662 | 145/15509 | 3.82375e-08 | 6.37085e-07 | 3.83132e-07 | IGF1/SNAI2/HGF/TRAF1/SP100/HYAL2/FGFR1/PTPRC/GSK3B/ICAM1/SRPX/GATA1/PYCARD/EYA1/SFRP1/IL7/SERPINE1/TGFBR1/UNC5B/RPS6KB1/EYA4/IL4/IL1A/PARK7/TNFAIP3/TNFSF10/INHBA/IL1B/RBCK1/PSME3/ITM2C/THBS1/ITGAV/COL2A1/PMAIP1/TCF7L2/FAIM/LMNA/PEA15/ATF3/PF4/TERT/CSF2/GPER1/NOS3/PRDX2/FADD/BCL2L1/FGG/FGA/SCG2/RELA/PAK2/SRC/TNF/TNF/TNF/TNF/TNF/TNF/TNF/TNF/PTPRC/PTEN | 64 |
| GO:1904994 | regulation of leukocyte adhesion to vascular endothelial cell | 25/3662 | 38/15509 | 3.92109e-08 | 6.51553e-07 | 3.91832e-07 | SELE/RHOA/NFAT5/CXCL12/MDK/ITGA4/IL6/CCL21/ITGB2/PTAFR/RELA/SELP/ZDHHC21/IRAK1/FUT4/ELANE/TNF/TNF/TNF/TNF/TNF/TNF/TNF/TNF/ELANE | 25 |
| GO:0010632 | regulation of epithelial cell migration | 88/3662 | 220/15509 | 3.93805e-08 | 6.52249e-07 | 3.92251e-07 | ITGA3/DCN/GRN/FLT4/ATP2B4/SP100/RHOA/FGFR1/APOH/ANGPT2/ABL1/PDGFB/MMP9/CD40/RAB11A/GPI/PRKD2/TGFB1/PIK3CG/PTN/MET/HSPB1/GATA3/CORO1C/IFNG/SMOC2/HBEGF/IL4/WNT5A/GADD45A/NRP2/TEK/PTK2B/RRAS/STAT5A/KDR/APOE/GLUL/THBS1/FGF2/EGF/EPHA2/DUSP10/RHOB/SLIT2/PLK2/NOTCH1/VEGFC/PRKCA/CXCL13/STC1/ADIPOR1/EMC10/TGFBR2/NOS3/MAPRE2/ADAM9/EFNA1/PTK2/PRKCE/JUN/SVBP/CALR/ADGRB1/CIB1/HMGB1/SRC/MTOR/CSNK2B/TNF/TMSB4X/TNF/ZNF580/TNF/CSNK2B/CSNK2B/TNF/TNF/CSNK2B/TNF/TNF/TNF/CSNK2B/PDCD6/ITGB3/AKT3/GPI/PTEN | 88 |
| GO:0002639 | positive regulation of immunoglobulin production | 32/3662 | 55/15509 | 3.95022e-08 | 6.52249e-07 | 3.92251e-07 | BTK/TBX21/MLH1/IL4R/PTPRC/MSH2/XBP1/CD40/GPI/TGFB1/EXOSC3/NSD2/HPX/IL4/IL5/CD86/SHLD2/EPHB2/IL6/IL10/IL21/TNFSF13/CD28/HLA-E/HLA-E/HLA-E/HLA-E/HLA-E/HLA-E/HLA-E/PTPRC/GPI | 32 |
| GO:0002347 | response to tumor cell | 30/3662 | 50/15509 | 3.95685e-08 | 6.52249e-07 | 3.92251e-07 | DLEC1/SPI1/AHR/IL12B/CD160/TNFRSF10B/NECTIN2/NOTCH2/IGFBPL1/RBMS3/NOTCH1/MR1/PRDX2/RELA/PRF1/MICA/HMGB1/DAPK1/HLA-A/HLA-A/HLA-A/HLA-A/HLA-A/HLA-A/MICA/HLA-A/MICA/MICA/HLA-A/TXNIP | 30 |
| GO:1990874 | vascular associated smooth muscle cell proliferation | 37/3662 | 68/15509 | 4.07845e-08 | 6.7051e-07 | 4.03233e-07 | IGF1/RHOA/MMP2/PDGFB/MMP9/BMPR1A/MFN2/NR4A3/GNA13/CDKN1A/DNMT1/IL10/FGF2/GNA12/GJA1/ADAMTS1/LDLRAP1/TERT/GPER1/NDRG2/FRS2/DDIT3/JUN/ERN1/ADIPOQ/RBM10/SRC/MAP3K5/TNF/TNF/TNF/TNF/TNF/TNF/TNF/TNF/PTEN | 37 |
| GO:1903557 | positive regulation of tumor necrosis factor superfamily cytokine production | 50/3662 | 104/15509 | 4.21702e-08 | 6.91458e-07 | 4.15831e-07 | BTK/TYROBP/CYBA/PTPRC/MAVS/PYCARD/NOD1/HSPB1/IFNG/IL17A/IL12B/CD86/WNT5A/IL1A/CLU/TNFRSF8/AKAP12/EPHB2/CD36/IL6/TLR4/THBS1/APP/PIK3R1/MAPKAPK2/PF4/TLR3/SYK/CYBB/NOD2/FADD/LGALS9/PTAFR/CD14/CCL19/LEP/LPL/PTPN11/CARD9/HMGB1/HLA-E/HLA-E/HLA-E/HLA-E/ORM1/HLA-E/HLA-E/HLA-E/PTPRC/MIF | 50 |
| GO:0002643 | regulation of tolerance induction | 24/3662 | 36/15509 | 5.00395e-08 | 8.1617e-07 | 4.9083e-07 | FOXP3/CLC/FOXJ1/IL2RA/TGFBR2/LILRB4/HMGB1/HLA-G/HLA-B/HLA-G/HLA-B/HLA-B/HLA-B/HLA-G/HLA-B/HLA-G/HLA-G/HLA-G/HLA-G/LILRB4/HLA-G/LILRB4/LILRB4/ITCH | 24 |
| GO:0045671 | negative regulation of osteoclast differentiation | 24/3662 | 36/15509 | 5.00395e-08 | 8.1617e-07 | 4.9083e-07 | LTF/SFRP1/LILRB1/IL4/IAPP/LRRC17/PIAS3/TLR4/TCTA/PIK3R1/TLR3/TNFRSF11B/INPP5D/GPR137/LILRB4/MAFB/LILRB1/LILRB4/LILRB1/LILRB1/LILRB1/LILRB4/LILRB4/INPP5D | 24 |
| GO:0071346 | cellular response to interferon-gamma | 55/3662 | 119/15509 | 5.06108e-08 | 8.23322e-07 | 4.95131e-07 | SP100/CDC42/IL12RB1/HCK/CCL22/CCL17/RPS6KB1/CCL2/HPX/IFNG/IL12B/WNT5A/CCL20/STAT1/FASLG/ARG1/ASS1/STXBP1/TLR4/CCL21/ACTR2/IRF8/GSN/CDC42EP2/GBP5/ADAMTS13/JAK1/TLR3/LGALS9/KIF5B/CCL11/CCL19/PDE12/PTPN2/SOCS1/DAPK1/CD47/TNF/TNF/TNF/TNF/TNF/TNF/TNF/HLA-DPA1/TNF/CCL5/CCL5/CCL4/CCL18/CCL4/CCL4/CCL18/CCL18/ADAMTS13 | 55 |
| GO:0014009 | glial cell proliferation | 33/3662 | 58/15509 | 5.15434e-08 | 8.36299e-07 | 5.02935e-07 | UFL1/NTN1/AREG/HES1/LEPR/CLU/PTK2B/SOX4/IL1B/KRAS/IL6/RB1/NOTCH1/VEGFC/SKI/SHH/PLAG1/CSF1R/CSF1/NF2/TNF/TNF/LTA/TNF/LTA/TNF/TNF/TNF/TNF/LTA/LTA/TNF/LTA | 33 |
| GO:0061756 | leukocyte adhesion to vascular endothelial cell | 31/3662 | 53/15509 | 5.42619e-08 | 8.75821e-07 | 5.26703e-07 | SELE/RHOA/ROCK1/ADD2/NFAT5/CXCL12/MDK/ITGA4/IL6/CCL21/ITGB1/ITGB2/VCAM1/CX3CR1/PTAFR/RELA/SELP/LEP/ZDHHC21/IRAK1/FUT4/ELANE/TNF/TNF/TNF/TNF/TNF/TNF/TNF/TNF/ELANE | 31 |
| GO:1904894 | positive regulation of receptor signaling pathway via STAT | 31/3662 | 53/15509 | 5.42619e-08 | 8.75821e-07 | 5.26703e-07 | PIBF1/TGFB1/IL12B/IL4/IL5/HES1/PTK2B/IL6/IL10/CYP1B1/NOTCH1/KIT/ADIPOR1/IL6R/LEP/F2/F2R/SOCS1/TNF/CRLF2/TNF/TNF/TNF/TNF/TNF/TNF/TNF/IL10RB/GH1/CCL5/CCL5 | 31 |
| GO:0048285 | organelle fission | 163/3662 | 475/15509 | 5.55682e-08 | 8.94575e-07 | 5.37982e-07 | CDC27/BAZ1B/DCN/IGF1/SPAST/ARID1B/RAD51/MSH4/RHOA/SIRT2/VPS35/CDC42/SMC1A/NDE1/ACTB/MLH1/SPAG5/NDC80/PIBF1/ATRX/SEH1L/RAD54L/CHMP5/ZW10/DNM1L/TPX2/NSFL1C/ANAPC5/BIRC5/NUDC/KIF4A/CDC6/BAG6/BCL7C/SMARCB1/PDGFB/CCNB1IP1/MYBL2/BMP7/CDC25B/CHMP4B/UBE2I/RAB11A/ARHGEF10/CCNE1/BCCIP/SMC3/SMARCD2/CORO1C/BCL7A/FBXO5/CUL9/RAD50/MACROH2A1/PDGFRB/SMC4/KAT2B/WNT5A/IL1A/CDC20/NSL1/ARID1A/SLF2/MASTL/TEX14/NAA50/PDS5A/CENPK/OBSL1/KLHDC3/IL1B/BECN1/HSPA2/PIN1/PKMYT1/KDR/LIF/MAU2/CEP85/CHMP1A/TOP2A/BRME1/AP3B1/CCNA1/CCNB1/PSRC1/CDCA8/APC/BORA/NUMA1/NUSAP1/KIF23/ACTR2/CENPE/EGF/BRCA2/RB1/KIF2C/CENPC/BOD1/NCAPG2/MKI67/SPC25/BCL2L11/SMARCA5/SYCP2L/EME1/USP16/WNT4/PEX19/MAP9/SLC25A46/REEP3/RPL10L/BRD7/GOLGA2/MFF/BUB1/CENPX/PDE3A/KAT5/TDRD12/ZWILCH/CCNE2/BANF1/AURKAIP1/CHMP6/ANKLE2/MIEF2/CD28/RMI1/AURKB/CALR/MAPK15/PLCB1/CHEK2/KMT5A/PRKN/DRG1/ARID2/BAG6/TNF/SYCE1L/TNF/FIS1/TNF/TNF/BAG6/TNF/TNF/BAG6/TNF/TNF/BAG6/BAG6/KIFC1/PDXP/MTFP1/PGAM5/LSM14A/SMARCB1/NDE1/SPICE1 | 163 |
| GO:0072593 | reactive oxygen species metabolic process | 86/3662 | 215/15509 | 5.5968e-08 | 8.98677e-07 | 5.40449e-07 | MPO/NOX1/TYROBP/CYBA/RHOA/PDK3/SIRT2/ARG2/NOX4/P2RX7/PDGFB/BMP7/ACP5/TGFB1/SH3PXD2A/CRYAB/FOXM1/MAPK14/NNT/PDGFRB/PARK7/GADD45A/PRDX1/FOXO3/PTK2B/CAT/SIRT5/CDKN1A/BECN1/TRAP1/RAC2/PXDN/SESN2/SFTPD/CD36/TLR4/TFAP2A/THBS1/CYP1B1/CYP1A1/CYP1A2/PMAIP1/SOD1/CCN1/FOXO1/NDUFC2/FANCC/ITGB2/TGFBR2/PRKCD/STK17A/NOS3/SYK/CYBB/PRDX2/DDIT4/ITGAM/SLC25A33/LEP/GRIN1/GRB2/F2/NQO1/ADGRB1/PRKN/AKR1C3/SLC5A3/TNF/CD177/TNF/GPX3/NDUFS3/HBE1/HBD/TNF/TNF/TNF/TNF/TNF/TNF/EIF6/HBB/HP/LOC102724560/AATF/TPO | 86 |
| GO:0031663 | lipopolysaccharide-mediated signaling pathway | 36/3662 | 66/15509 | 5.70278e-08 | 9.10975e-07 | 5.47844e-07 | LTF/SPI1/NFKBIA/HCK/TGFB1/CCL2/MAPK14/TNFAIP3/IL1B/IRF3/TRIM5/PTPN22/CD36/TLR4/IL18/BMP6/PRKCA/NOS3/PRDX2/PTAFR/CD14/PRKCE/IRAK1/SIGIRR/CD55/TNF/TNF/TNF/TNF/TNF/TNF/TNF/TNF/CCL5/CCL5/MIF | 36 |
| GO:0061614 | miRNA transcription | 36/3662 | 66/15509 | 5.70278e-08 | 9.10975e-07 | 5.47844e-07 | NGFR/SPI1/PDGFB/TGFB1/GATA3/BMPR1A/DDX5/PPARD/MYB/FOXO3/EGR1/BMP2/RARA/IL10/SMAD6/FGF2/SMAD4/TERT/FOS/RELA/FOSL1/JUN/LILRB4/TEAD1/MRTFA/TNF/TNF/TNF/TNF/TNF/TNF/TNF/TNF/LILRB4/LILRB4/LILRB4 | 36 |
| GO:0009410 | response to xenobiotic stimulus | 139/3662 | 392/15509 | 5.87573e-08 | 9.35803e-07 | 5.62775e-07 | BAD/CD38/ITGA3/CPS1/ABCC2/BAK1/CDH1/HSPA5/RAD51/CYBA/KCNQ1/KCNH2/CDH3/PDE4A/RHOA/TP73/XRCC5/OXCT1/ABCB1/RAD54L/MMP2/P2RX7/HSP90AB1/ABL1/CYP2D6/CBX7/APEX1/NFATC2/ABCC1/SFRP1/CYP3A5/AHR/ENG/GATA3/RPS6KB1/RECQL5/ABCC3/EFTUD2/MAP2K6/CCND1/MDK/SLCO1B3/STAT1/IGFBP2/ARG1/FOXO3/PGF/DNMT3A/PTK2B/CAT/CXCR4/INHBA/ABCC4/IL1B/FOSB/BECN1/CYP2E1/ASS1/PRKAA1/GSTM1/IL10/TPMT/THBS1/CYP1B1/RB1/CYP1A1/CYP1A2/SOD1/GUK1/EPHX1/REN/GNA12/ALAD/GSTO1/VEGFC/UCHL1/XPC/NAT2/CBR3/CYP3A4/RNF149/ATP1A1/TGFBR2/CASP3/TLR3/ADCY1/TNFRSF11B/CYBB/CYP2C19/MCM7/NNMT/SRP68/ABCA3/CDK1/FOS/MGMT/NAT1/PDE3A/CES3/LPL/FOSL1/GRIN1/TYMS/JUN/CALR/OXTR/NQO1/ADIPOQ/SLC8A1/CHEK2/PDE4B/KCNJ11/CARD9/BLOC1S3/SRC/CYP2B6/NTRK1/PNP/TNF/TNF/LTA/TNF/LTA/TNF/TNF/TNF/TNF/LTA/LTA/TNF/LTA/ITGB3/TXNIP/CYP2D6/CYP2D6/ABCC1/CYP2D6/CYP2D6/CYP2D6 | 139 |
| GO:0071902 | positive regulation of protein serine/threonine kinase activity | 85/3662 | 212/15509 | 5.8884e-08 | 9.35803e-07 | 5.62775e-07 | DBF4/LTF/ATP2B4/RHOA/FGFR1/PTPRC/NOX4/P2RX7/CCNK/CDC6/HSP90AB1/PDGFB/TCL1A/CD40/CD40LG/FLT1/AXIN1/CSK/TGFB1/PIK3CG/EZH2/BMPR1A/DKK1/MAP2K6/CCND1/FZD10/IFNG/CCND3/PPP2CA/PDGFRB/WNT5A/PKD2/PTK2B/FLT3/IL1B/BMP2/AJUBA/CCNB1/PSRC1/SPRY2/TLR4/THBS1/FGF2/EGF/MAP3K12/TNFRSF11A/CALM2/PDGFC/EGFR/HMGA2/KIT/CALM3/DVL3/DBF4B/RICTOR/SYK/NOD2/ADAM9/ADRB2/CCL19/CKS1B/HRAS/FZD4/CDK5R1/ERN1/ADIPOQ/CSF1R/IRAK1/CIB1/SRC/MAP3K5/ELANE/TNF/TNF/TNF/TNF/TNF/TNF/TNF/TNF/GH1/PTPRC/CD24/MIF/ELANE | 85 |
| GO:0070482 | response to oxygen levels | 116/3662 | 314/15509 | 6.09635e-08 | 9.66373e-07 | 5.8116e-07 | BAD/CD38/NOX1/FAS/CASR/CYBA/F7/HIPK2/RHOA/PDK3/SIRT2/ATP6AP1/MMP2/ALKBH5/ANGPT2/BMP7/SFRP1/PLAT/CXCL12/CRYAB/SLC11A2/PPARD/SLC29A1/PDGFRB/ATP6V1A/IL1A/EPAS1/SLC2A1/MPL/FOXO3/PGF/DNMT3A/EGR1/PTK2B/CAT/CXCR4/BMP2/BECN1/PIN1/HP1BP3/GNGT1/AJUBA/CBFA2T3/EPO/PRKAA1/LOXL2/ATP6V1G1/THBS1/TMBIM6/BNIP2/CYP1A1/SMAD4/PMAIP1/ARNT/PKLR/PSEN2/CCNA2/ALAD/NOTCH1/VEGFC/FOXO1/ITPR1/POU4F2/NR4A2/DDAH1/MMP14/ALAS2/NDUFS2/STC1/LMNA/AK4/VCAM1/CAPN2/ERCC3/TGFBR2/FABP1/CASP3/TERT/CYBB/AQP3/HIF1AN/DDIT4/RBPJ/FOS/PRKCE/ARNT2/LEP/OXTR/ADIPOQ/SLC8A1/IRAK1/ZFP36L1/P2RX2/SRC/ATG7/DPP4/MTOR/TNF/TNF/LTA/TNF/LTA/TNF/TNF/TNF/TNF/LTA/LTA/TNF/LTA/ADSL/TMEM199/PKLR/CD24/LOC102724560/PTEN | 116 |
| GO:0014013 | regulation of gliogenesis | 50/3662 | 105/15509 | 6.21629e-08 | 9.82871e-07 | 5.91081e-07 | TMEM98/UFL1/TNFRSF1B/NTN1/KDM4A/SIRT2/TP73/LRP2/TGFB1/PTN/EZH2/MDK/HES1/ID2/HDAC1/CXCR4/EGR2/IL1B/NKX2-2/BMP2/NR1D1/LIF/KRAS/SERPINE2/IL6/RB1/DUSP10/NOTCH1/VEGFC/SKI/SHH/DAG1/F2/PLAG1/NOG/NF2/MTOR/TNF/TNF/LTA/TNF/LTA/TNF/TNF/TNF/TNF/LTA/LTA/TNF/LTA | 50 |
| GO:0045581 | negative regulation of T cell differentiation | 26/3662 | 41/15509 | 6.44511e-08 | 1.01646e-06 | 6.1128e-07 | CD74/RUNX3/FOXP3/CBFB/TBX21/IL4R/SMAD7/JAK3/MDK/IL4/BCL6/FOXJ1/HLX/RUNX1/CTLA4/SHH/PRDX2/RAG2/PTPN2/SOCS1/LILRB4/HMGB1/NRARP/LILRB4/LILRB4/LILRB4 | 26 |
| GO:0002763 | positive regulation of myeloid leukocyte differentiation | 34/3662 | 61/15509 | 6.50316e-08 | 1.02301e-06 | 6.1522e-07 | CD4/TYROBP/CD74/ACIN1/TGFB1/IFNG/NEDD9/IL17A/IL12B/IL5/ID2/LIF/NOTCH2/RB1/POU4F2/POU4F1/PRKCA/KLF10/RUNX1/PF4/SLC9B2/FADD/FOS/CTNNBIP1/CSF1/ZFP36L1/TNF/TNF/TNF/TNF/TNF/TNF/TNF/TNF | 34 |
| GO:0018209 | peptidyl-serine modification | 112/3662 | 301/15509 | 6.61392e-08 | 1.0378e-06 | 6.24114e-07 | DYRK4/DCN/CLK1/HGF/CD44/BAK1/FNIP2/HPF1/ATP2B4/HIPK2/ROCK1/PDK3/CSNK2A2/PRKACA/RPS6KA6/MARK2/MKNK1/GSK3B/MAST2/BAX/MAPKAPK5/HSP90AB1/CDC7/MKNK2/OSM/PDGFB/TCL1A/RASSF2/SMAD7/AXIN1/PRKD2/TGFB1/GSK3A/TGFBR1/MAPK8/DKK1/CSF3/RPS6KB1/IFNG/MAPK14/PDE4D/WNT5A/GALNT3/PARK7/GADD45A/MASTL/PKN1/DYRK2/LIF/EPO/PRKAA1/NGF/SRPK2/SPRY2/IL6/MAP3K12/ULK3/ARRB2/CSNK1D/APP/DYRK3/CNOT9/PLK2/EGFR/TLK2/NTRK2/CNKSR3/PRKCA/DMTN/PKN3/SPTBN4/BRSK1/MAPKAPK2/IL24/POGLUT1/TGFBR2/PRKCD/EGFLAM/RICTOR/CDK5/SYK/NSD1/STK32C/DDIT4/CDK1/PRKCE/EIF2AK3/BRSK2/BDNF/CDK5R1/ERN1/PAK2/CHEK2/INPP5J/SPOCK3/SRC/IFNA1/MTOR/TNF/TNF/CHUK/TNF/TNF/TNF/TNF/TNF/TNF/PRKDC/AKT3/MIF/PTEN/PRKACA | 112 |
| GO:0032945 | negative regulation of mononuclear cell proliferation | 46/3662 | 94/15509 | 7.39226e-08 | 1.15409e-06 | 6.94047e-07 | BTK/TYROBP/FOXP3/FCGR2B/ARG2/LILRB1/CD86/ARG1/CD80/PKN1/TWSG1/FOXJ1/NDFIP1/SFTPD/IL2RA/IL10/TNFRSF21/CTLA4/CASP3/SHH/INPP5D/LGALS9/CEBPB/GLMN/LILRB4/PDCD1LG2/CR1/HLA-G/HLA-G/HLA-G/HLA-G/HLA-G/HLA-G/HLA-G/TNFRSF13B/LILRB1/LILRB4/HLA-G/LILRB1/LILRB1/LILRB1/LILRB4/LILRB4/INPP5D/PTEN/ITCH | 46 |
| GO:0050672 | negative regulation of lymphocyte proliferation | 46/3662 | 94/15509 | 7.39226e-08 | 1.15409e-06 | 6.94047e-07 | BTK/TYROBP/FOXP3/FCGR2B/ARG2/LILRB1/CD86/ARG1/CD80/PKN1/TWSG1/FOXJ1/NDFIP1/SFTPD/IL2RA/IL10/TNFRSF21/CTLA4/CASP3/SHH/INPP5D/LGALS9/CEBPB/GLMN/LILRB4/PDCD1LG2/CR1/HLA-G/HLA-G/HLA-G/HLA-G/HLA-G/HLA-G/HLA-G/TNFRSF13B/LILRB1/LILRB4/HLA-G/LILRB1/LILRB1/LILRB1/LILRB4/LILRB4/INPP5D/PTEN/ITCH | 46 |
| GO:0060558 | regulation of calcidiol 1-monooxygenase activity | 13/3662 | 14/15509 | 7.63205e-08 | 1.18853e-06 | 7.1476e-07 | CYP27B1/VDR/IFNG/IL1B/GFI1/TNF/TNF/TNF/TNF/TNF/TNF/TNF/TNF | 13 |
| GO:0006417 | regulation of translation | 126/3662 | 349/15509 | 7.67305e-08 | 1.19192e-06 | 7.16799e-07 | UPF1/EIF2AK2/PUM2/EIF4B/ELAVL1/PKM/RHOA/ROCK1/ELP1/MLH1/MKNK1/DDX1/BZW1/TUT7/TMED2/PPP1R15A/MAPKAPK5/GCN1/AARS1/AGO1/CIRBP/MKNK2/GZMB/PCIF1/MTPN/HSPB1/EIF3B/EIF4H/EXOSC3/LARP4B/CASC3/RPS6KB1/C1QBP/DPH1/EIF4G2/DDX6/XRN1/EIF1B/NCL/PASK/DPH5/FOXO3/EIF2B2/MTRF1/PAIP2/SERP1/PTK2B/TARDBP/SOX4/CNOT1/TRAP1/ZFP36/SESN2/RARA/PER2/ELP2/NIBAN1/EIF4E2/IL6/BZW2/IREB2/NCBP1/THBS1/CYP1B1/LARP1B/TARBP2/TOB1/EIF4A3/GRB7/APP/POLR2D/CNOT9/EIF3H/EIF4EBP2/MTG1/CDC123/GUF1/ZFP36L2/RMND1/USP16/EIF4A2/CNOT11/PPP1R15B/BTG2/ZNF385A/RPL26/RPUSD4/PTAFR/ELP5/PA2G4/ENC1/EIF2AK3/PAIP1/DCP2/EIF1/PDE12/TYMS/SHMT1/CD28/CALR/TRNAU1AP/NPM1/KLHL25/EIF3C/ZFP36L1/YTHDF3/SECISBP2/DAPK1/MTOR/SELENOT/GIGYF2/TNF/SARNP/TNF/TNF/TNF/TNF/TNF/TNF/TNF/EIF6/PRKDC/LSM14A/RBM8A/CCL5/CCL5 | 126 |
| GO:0002923 | regulation of humoral immune response mediated by circulating immunoglobulin | 22/3662 | 32/15509 | 7.84563e-08 | 1.21568e-06 | 7.31089e-07 | FCGR2B/PTPRC/FCER2/HPX/FOXJ1/NOD2/CD55/CR1/TNF/TNF/LTA/TNF/LTA/TNF/TNF/TNF/TNF/LTA/LTA/TNF/LTA/PTPRC | 22 |
| GO:0032755 | positive regulation of interleukin-6 production | 47/3662 | 97/15509 | 7.8753e-08 | 1.21703e-06 | 7.31901e-07 | BTK/TYROBP/CD74/POU2F2/CYBA/HYAL2/MAVS/P2RX7/XBP1/TLR8/PYCARD/NOD1/POU2AF1/IFNG/IL17A/WNT5A/IL1A/IL1B/CD36/AKIRIN2/IL6/TLR4/APP/IL6R/TLR3/SYK/NOD2/LGALS9/PTAFR/IL16/LEP/LPL/PTPN11/F2R/CARD9/HMGB1/IL1RAP/TLR7/MBP/TNF/TNF/TNF/TNF/TNF/TNF/TNF/TNF | 47 |
| GO:0007254 | JNK cascade | 72/3662 | 172/15509 | 7.89361e-08 | 1.21703e-06 | 7.31901e-07 | WNT16/PAFAH1B1/NOX1/MAPK8IP2/CASR/FLT4/TRAF1/HIPK2/MAP2K4/FCGR2B/TRAF4/MECOM/GADD45B/BIRC7/RASSF2/AXIN1/PYCARD/SFRP1/NOD1/FKTN/AMBP/MAPK8/WNT5A/IL1A/GADD45A/PTK2B/IL1B/CCR7/PRMT1/EDA2R/TRAF3/MEN1/PTPN22/MDFIC/TLR4/CCL21/MAP3K12/IGF1R/APP/DUSP10/EGFR/MBIP/TLR3/NOD2/GPS1/CCL19/HRAS/PLCB1/IRAK1/PRKN/CARD9/WNT7B/HMGB1/TLR7/MAP3K5/TNF/DAXX/DAXX/TNF/TNF/DAXX/TNF/TNF/TNF/DAXX/TNF/DAXX/TNF/NAIP/NAIP/NAIP/ITCH | 72 |
| GO:0018105 | peptidyl-serine phosphorylation | 106/3662 | 282/15509 | 8.14207e-08 | 1.25101e-06 | 7.52336e-07 | DYRK4/CLK1/HGF/CD44/BAK1/FNIP2/ATP2B4/HIPK2/ROCK1/PDK3/CSNK2A2/PRKACA/RPS6KA6/MARK2/MKNK1/GSK3B/MAST2/BAX/MAPKAPK5/HSP90AB1/CDC7/MKNK2/OSM/PDGFB/TCL1A/RASSF2/SMAD7/AXIN1/PRKD2/TGFB1/GSK3A/TGFBR1/MAPK8/DKK1/CSF3/RPS6KB1/IFNG/MAPK14/PDE4D/WNT5A/PARK7/GADD45A/MASTL/PKN1/DYRK2/LIF/EPO/PRKAA1/NGF/SRPK2/SPRY2/IL6/MAP3K12/ULK3/ARRB2/CSNK1D/APP/DYRK3/CNOT9/PLK2/EGFR/TLK2/NTRK2/CNKSR3/PRKCA/DMTN/PKN3/SPTBN4/BRSK1/MAPKAPK2/IL24/TGFBR2/PRKCD/RICTOR/CDK5/SYK/NSD1/STK32C/DDIT4/CDK1/PRKCE/EIF2AK3/BRSK2/BDNF/CDK5R1/ERN1/PAK2/CHEK2/INPP5J/SRC/IFNA1/MTOR/TNF/TNF/CHUK/TNF/TNF/TNF/TNF/TNF/TNF/PRKDC/AKT3/MIF/PTEN/PRKACA | 106 |
| GO:1904951 | positive regulation of establishment of protein localization | 109/3662 | 292/15509 | 8.15438e-08 | 1.25101e-06 | 7.52336e-07 | BAD/CD38/IGF1/CASR/CDH1/NNAT/IPO5/HYAL2/VPS35/CSNK2A2/PRKACA/SIRT6/PCM1/GSK3B/OXCT1/ACHE/DNM1L/MAVS/P2RX7/HSP90AB1/SH3GLB1/GZMB/PCK2/PARD6A/KCNN4/PDCD5/TGFB1/CD33/GSK3A/MAPK8/PPP3CB/ZPR1/CD81/PSMD9/IFNG/PPARD/MAPK14/TMEM30A/APBB3/IL1A/SERP1/TARDBP/ACSL3/SOX4/IL1B/ERGIC3/RAC2/DKC1/PRKAA1/XPO4/CCT7/GLUL/NMT1/TLR4/ANP32B/SORL1/CEP131/SAE1/PIK3R1/GLUD1/TCF7L2/VEGFC/BAG3/BMP6/ITGB2/PCNT/BAP1/PRKCD/SHH/GPER1/CDK5/CCT2/CHP2/ADAM9/MFF/ITGAM/CDK1/PRKCE/FGG/FGA/LEP/HRAS/CEP135/PDZK1/ATG13/CDK5R1/MIEF2/PTP4A3/CIB1/UBE2L3/CLN3/PPIA/SRC/UBL5/HSPA1L/TNF/HSPA1L/TNF/FIS1/TNF/HSPA1L/TNF/TNF/TNF/TNF/TNF/HSPA1L/HSPA1L/PRKACA | 109 |
| GO:0033673 | negative regulation of kinase activity | 82/3662 | 204/15509 | 8.79689e-08 | 1.34625e-06 | 8.09611e-07 | MVP/IPO5/HYAL2/PTPRC/RTRAF/ABL1/GADD45B/PIK3IP1/GSKIP/BMP7/TSC2/PYCARD/CSK/SFRP1/HSPB1/DVL1/CHORDC1/CORO1C/SH2B3/IFNG/MACROH2A1/KAT2B/PRKAR2A/PARK7/GADD45A/TNFAIP3/PKN1/CDKN1A/IL1B/BMP2/AJUBA/CDKN1C/APOE/CEP85/VPS25/EPHB2/MEN1/PTPN22/APC/SPRY2/SORL1/TARBP2/RB1/WARS1/DUSP10/NCAPG2/HHEX/UCHL1/GNAQ/CAMK2N1/PRKCD/DUSP7/CASP3/PKIG/RGS14/PTPN2/CHMP6/PLEC/TAF7/PAK2/ADIPOQ/NPM1/SLC8A1/PRKN/NF2/LILRB4/HEXIM1/SPRY4/PPIA/AKT1S1/IPO7/DBNDD2/CEBPA/PTPRC/CDKN1C/LILRB4/PIP4K2B/LILRB4/LILRB4/LRP6/PTEN/CHORDC1 | 82 |
| GO:0070302 | regulation of stress-activated protein kinase signaling cascade | 76/3662 | 185/15509 | 8.92565e-08 | 1.36259e-06 | 8.19438e-07 | WNT16/PAFAH1B1/NOX1/MAPK8IP2/HGF/FAS/FLT4/EIF2AK2/TRAF1/HIPK2/MAP2K4/SPI1/FCGR2B/TRAF4/OPRK1/RNF13/ZMPSTE24/MECOM/GADD45B/BIRC7/RASSF2/AXIN1/PYCARD/SFRP1/NOD1/FKTN/AMBP/FOXM1/WNT5A/IL1A/GADD45A/PRDX1/PTK2B/IL1B/BMP2/CCR7/PRMT1/EDA2R/TRAF3/MEN1/PTPN22/MDFIC/TLR4/CCL21/IGF1R/APP/DUSP10/ARL6IP5/EGFR/FOXO1/MBIP/TLR3/NOD2/SEMA4C/CCL19/LEP/HRAS/PLCB1/PRKN/CARD9/WNT7B/HMGB1/PPIA/MAP3K5/TNF/TNF/TNF/TNF/TNF/TNF/TNF/TNF/NAIP/NAIP/NAIP/ITCH | 76 |
| GO:0006446 | regulation of translational initiation | 39/3662 | 75/15509 | 9.10726e-08 | 1.3869e-06 | 8.34056e-07 | EIF2AK2/EIF4B/DDX1/BZW1/TMED2/PPP1R15A/HSPB1/EIF3B/EIF4H/RPS6KB1/EIF4G2/EIF1B/EIF2B2/PAIP2/BZW2/NCBP1/POLR2D/EIF3H/EIF4EBP2/CDC123/EIF4A2/PPP1R15B/EIF2AK3/PAIP1/EIF1/NPM1/KLHL25/YTHDF3/MTOR/TNF/TNF/TNF/TNF/TNF/TNF/TNF/TNF/CCL5/CCL5 | 39 |
| GO:0043393 | regulation of protein binding | 75/3662 | 182/15509 | 9.29782e-08 | 1.41245e-06 | 8.49422e-07 | KDM1A/HFE/HIPK2/BTBD1/ROCK1/CDC42/PRKACA/MARK2/ADD2/ACTB/GSK3B/BAX/ADD1/FKBP1A/HSP90AB1/ABL1/TFIP11/PDGFB/MMP9/ADNP/TLE5/TGFBR1/DVL1/MAPK8/DKK1/CSF3/PPP2CA/NPHP3/WNT5A/ITGA4/PARK7/IFIT2/TEX14/LRP1/USP9X/CDKN1A/BMP2/ID1/PIN1/APOE/PRMT7/MEN1/IL10/DERL1/SORL1/TDG/TMBIM6/ARRB2/APP/SNAPIN/TCF7L2/SPPL3/LDLRAP1/EPB41/DISC1/SPTA1/PRKCD/TERT/CDK5/GOLGA2/NMD3/ADRB2/ATP2A2/BDNF/CTNNBIP1/AURKB/ADIPOQ/PHLDA2/RGMA/ANXA2/NOG/PRKN/SRC/B2M/PRKACA | 75 |
| GO:0072001 | renal system development | 107/3662 | 286/15509 | 9.36541e-08 | 1.41924e-06 | 8.53504e-07 | HOXA11/ITGA3/PROM1/IFT88/PRDM1/SEC61A1/FGFR2/RHOA/HYAL2/GLI2/NOTCH3/ITGA8/TP73/ARG2/LRP2/HSPB11/ZMPSTE24/BAX/ANGPT2/BAG6/PDGFB/MMP9/BMP7/SMAD7/RPGRIP1L/EYA1/SFRP1/TMEM59L/TGFBR1/GATA3/ACTA2/ZBTB16/SMAD5/PDGFRB/NPHP3/WNT5A/HES1/SNX17/STAT1/ODC1/SDC1/PKD2/HELLS/TEK/EGR1/CAT/SOX4/NUP85/BMP2/LIF/PODXL/ALDH1A2/FOXJ1/LAMA5/ASS1/RARA/NOTCH2/LRP4/PDGFRA/AHI1/EDNRB/TFAP2A/SMAD6/ARL3/PLCE1/FGF2/ENPEP/GREB1L/SMAD4/REN/SLIT2/ADAMTS16/KLHL3/NOTCH1/ARID5B/FREM2/BCL2L11/BMP6/ADAMTS1/IL6R/WNT4/VANGL2/PYGO2/HEYL/SHH/TTC8/FADD/LAMB2/ZNG1A/SMAD2/CTNNBIP1/CXCR2/ADIPOQ/NOG/PBX1/MAGI2/WNT7B/MME/KANK2/BAG6/BAG6/BAG6/BAG6/BAG6/ITGB3/PECAM1/CD24 | 107 |
| GO:0030330 | DNA damage response, signal transduction by p53 class mediator | 36/3662 | 67/15509 | 9.53288e-08 | 1.43759e-06 | 8.64539e-07 | KDM1A/SNAI2/CD74/CD44/HIPK2/SP100/RPS6KA6/ZMPSTE24/ATRX/NBN/YJU2/CASP2/ZNHIT1/DDX5/FOXM1/FOXO3/CDKN1A/SOX4/EEF1E1/SESN2/BRCA2/PMAIP1/DYRK3/PLK2/ZNF385A/RPL26/PPM1D/TRIAP1/KAT5/NPM1/PTTG1IP/CHEK2/KMT5A/MUC1/SPRED2/MIF | 36 |
| GO:1904705 | regulation of vascular associated smooth muscle cell proliferation | 36/3662 | 67/15509 | 9.53288e-08 | 1.43759e-06 | 8.64539e-07 | IGF1/RHOA/MMP2/PDGFB/MMP9/BMPR1A/MFN2/NR4A3/GNA13/CDKN1A/DNMT1/IL10/FGF2/GNA12/GJA1/ADAMTS1/LDLRAP1/TERT/GPER1/NDRG2/FRS2/JUN/ERN1/ADIPOQ/RBM10/SRC/MAP3K5/TNF/TNF/TNF/TNF/TNF/TNF/TNF/TNF/PTEN | 36 |
| GO:0062197 | cellular response to chemical stress | 115/3662 | 313/15509 | 9.73511e-08 | 1.46452e-06 | 8.80737e-07 | BAD/WNT16/MPO/NOX1/BTK/HGF/GLRX2/FAS/AIFM2/TMEM161A/MYLK/SIRT2/XRCC5/SLC25A24/MMP2/PXN/ABL1/GSKIP/APEX1/DHRS2/MMP9/BMP7/NFAT5/ABCC1/PYCARD/GSR/MET/HSPB1/EZH2/MAPK8/PPIF/EPAS1/PARK7/SLC2A1/PRDX1/TNFAIP3/ARG1/FOXO3/PKD2/NR4A3/CAT/CHD6/STAU1/SLC25A23/BECN1/TRAP1/MGAT3/EPO/SESN2/PRKAA1/PDGFRA/CD36/IL6/IL10/TLR4/IL18BP/CYP1B1/MEAK7/SOD1/ARNT/PARP1/RHOB/ARL6IP5/EGFR/NONO/FOXO1/NR4A2/FANCC/AQP5/TBC1D24/SELENON/FABP1/PRKCD/CASP3/NOS3/TP53INP1/FXN/PRDX2/LETM1/CDK1/FOS/MGMT/EIF2AK3/RELA/ATP2A2/DDIT3/JUN/PLEC/ERN1/NQO1/PRKN/ZFP36L1/CLN3/AKR1C3/PPIA/DAPK1/SRC/MAP3K5/ATG7/MTOR/ZNF277/TNF/TNF/ZNF580/CHUK/TNF/TNF/TNF/TNF/TNF/TNF/GAS5/SRXN1/PCGF2/ABCC1 | 115 |
| GO:0002920 | regulation of humoral immune response | 31/3662 | 54/15509 | 9.86272e-08 | 1.48012e-06 | 8.90121e-07 | FCGR2B/PTPRC/CD59/FCER2/C1QBP/HPX/IL17A/IL1B/C3/CCR7/FOXJ1/CXCL13/NOD2/A2M/ZP3/CD55/CR1/TNF/TNF/LTA/TNF/LTA/TNF/TNF/TNF/TNF/LTA/LTA/TNF/LTA/PTPRC | 31 |
| GO:0022612 | gland morphogenesis | 54/3662 | 118/15509 | 1.00727e-07 | 1.50798e-06 | 9.06872e-07 | SNAI2/HGF/NTN1/FGFR2/TP63/PGR/BAX/MMP2/ESR1/XBP1/BMP7/LAMA1/SFRP1/TGFB1/PTN/AREG/MDK/VDR/WNT5A/KDM5B/TNFAIP3/ARG1/TWSG1/LAMA5/NOTCH2/IL6/EPHA2/EGFR/MSN/NOTCH1/WNT4/TGFBR2/SHH/BTRC/FRS2/CCL11/CEBPB/CYP7B1/RARG/DAG1/PLAG1/CSF1R/NOG/CSF1/SRC/TGM2/TNF/TNF/TNF/TNF/TNF/TNF/TNF/TNF | 54 |
| GO:0006953 | acute-phase response | 29/3662 | 49/15509 | 1.0183e-07 | 1.51731e-06 | 9.12486e-07 | HAMP/TFR2/IL1A/FN1/IL1B/EPO/ASS1/EDNRB/IL6/TNFRSF11A/IL6R/MBL2/CEBPB/A2M/CD163/F2/SIGIRR/PLSCR1/TRPV1/TNF/TNF/TNF/TNF/TNF/TNF/ORM1/TNF/TNF/HP | 29 |
| GO:0046328 | regulation of JNK cascade | 61/3662 | 139/15509 | 1.0184e-07 | 1.51731e-06 | 9.12486e-07 | WNT16/PAFAH1B1/NOX1/MAPK8IP2/FLT4/TRAF1/HIPK2/MAP2K4/FCGR2B/TRAF4/MECOM/GADD45B/BIRC7/RASSF2/AXIN1/PYCARD/SFRP1/NOD1/FKTN/AMBP/WNT5A/IL1A/GADD45A/PTK2B/IL1B/CCR7/PRMT1/EDA2R/TRAF3/MEN1/PTPN22/MDFIC/TLR4/CCL21/IGF1R/APP/DUSP10/EGFR/MBIP/TLR3/NOD2/CCL19/HRAS/PLCB1/PRKN/CARD9/WNT7B/HMGB1/MAP3K5/TNF/TNF/TNF/TNF/TNF/TNF/TNF/TNF/NAIP/NAIP/NAIP/ITCH | 61 |
| GO:0071677 | positive regulation of mononuclear cell migration | 40/3662 | 78/15509 | 1.02757e-07 | 1.52732e-06 | 9.18501e-07 | SPI1/RHOA/ABL1/PYCARD/SERPINE1/CREB3/CXCL12/C1QBP/NEDD9/IL4/WNT5A/CCL20/ITGA4/PTK2B/CCR7/CCL21/APP/ABL2/CXCL13/FADD/CX3CR1/LGALS9/CALR/CSF1/HMGB1/CD47/TNF/TNF/TNF/TNF/TNF/TNF/TNF/TNF/ITGB3/CCL5/CCL5/CCL4/CCL4/CCL4 | 40 |
| GO:0000280 | nuclear division | 149/3662 | 430/15509 | 1.04563e-07 | 1.55044e-06 | 9.32408e-07 | CDC27/BAZ1B/IGF1/SPAST/ARID1B/RAD51/MSH4/RHOA/SIRT2/CDC42/SMC1A/NDE1/ACTB/MLH1/SPAG5/NDC80/PIBF1/ATRX/SEH1L/RAD54L/CHMP5/ZW10/TPX2/NSFL1C/ANAPC5/BIRC5/NUDC/KIF4A/CDC6/BAG6/BCL7C/SMARCB1/PDGFB/CCNB1IP1/MYBL2/BMP7/CDC25B/CHMP4B/UBE2I/RAB11A/ARHGEF10/CCNE1/BCCIP/SMC3/SMARCD2/BCL7A/FBXO5/CUL9/RAD50/MACROH2A1/PDGFRB/SMC4/KAT2B/WNT5A/IL1A/CDC20/NSL1/ARID1A/SLF2/MASTL/TEX14/NAA50/PDS5A/CENPK/OBSL1/KLHDC3/IL1B/BECN1/HSPA2/PIN1/PKMYT1/LIF/MAU2/CEP85/CHMP1A/TOP2A/BRME1/CCNA1/CCNB1/PSRC1/CDCA8/APC/BORA/NUMA1/NUSAP1/KIF23/ACTR2/CENPE/EGF/BRCA2/RB1/KIF2C/CENPC/BOD1/NCAPG2/MKI67/SPC25/BCL2L11/SMARCA5/SYCP2L/EME1/USP16/WNT4/MAP9/REEP3/RPL10L/BRD7/GOLGA2/BUB1/CENPX/PDE3A/KAT5/TDRD12/ZWILCH/CCNE2/BANF1/AURKAIP1/CHMP6/ANKLE2/CD28/RMI1/AURKB/CALR/MAPK15/PLCB1/CHEK2/KMT5A/DRG1/ARID2/BAG6/TNF/SYCE1L/TNF/TNF/TNF/BAG6/TNF/TNF/BAG6/TNF/TNF/BAG6/BAG6/KIFC1/PDXP/LSM14A/SMARCB1/NDE1/SPICE1 | 149 |
| GO:0030595 | leukocyte chemotaxis | 87/3662 | 221/15509 | 1.10237e-07 | 1.63067e-06 | 9.80657e-07 | CD74/F7/SPI1/MMP2/DNM1L/PDGFB/CTSG/FLT1/CCL22/CCL17/PIK3CG/PTN/SERPINE1/CREB3/CXCL12/C1QBP/CCL2/MDK/CALCA/NEDD9/IL4/WNT5A/CCL20/PADI2/CSF3R/PGF/PTK2B/CXCR4/NUP85/IL1B/CCR7/SBDS/RAC2/MTUS1/SFTPD/EDNRB/IL6/IL10/CCN3/CCL21/THBS1/CYP19A1/TNFRSF11A/LYST/SLIT2/VEGFC/CXCL13/KIT/ITGB2/CXCR5/IL6R/CCR5/CXCR1/PF4/SYK/NOD2/CX3CR1/LGALS9/PTK2/CXCL8/S1PR1/SCG2/CCL11/BSG/IL16/CCL19/CYP7B1/PLEC/CALR/CXCR2/CSF1R/CSF1/PDE4B/CNR2/HMGB1/PPIA/DPP4/ZNF580/CCL5/CCL5/CCL4/CCL18/CCL4/MIF/CCL4/CCL18/CCL18 | 87 |
| GO:0007260 | tyrosine phosphorylation of STAT protein | 41/3662 | 81/15509 | 1.14284e-07 | 1.68651e-06 | 1.01424e-06 | IGF1/FGFR3/PIBF1/OSM/CD40/JAK3/HPX/SH2B3/IFNG/IL12B/IL4/PPP2CA/HES1/FLT3/LIF/EPO/IL6/IL21/IL18/KIT/IL6R/JAK1/IL24/IL3/CSF2/LEP/PTPN2/CSF1R/SOCS1/NF2/TNF/TNF/TNF/TNF/TNF/TNF/TNF/TNF/GH1/CCL5/CCL5 | 41 |
| GO:0002439 | chronic inflammatory response to antigenic stimulus | 14/3662 | 16/15509 | 1.20071e-07 | 1.75934e-06 | 1.05804e-06 | IL10/TNF/TNF/LTA/TNF/LTA/TNF/TNF/TNF/TNF/LTA/LTA/TNF/LTA | 14 |
| GO:0002874 | regulation of chronic inflammatory response to antigenic stimulus | 14/3662 | 16/15509 | 1.20071e-07 | 1.75934e-06 | 1.05804e-06 | IL10/TNF/TNF/LTA/TNF/LTA/TNF/TNF/TNF/TNF/LTA/LTA/TNF/LTA | 14 |
| GO:2000343 | positive regulation of chemokine (C-X-C motif) ligand 2 production | 14/3662 | 16/15509 | 1.20071e-07 | 1.75934e-06 | 1.05804e-06 | CD74/TLR4/LPL/HMGB1/MBP/TNF/TNF/TNF/TNF/TNF/TNF/TNF/TNF/MIF | 14 |
| GO:0034976 | response to endoplasmic reticulum stress | 93/3662 | 241/15509 | 1.2298e-07 | 1.79772e-06 | 1.08112e-06 | MBTPS2/UFL1/BAK1/HSPA5/HERPUD1/EIF2AK2/RASGRF1/ATXN3/SEL1L/FCGR2B/DERL2/GSK3B/TMED2/PPP1R15A/BAX/BAG6/ABL1/XBP1/PSMC6/USP14/SRPX/UGGT2/BFAR/SGTA/CREB3/CCDC47/TMEM33/CCND1/UBE4A/MAN1A1/PARK7/SERP1/CLU/TNFRSF10B/TRIM25/TMTC4/CHAC1/SESN2/SERINC3/FBXO44/NIBAN1/ECPAS/DERL1/FAM8A1/RNF121/THBS1/TMBIM6/TMX1/PMAIP1/TMCO1/MANF/PIK3R1/ERLIN2/DNAJB12/ITPR1/BCL2L11/CLGN/USP25/PDIA4/PPP1R15B/ALOX15/ATF3/TMUB1/VCP/UBXN6/CXCL8/BCL2L1/EIF2AK3/CEBPB/ATP2A2/BRSK2/DDIT3/PTPN2/JUN/ERN1/GRINA/CALR/YOD1/CREB3L2/PRKN/MAP3K5/SVIP/UBE2J1/RNF5/BAG6/TRIM13/MAGEA3/BAG6/BAG6/BAG6/BAG6/FBXO17/MARCKS | 93 |
| GO:0001649 | osteoblast differentiation | 84/3662 | 212/15509 | 1.30111e-07 | 1.89748e-06 | 1.14111e-06 | MRC2/LTF/UFL1/IGF1/SNAI2/HGF/FGFR2/CBFB/PRKACA/TP63/GLI2/GSK3B/ACHE/HNRNPC/BMP7/RASSF2/SFRP1/FBL/BMPR1A/WNT3/CCDC47/DDX5/MAP2K6/AREG/FBXO5/MAPK14/SMAD5/HSPE1/FHL2/SPP1/CAT/RUNX2/RRBP1/BMP2/TWSG1/MYBBP1A/HSD17B4/MEN1/IL6/ITGA11/SMAD6/FGF2/FBN2/TOB1/SMAD4/EPHA2/CCN1/IGFBP3/RBMX/NOTCH1/VEGFC/CRIM1/BMP6/SKI/IL6R/PSMC2/WNT4/H3-3A/RANBP3L/SHH/TPM4/PTK2/RIOX1/CEBPB/ESRRA/FAM20C/CTNNBIP1/NOG/IFITM1/WNT7B/TNF/TNF/CEBPD/TNF/TNF/TNF/TNF/TNF/TNF/CEBPA/CRIM1/WNT3/WNT3/PRKACA | 84 |
| GO:0050729 | positive regulation of inflammatory response | 64/3662 | 149/15509 | 1.31938e-07 | 1.91961e-06 | 1.15442e-06 | BTK/GRN/KARS1/HYAL2/OSM/NFKBIA/ABCC1/PYCARD/PIK3CG/SERPINE1/CTSC/MDK/CD81/IFNG/IL12B/WNT5A/SNX4/PARK7/VAMP8/IL1B/C3/CCR7/IL6/TLR4/IL21/TNFRSF11A/APP/IL18/CAMK2N1/TLR3/CEBPB/IL16/STAT5B/LPL/CD28/ZP3/TLR7/CD47/TNF/HLA-E/TNF/HLA-E/LTA/TNF/HLA-E/LTA/TNF/TNF/TNF/HLA-E/TNF/HLA-E/LTA/LTA/TNF/HLA-E/HLA-E/LTA/NEAT1/CEBPA/NAIP/NAIP/ABCC1/NAIP | 64 |
| GO:0051960 | regulation of nervous system development | 148/3662 | 428/15509 | 1.33328e-07 | 1.93055e-06 | 1.161e-06 | KDM1A/TMEM98/IFRD1/PAFAH1B1/UFL1/HGF/TNFRSF1B/CDH1/NTN1/KDM4A/SIRT2/PLXNA2/PCM1/TP73/XRCC5/LRP2/ADNP/BMP7/TGFB1/PTN/EZH2/CXCL12/BMPR1A/DKK1/WNT3/EFNB3/CTSC/ZPR1/MDK/IFNG/DBN1/NPHP3/WNT5A/HES1/FN1/ID2/HDAC1/SPP1/CXCR4/EGR2/OBSL1/MYRF/IL1B/NKX2-2/BMP2/FLRT3/ID1/NR1D1/YWHAH/LIF/RARA/PER2/WASF3/EPHB2/KRAS/BHLHE40/NGF/LRP4/SERPINE2/IL6/DBNL/KIAA0319/SORL1/ACTR2/FGF2/CLSTN3/RB1/ST8SIA2/ITGAX/CRABP2/DUSP10/HES6/CTDSP1/SLIT2/TNFRSF21/TPBG/NTRK2/NOTCH1/PARD3/ITGB1/VEGFC/POU4F2/POU4F1/KIT/DPYSL5/SKI/FAIM/TBC1D24/DISC1/HEYL/ELAPOR2/SHH/GPER1/CDK5/CX3CR1/SEMA4C/RGS14/SEMA3E/LPAR3/MAP6/EIF2AK3/CCL11/RARG/DAG1/LIG4/BDNF/CDH4/F2/OXTR/PLAG1/ADGRB1/EPHB3/ANXA2/NOG/SS18L1/THBS2/NF2/DCC/IL1RAP/MME/SYNGAP1/MBP/NTRK1/MTOR/GPRASP3/TGM2/GDI1/TNF/TNF/LTA/TNF/LTA/TNF/TNF/TNF/TNF/LTA/LTA/TNF/LTA/TWF2/SHANK3/CUX1/B2M/NEFL/WNT3/WNT3/PTEN | 148 |
| GO:0045661 | regulation of myoblast differentiation | 35/3662 | 65/15509 | 1.33625e-07 | 1.93055e-06 | 1.161e-06 | ARID1B/ACTB/MBNL3/SMARCB1/CCL17/TGFB1/SMARCD2/PPARD/MAPK14/ARID1A/SOX4/FLOT2/BTG1/IGFBP3/NOTCH1/IL18/XKR8/RANBP3L/HIF1AN/BRD7/KAT5/DDIT3/PLCB1/ZFP36L1/ARID2/MAP3K5/TNF/TNF/TNF/TNF/TNF/TNF/TNF/TNF/SMARCB1 | 35 |
| GO:1902893 | regulation of miRNA transcription | 35/3662 | 65/15509 | 1.33625e-07 | 1.93055e-06 | 1.161e-06 | NGFR/SPI1/PDGFB/TGFB1/GATA3/BMPR1A/PPARD/MYB/FOXO3/EGR1/BMP2/RARA/IL10/SMAD6/FGF2/SMAD4/TERT/FOS/RELA/FOSL1/JUN/LILRB4/TEAD1/MRTFA/TNF/TNF/TNF/TNF/TNF/TNF/TNF/TNF/LILRB4/LILRB4/LILRB4 | 35 |
| GO:0043123 | positive regulation of I-kappaB kinase/NF-kappaB signaling | 72/3662 | 174/15509 | 1.37206e-07 | 1.97768e-06 | 1.18934e-06 | CASP10/MAP3K14/CD4/PPP5C/LTF/CD74/BIRC3/RHOA/DDX1/MID2/FKBP1A/MAVS/ABL1/CD40/VAPA/NDFIP2/UBE2I/EEF1D/NOD1/TRIM14/IL1A/FASLG/TNFRSF10B/TRIM25/TNFSF10/IL1B/RBCK1/CCR7/IRF3/AJUBA/EDA2R/NDFIP1/CC2D1A/TRIM5/TRIM22/CD36/TLR4/CCL21/PLK2/GJA1/TAB3/SHISA5/TLR3/NOD2/TRIM68/FADD/TNIP2/LGALS9/PRKCE/TRIM8/LURAP1/CCL19/RELA/TMEM9B/ADIPOQ/F2R/IRAK1/PRKN/ROR1/CARD9/MIB2/TNF/TRIM13/TNF/CHUK/TNF/TNF/TNF/TNF/TNF/TNF/IKBKG | 72 |
| GO:0051607 | defense response to virus | 101/3662 | 268/15509 | 1.41043e-07 | 2.02827e-06 | 1.21976e-06 | MAP3K14/BIRC3/FOXP3/EIF2AK2/PUM2/HYAL2/DDX1/MID2/PTPRC/OPRK1/ZMPSTE24/ATG16L1/MAVS/IL12RB1/MARCHF2/CD40/RIOK3/TLR8/PYCARD/LILRB1/C1QBP/IFNG/AICDA/IL12B/IL4/STAT1/TNFAIP3/VAMP8/IFIT2/GPAM/TRIM25/IL1B/IRF3/BECN1/IRF5/TRAF3/TRIM5/TRIM22/POLR3F/SERINC3/PTPN22/IL6/TANK/NCBP1/DDX60/PPM1B/SENP7/HERC5/IL21/TARBP2/ITGAX/ARMC5/PMAIP1/LYST/NLRX1/POLR3K/CLPB/TLR3/MBL2/HTRA1/TRIM44/FADD/DDIT4/IRF2/POLR3D/TRIM56/TRIM8/BCL2L1/RELA/PDE12/PRF1/DDX60L/SETD2/MICA/IFITM1/CARD9/PLSCR1/TLR7/PCBP2/ATG7/ATAD3A/IFNA1/TRIM13/MICB/MICB/MICB/MICB/MICA/MICB/MICA/TRIM26/MICA/MICB/IL10RB/LSM14A/PTPRC/LILRB1/LILRB1/LILRB1/LILRB1/ITCH | 101 |
| GO:0051384 | response to glucocorticoid | 59/3662 | 134/15509 | 1.42474e-07 | 2.04411e-06 | 1.22929e-06 | BAD/CPS1/PTPRU/RHOA/PCK2/PLAT/GSK3A/RPS6KB1/AREG/CCND1/MDK/IGFBP2/SDC1/ARG1/FOXO3/KLF9/FLT3/FOSB/ZFP36/CDO1/EPO/ASS1/IL6/IL10/IL1RN/CYP1B1/IGF1R/SLIT2/ALAD/ZFP36L2/BCL2L11/BMP6/STC1/CALM3/CASP3/ABCA3/DDIT4/ADAM9/PTAFR/FOS/FOSL1/A2M/TYMS/SSTR2/ADIPOQ/PAPPA/SLIT3/ZFP36L1/UBE2L3/WNT7B/TNF/TNF/TNF/TNF/TNF/TNF/TNF/TNF/NEFL | 59 |
| GO:0050869 | negative regulation of B cell activation | 23/3662 | 35/15509 | 1.42839e-07 | 2.0446e-06 | 1.22959e-06 | BTK/TYROBP/HMGB3/PARP3/FOXP3/FCGR2B/SFRP1/BCL6/ID2/TNFAIP3/INHBA/PKN1/FOXJ1/NDFIP1/IL10/TNFRSF21/CTLA4/CASP3/INPP5D/CR1/TNFRSF13B/INPP5D/PTEN | 23 |
| GO:0002765 | immune response-inhibiting signal transduction | 18/3662 | 24/15509 | 1.49973e-07 | 2.14178e-06 | 1.28803e-06 | LILRB1/CD33/LILRB4/HLA-G/HLA-G/HLA-G/HLA-G/HLA-G/HLA-G/HLA-G/LILRB1/LILRB4/HLA-G/LILRB1/LILRB1/LILRB1/LILRB4/LILRB4 | 18 |
| GO:0006913 | nucleocytoplasmic transport | 108/3662 | 292/15509 | 1.60882e-07 | 2.27304e-06 | 1.36697e-06 | UPF1/POLA2/RANBP3/CDH1/THOC3/TNPO3/IPO5/ELAVL1/SP100/HYAL2/SMG6/PRKACA/SIRT6/GSK3B/XPO1/TNPO1/SEH1L/IPO11/MAVS/ALKBH5/NUP50/HSP90AB1/RANGAP1/PABPN1/NFKBIA/FERMT1/NXT2/KPNA3/AXIN1/TSC2/UBE2I/TGFB1/TNPO2/CASC3/RANGRF/ZPR1/IFNG/MAPK14/HSPA9/KPNA1/PARK7/NRDE2/TARDBP/CRY2/EGR2/CSE1L/CDKN1A/NUP153/NUP85/IL1B/NUP210/NXT1/XPO4/IPO8/CD36/MDFIC/AKIRIN2/HNRNPA1/LTV1/NCBP1/ANP32B/ANP32A/EIF4A3/POLR2D/PIK3R1/NOTCH1/TCF7L2/BAG3/HHEX/RANBP2/HEATR3/APPL1/LMNA/NXF1/THOC7/PRKCD/RANBP3L/SHH/CDK5/SYK/NEMF/CHP2/AHCYL1/PKIG/DDX19A/RGS14/NMD3/CDK1/LEP/CALR/PTPN11/NPM1/SETD2/PTTG1IP/XPOT/IPO4/SDAD1/IPO9/SMG5/SARNP/IPO7/EIF6/RBM15B/RBM8A/TXNIP/SQSTM1/IPO4/PRKACA | 108 |
| GO:0051169 | nuclear transport | 108/3662 | 292/15509 | 1.60882e-07 | 2.27304e-06 | 1.36697e-06 | UPF1/POLA2/RANBP3/CDH1/THOC3/TNPO3/IPO5/ELAVL1/SP100/HYAL2/SMG6/PRKACA/SIRT6/GSK3B/XPO1/TNPO1/SEH1L/IPO11/MAVS/ALKBH5/NUP50/HSP90AB1/RANGAP1/PABPN1/NFKBIA/FERMT1/NXT2/KPNA3/AXIN1/TSC2/UBE2I/TGFB1/TNPO2/CASC3/RANGRF/ZPR1/IFNG/MAPK14/HSPA9/KPNA1/PARK7/NRDE2/TARDBP/CRY2/EGR2/CSE1L/CDKN1A/NUP153/NUP85/IL1B/NUP210/NXT1/XPO4/IPO8/CD36/MDFIC/AKIRIN2/HNRNPA1/LTV1/NCBP1/ANP32B/ANP32A/EIF4A3/POLR2D/PIK3R1/NOTCH1/TCF7L2/BAG3/HHEX/RANBP2/HEATR3/APPL1/LMNA/NXF1/THOC7/PRKCD/RANBP3L/SHH/CDK5/SYK/NEMF/CHP2/AHCYL1/PKIG/DDX19A/RGS14/NMD3/CDK1/LEP/CALR/PTPN11/NPM1/SETD2/PTTG1IP/XPOT/IPO4/SDAD1/IPO9/SMG5/SARNP/IPO7/EIF6/RBM15B/RBM8A/TXNIP/SQSTM1/IPO4/PRKACA | 108 |
| GO:1905897 | regulation of response to endoplasmic reticulum stress | 40/3662 | 79/15509 | 1.6091e-07 | 2.27304e-06 | 1.36697e-06 | MBTPS2/UFL1/BAK1/HSPA5/HERPUD1/ATXN3/FCGR2B/PPP1R15A/BAX/BAG6/XBP1/USP14/BFAR/SGTA/CREB3/TMEM33/PARK7/CLU/SERINC3/TMBIM6/PMAIP1/MANF/PIK3R1/BCL2L11/USP25/PPP1R15B/BCL2L1/EIF2AK3/DDIT3/PTPN2/ERN1/GRINA/PRKN/SVIP/BAG6/MAGEA3/BAG6/BAG6/BAG6/BAG6 | 40 |
| GO:0001915 | negative regulation of T cell mediated cytotoxicity | 17/3662 | 22/15509 | 1.60998e-07 | 2.27304e-06 | 1.36697e-06 | FCGR2B/PTPRC/LILRB1/PPP3CB/HLA-G/HLA-G/HLA-G/HLA-G/HLA-G/HLA-G/HLA-G/PTPRC/LILRB1/HLA-G/LILRB1/LILRB1/LILRB1 | 17 |
| GO:0002767 | immune response-inhibiting cell surface receptor signaling pathway | 17/3662 | 22/15509 | 1.60998e-07 | 2.27304e-06 | 1.36697e-06 | LILRB1/LILRB4/HLA-G/HLA-G/HLA-G/HLA-G/HLA-G/HLA-G/HLA-G/LILRB1/LILRB4/HLA-G/LILRB1/LILRB1/LILRB1/LILRB4/LILRB4 | 17 |
| GO:0071801 | regulation of podosome assembly | 16/3662 | 20/15509 | 1.62299e-07 | 2.28621e-06 | 1.37489e-06 | RHOA/HCK/IL5/LCP1/MSN/GSN/CSF2/SRC/TNF/TNF/TNF/TNF/TNF/TNF/TNF/TNF | 16 |
| GO:0045786 | negative regulation of cell cycle | 128/3662 | 360/15509 | 1.63893e-07 | 2.30342e-06 | 1.38524e-06 | CRY1/BAZ1B/RUNX3/FHL1/YTHDC2/USP28/RAD51/IPO5/NDC80/ATRX/ZW10/BIRC5/CDC6/MSH2/ABL1/BMP7/RBBP8/NUBP1/NBN/DOT1L/LILRB1/TGFB1/CASP2/EZH2/GATA3/RNF167/CCL2/CCND1/FBXO5/MAPK14/CCNG1/RAD50/MACROH2A1/BCL6/KAT2B/ZBTB17/CDC20/TNFAIP3/PKD2/TEX14/INHBA/NR4A1/CDKN1A/BMP2/LIF/CDKN1C/BTG1/MEN1/CCNB1/CDCA8/APC/IL10/NABP2/BRCA2/RB1/CUL4A/DTL/TP53BP2/INTS3/RHOB/CTDSP1/PLK2/SPC25/ZFP36L2/HHEX/SMARCA5/XPC/EME1/BTG2/PRMT2/BRSK1/MRNIP/RPL26/CASP3/GPER1/CDK5/BRD7/WEE1/RFWD3/BUB1/AVEN/CDK1/TRIAP1/RHNO1/NABP1/ZWILCH/ANGEL2/CTDSP2/AURKAIP1/AURKB/PTPN11/NPM1/CACNB4/CEP63/CHEK2/FOXO4/MUC1/ZFP36L1/HEXIM1/H2AX/KANK2/GIGYF2/TNF/HLA-G/IPO7/TNF/HLA-G/SIPA1/TNF/TNF/TNF/TNF/TNF/HLA-G/TNF/HLA-G/HLA-G/HLA-G/HLA-G/CEBPA/PRKDC/CDKN1C/LILRB1/HLA-G/LILRB1/LILRB1/LILRB1/PTEN | 128 |
| GO:0009314 | response to radiation | 145/3662 | 419/15509 | 1.69198e-07 | 2.3726e-06 | 1.42684e-06 | KDM1A/CRY1/SNAI2/BAK1/HSPA5/USP28/PER3/FOXP3/RAD51/CYBA/PRDM1/TMEM161A/KARS1/HYAL2/SMC1A/SIRT6/UBE2A/XRCC5/PTPRC/OPRK1/ZMPSTE24/RAD54L/BAX/MMP2/ANGPT2/MSH2/CIRBP/MMP9/ACTR5/N4BP1/NDRG4/EYA1/SFRP1/EEF1D/ERCC2/HAMP/BRAT1/GATA3/CXCL12/MAPK8/UNC119/CRYAB/B3GAT1/CCND1/PITPNM1/MAPK14/PDE8B/IL12B/IL1A/ID2/GADD45A/DNMT3A/EGR1/CRY2/CAT/CDKN1A/ELK1/FBXL12/GNGT1/PER2/PRKAA1/KRAS/MEN1/BHLHE40/DDB2/NMT1/TANK/XPA/NABP2/BRCA2/CUL4A/TNFRSF11A/APP/DTL/INTS3/PARP1/RHOB/PIK3R1/EGFR/TLK2/ALAD/ITGB1/NMT2/XPC/GNAQ/KIT/CUL4B/NR2F6/BRSK1/MRNIP/RPL26/VCAM1/ERCC3/PRKCD/UVSSA/CASP3/CDK5/TP53INP1/RAG1/RFWD3/RGS14/FOS/MGMT/PPM1D/TRIAP1/BCL2L1/RHNO1/CCL11/KAT5/RELA/NABP1/LIG4/HRAS/GRIN1/GRB2/AURKB/NPM1/H2AC25/CACNB4/NOG/CHEK2/CCR4/H2AX/NOC2L/MME/MMP1/SYNGAP1/ELANE/NTRK1/TAFA2/FKBPL/TNF/TRIM13/TNF/FANCG/TNF/TNF/TNF/TNF/TNF/TNF/PRKDC/ITGB3/PTPRC/ELANE | 145 |
| GO:0140546 | defense response to symbiont | 101/3662 | 269/15509 | 1.74071e-07 | 2.43053e-06 | 1.46168e-06 | MAP3K14/BIRC3/FOXP3/EIF2AK2/PUM2/HYAL2/DDX1/MID2/PTPRC/OPRK1/ZMPSTE24/ATG16L1/MAVS/IL12RB1/MARCHF2/CD40/RIOK3/TLR8/PYCARD/LILRB1/C1QBP/IFNG/AICDA/IL12B/IL4/STAT1/TNFAIP3/VAMP8/IFIT2/GPAM/TRIM25/IL1B/IRF3/BECN1/IRF5/TRAF3/TRIM5/TRIM22/POLR3F/SERINC3/PTPN22/IL6/TANK/NCBP1/DDX60/PPM1B/SENP7/HERC5/IL21/TARBP2/ITGAX/ARMC5/PMAIP1/LYST/NLRX1/POLR3K/CLPB/TLR3/MBL2/HTRA1/TRIM44/FADD/DDIT4/IRF2/POLR3D/TRIM56/TRIM8/BCL2L1/RELA/PDE12/PRF1/DDX60L/SETD2/MICA/IFITM1/CARD9/PLSCR1/TLR7/PCBP2/ATG7/ATAD3A/IFNA1/TRIM13/MICB/MICB/MICB/MICB/MICA/MICB/MICA/TRIM26/MICA/MICB/IL10RB/LSM14A/PTPRC/LILRB1/LILRB1/LILRB1/LILRB1/ITCH | 101 |
| GO:0051222 | positive regulation of protein transport | 104/3662 | 279/15509 | 1.74114e-07 | 2.43053e-06 | 1.46168e-06 | BAD/CD38/IGF1/CASR/CDH1/NNAT/IPO5/HYAL2/VPS35/CSNK2A2/PRKACA/SIRT6/PCM1/GSK3B/OXCT1/ACHE/DNM1L/MAVS/P2RX7/HSP90AB1/SH3GLB1/GZMB/PCK2/PARD6A/KCNN4/PDCD5/TGFB1/CD33/GSK3A/MAPK8/PPP3CB/ZPR1/CD81/PSMD9/IFNG/PPARD/MAPK14/TMEM30A/APBB3/IL1A/SERP1/TARDBP/ACSL3/SOX4/IL1B/ERGIC3/RAC2/PRKAA1/XPO4/GLUL/NMT1/TLR4/ANP32B/SORL1/CEP131/SAE1/PIK3R1/GLUD1/TCF7L2/VEGFC/BAG3/BMP6/ITGB2/PCNT/BAP1/PRKCD/SHH/GPER1/CDK5/CHP2/ADAM9/MFF/ITGAM/CDK1/PRKCE/FGG/FGA/LEP/HRAS/PDZK1/ATG13/CDK5R1/MIEF2/CIB1/UBE2L3/CLN3/PPIA/SRC/UBL5/HSPA1L/TNF/HSPA1L/TNF/FIS1/TNF/HSPA1L/TNF/TNF/TNF/TNF/TNF/HSPA1L/HSPA1L/PRKACA | 104 |
| GO:0055072 | iron ion homeostasis | 41/3662 | 82/15509 | 1.76675e-07 | 2.46075e-06 | 1.47985e-06 | HFE/LTF/SLC11A1/HYAL2/ATP6AP1/PICALM/SLC46A1/FTL/SLC22A17/NUBP1/SLC39A14/HAMP/TFR2/HPX/SLC11A2/IFNG/RHAG/ATP6V1A/EPAS1/FBXL5/NDFIP1/ISCU/IREB2/ATP6V1G1/SMAD4/SOD1/SLC25A37/LCN2/BMP6/STEAP2/ALAS2/CYB561A3/MELTF/FXN/EPB42/FTH1/ERFE/BTBD9/TMPRSS6/TMEM199/B2M | 41 |
| GO:0070664 | negative regulation of leukocyte proliferation | 48/3662 | 102/15509 | 1.78674e-07 | 2.48301e-06 | 1.49324e-06 | BTK/TYROBP/FOXP3/FCGR2B/ARG2/LILRB1/BCL6/CD86/TNFAIP3/ARG1/CD80/PKN1/TWSG1/FOXJ1/NDFIP1/SFTPD/IL2RA/IL10/TNFRSF21/CTLA4/CASP3/SHH/INPP5D/LGALS9/CEBPB/GLMN/LILRB4/PDCD1LG2/CR1/HLA-G/HLA-G/HLA-G/HLA-G/HLA-G/HLA-G/HLA-G/TNFRSF13B/LILRB1/LILRB4/HLA-G/LILRB1/LILRB1/LILRB1/LILRB4/LILRB4/INPP5D/PTEN/ITCH | 48 |
| GO:0002762 | negative regulation of myeloid leukocyte differentiation | 29/3662 | 50/15509 | 1.87811e-07 | 2.59254e-06 | 1.55911e-06 | LTF/SFRP1/LILRB1/IL4/IAPP/INHBA/LRRC17/RARA/PIAS3/TLR4/CUL4A/TCTA/PIK3R1/TLR3/TNFRSF11B/INPP5D/GPR137/PTPN2/ADIPOQ/LILRB4/MAFB/LILRB1/LILRB4/LILRB1/LILRB1/LILRB1/LILRB4/LILRB4/INPP5D | 29 |
| GO:0046427 | positive regulation of receptor signaling pathway via JAK-STAT | 29/3662 | 50/15509 | 1.87811e-07 | 2.59254e-06 | 1.55911e-06 | PIBF1/IL12B/IL4/IL5/HES1/PTK2B/IL6/IL10/CYP1B1/NOTCH1/KIT/ADIPOR1/IL6R/LEP/F2/F2R/SOCS1/TNF/TNF/TNF/TNF/TNF/TNF/TNF/TNF/IL10RB/GH1/CCL5/CCL5 | 29 |
| GO:1902895 | positive regulation of miRNA transcription | 29/3662 | 50/15509 | 1.87811e-07 | 2.59254e-06 | 1.55911e-06 | NGFR/SPI1/PDGFB/TGFB1/GATA3/BMPR1A/MYB/FOXO3/EGR1/BMP2/IL10/SMAD6/FGF2/SMAD4/TERT/FOS/RELA/FOSL1/JUN/TEAD1/MRTFA/TNF/TNF/TNF/TNF/TNF/TNF/TNF/TNF | 29 |
| GO:0002369 | T cell cytokine production | 27/3662 | 45/15509 | 1.89394e-07 | 2.60281e-06 | 1.56528e-06 | HFE/TNFRSF1B/FOXP3/TBX21/SMAD7/CLC/GATA3/CD81/IL4/ARG1/IL1B/IL6/IL18/LILRB4/CD55/HLA-A/HLA-A/HLA-A/HLA-A/HLA-A/HLA-A/HLA-A/HLA-A/B2M/LILRB4/LILRB4/LILRB4 | 27 |
| GO:0002724 | regulation of T cell cytokine production | 27/3662 | 45/15509 | 1.89394e-07 | 2.60281e-06 | 1.56528e-06 | HFE/TNFRSF1B/FOXP3/TBX21/SMAD7/CLC/GATA3/CD81/IL4/ARG1/IL1B/IL6/IL18/LILRB4/CD55/HLA-A/HLA-A/HLA-A/HLA-A/HLA-A/HLA-A/HLA-A/HLA-A/B2M/LILRB4/LILRB4/LILRB4 | 27 |
| GO:0001101 | response to acid chemical | 55/3662 | 123/15509 | 2.00325e-07 | 2.74694e-06 | 1.65196e-06 | BAD/UFL1/CPS1/RRAGD/CYBA/F7/ATP2B4/IPO5/RHOA/MMP2/XBP1/RPS6KB1/LAMTOR3/ARG1/PKD2/DNMT3A/BCL2L2/CDO1/ASS1/SESN2/DNMT1/PDGFRA/TMBIM6/IGF1R/MEAK7/PDGFC/EGFR/NTRK2/ALAD/ZEB1/SESN3/CAPN2/CASP3/CYBB/NSMF/BCL2L1/CEBPB/GRIN1/SLC38A9/PLEC/NQO1/SOCS1/LAMTOR4/COL4A6/NTRK1/MTOR/TNF/TNF/SIPA1/TNF/TNF/TNF/TNF/TNF/TNF | 55 |
| GO:0010721 | negative regulation of cell development | 74/3662 | 182/15509 | 2.14816e-07 | 2.93266e-06 | 1.76365e-06 | TMEM98/IFRD1/LTF/IGF1/CDH1/NTN1/KDM4A/SIRT2/FBLN1/PCM1/GSK3B/BMP7/LILRB1/GSK3A/PTN/BMPR1A/WNT3/EFNB3/CORO1C/WNT5A/HES1/IL1A/SPP1/IL1B/ID1/NR1D1/YWHAH/EPHB2/LRP4/EDNRB/IL6/KIAA0319/SORL1/RB1/DUSP10/CTDSP1/NOTCH1/NODAL/DPYSL5/SKI/DMTN/FRZB/MELTF/CDK5/SEMA4C/SEMA3E/CCL11/RCC2/F2/RFLNB/NOG/NF2/DCC/SPRY4/TRPV1/SYNGAP1/MBP/GDI1/TNF/TNF/TNF/TNF/TNF/TNF/TNF/TNF/B2M/LILRB1/LILRB1/LILRB1/WNT3/WNT3/LILRB1/PTEN | 74 |
| GO:0032872 | regulation of stress-activated MAPK cascade | 74/3662 | 182/15509 | 2.14816e-07 | 2.93266e-06 | 1.76365e-06 | WNT16/PAFAH1B1/NOX1/MAPK8IP2/HGF/FAS/FLT4/EIF2AK2/TRAF1/HIPK2/MAP2K4/SPI1/FCGR2B/TRAF4/OPRK1/MECOM/GADD45B/BIRC7/RASSF2/AXIN1/PYCARD/SFRP1/NOD1/FKTN/AMBP/FOXM1/WNT5A/IL1A/GADD45A/PRDX1/PTK2B/IL1B/BMP2/CCR7/PRMT1/EDA2R/TRAF3/MEN1/PTPN22/MDFIC/TLR4/CCL21/IGF1R/APP/DUSP10/ARL6IP5/EGFR/FOXO1/MBIP/TLR3/NOD2/SEMA4C/CCL19/LEP/HRAS/PLCB1/PRKN/CARD9/WNT7B/HMGB1/PPIA/MAP3K5/TNF/TNF/TNF/TNF/TNF/TNF/TNF/TNF/NAIP/NAIP/NAIP/ITCH | 74 |
| GO:0071496 | cellular response to external stimulus | 109/3662 | 297/15509 | 2.22538e-07 | 3.03141e-06 | 1.82304e-06 | BAD/MAP3K14/SNAI2/GLRX2/RRAGD/FAS/BAK1/CASR/CLEC16A/HSPA5/CYBA/EIF2AK2/MAP2K4/ASNS/PTPRC/SEH1L/P2RX7/GCN1/COMT/SH3GLB1/XBP1/CD40/ADNP/TLR8/NPRL3/PIEZO1/SFRP1/TLE5/USF2/MTPN/CASP2/ENG/MAPK8/RNF167/HSPA8/FOLR1/CYP27B1/VDR/ITGA4/ELAPOR1/GADD45A/SLC2A1/FOXO3/TNFRSF10B/TNFRSF8/TRIM24/KCNJ2/CDKN1A/IL1B/MAX/BECN1/ATG14/CD68/SESN2/PRKAA1/MYBBP1A/HNRNPA1/GLUL/TTC5/TLR4/FGF2/GABARAPL1/IGF1R/TNFRSF11A/PMAIP1/SESN3/FOXO1/BAG3/BMP6/NR4A2/KLF10/WIPI2/ARHGAP35/BRSK1/WNT4/VCAM1/ATF3/INHBB/ALB/RICTOR/TLR3/AQP3/ZFYVE1/FADD/MN1/MAP3K2/FOS/PPM1D/EIF2AK3/KAT5/DAG1/BRSK2/LEP/LPL/FOSL1/PLEC/DCTPP1/GAS2L1/PRR5/AKR1C3/TLR7/KANK2/MAP3K5/ATG7/MTOR/SIPA1/ITGB3/PTPRC/LOC102724560 | 109 |
| GO:0042509 | regulation of tyrosine phosphorylation of STAT protein | 39/3662 | 77/15509 | 2.26599e-07 | 3.07322e-06 | 1.84818e-06 | IGF1/FGFR3/PIBF1/OSM/CD40/HPX/SH2B3/IFNG/IL12B/IL4/PPP2CA/HES1/FLT3/LIF/EPO/IL6/IL21/IL18/KIT/IL6R/IL24/IL3/CSF2/LEP/PTPN2/CSF1R/SOCS1/NF2/TNF/TNF/TNF/TNF/TNF/TNF/TNF/TNF/GH1/CCL5/CCL5 | 39 |
| GO:0072332 | intrinsic apoptotic signaling pathway by p53 class mediator | 39/3662 | 77/15509 | 2.26599e-07 | 3.07322e-06 | 1.84818e-06 | KDM1A/E2F2/CD74/CD44/USP28/HIPK2/TP63/TP73/BAX/MSH2/BAG6/PYCARD/DDX5/PERP/CDKN1A/DYRK2/EDA2R/MYBBP1A/BRCA2/PMAIP1/TP53BP2/POU4F2/POU4F1/ZNF385A/RPL26/SHISA5/DDIT4/HINT1/TRIAP1/PTTG1IP/CHEK2/PRKN/MUC1/BAG6/BAG6/BAG6/BAG6/BAG6/MIF | 39 |
| GO:1901222 | regulation of NIK/NF-kappaB signaling | 45/3662 | 94/15509 | 2.30709e-07 | 3.11711e-06 | 1.87457e-06 | EIF2AK2/SPI1/RHOA/MKRN2/NFKBIA/BMP7/RASSF2/NFAT5/NOD1/IL12B/CD86/PRDX1/IL1B/RBCK1/PTPN22/TLR4/CCN3/PPM1B/APP/EGFR/IL18/NDUFC2/ADIPOR1/TLR3/TRIM44/NOD2/LGALS9/LIMS1/CD14/CCL19/RELA/CALR/IRAK1/PTP4A3/TLR7/TNF/TMSB4X/TNF/CPNE1/TNF/TNF/TNF/TNF/TNF/TNF | 45 |
| GO:0043552 | positive regulation of phosphatidylinositol 3-kinase activity | 21/3662 | 31/15509 | 2.30841e-07 | 3.11711e-06 | 1.87457e-06 | FGFR3/CDC42/EPHA8/PDGFB/FLT1/TGFB1/PDGFRB/TEK/PTK2B/FLT3/CCR7/ATG14/PDGFRA/CCL21/FGF2/KIT/NOD2/PTK2/CCL19/CD19/SRC | 21 |
| GO:0033157 | regulation of intracellular protein transport | 81/3662 | 205/15509 | 2.48779e-07 | 3.35202e-06 | 2.01585e-06 | CDH1/IPO5/SP100/HYAL2/CSNK2A2/PRKACA/DERL2/LMAN1/SIRT6/PCM1/GSK3B/XPO1/MAVS/HSP90AB1/SH3GLB1/RANGAP1/GZMB/FERMT1/PDCD5/TGFB1/GSK3A/MAPK8/ZPR1/CD81/IFNG/MAPK14/TMEM30A/PARK7/TARDBP/IL1B/ERGIC3/RAC2/PRKAA1/XPO4/CD36/MDFIC/LCP1/NMT1/ANP32B/SORL1/CEP131/SAE1/PIK3R1/TCF7L2/BAG3/DMTN/ITGB2/PCNT/BAP1/PRKCD/SHH/CDK5/CHP2/PKIG/MFF/ITGAM/CDK1/BRSK2/LEP/HRAS/PDZK1/ATG13/CDK5R1/MIEF2/PTPN11/YOD1/ADIPOQ/CIB1/PRKN/UBE2L3/SVIP/UBL5/UBE2J1/GDI1/HSPA1L/HSPA1L/FIS1/HSPA1L/HSPA1L/HSPA1L/PRKACA | 81 |
| GO:0061138 | morphogenesis of a branching epithelium | 70/3662 | 170/15509 | 2.55196e-07 | 3.43103e-06 | 2.06336e-06 | HOXA11/SNAI2/HGF/CASR/TIE1/FGFR2/TP63/GLI2/SIRT6/PGR/TMED2/ESR1/ABL1/BMP7/LAMA1/EYA1/SFRP1/TMEM59L/MET/HOXA5/ENG/AREG/MDK/VDR/WNT5A/KDM5B/PKD2/GNA13/BMP2/KDR/LAMA5/KRAS/SPRY2/NKX2-1/IL10/FGF2/EGF/GREB1L/SMAD4/EPHA2/SLIT2/ADAMTS16/NOTCH1/MMP14/WNT4/RBM15/TGFBR2/SHH/BTRC/FRS2/SEMA3E/CCL11/DAG1/GRB2/CTNNBIP1/NOG/CSF1/PBX1/SRC/NRARP/TGM2/FKBPL/TNF/TNF/TNF/TNF/TNF/TNF/TNF/TNF | 70 |
| GO:0010212 | response to ionizing radiation | 57/3662 | 130/15509 | 2.73701e-07 | 3.67186e-06 | 2.20819e-06 | KDM1A/SNAI2/BAK1/HSPA5/USP28/RAD51/CYBA/KARS1/XRCC5/PTPRC/ZMPSTE24/RAD54L/BAX/MSH2/EYA1/SFRP1/EEF1D/HAMP/BRAT1/GATA3/CRYAB/CCND1/MAPK14/IL1A/GADD45A/DNMT3A/EGR1/CDKN1A/ELK1/PRKAA1/MEN1/TANK/NABP2/BRCA2/INTS3/PARP1/RHOB/TLK2/ALAD/MRNIP/RPL26/VCAM1/CASP3/RFWD3/MGMT/BCL2L1/RHNO1/KAT5/NABP1/LIG4/HRAS/GRB2/CHEK2/H2AX/TRIM13/PRKDC/PTPRC | 57 |
| GO:0002526 | acute inflammatory response | 52/3662 | 115/15509 | 2.76812e-07 | 3.70557e-06 | 2.22847e-06 | BTK/FCGR2B/OSM/HAMP/PIK3CG/TFR2/GATA3/IL4/IL1A/FN1/PARK7/ASH1L/IL1B/C3/CCR7/EPO/ASS1/EDNRB/IL6/TNFRSF11A/IL6R/VCAM1/MBL2/CEBPB/A2M/CD163/CTNNBIP1/F2/CXCR2/SIGIRR/PLSCR1/ZP3/TRPV1/ELANE/TNF/HLA-E/TNF/HLA-E/TNF/HLA-E/TNF/TNF/TNF/HLA-E/ORM1/TNF/HLA-E/TNF/HLA-E/HLA-E/HP/ELANE | 52 |
| GO:0043406 | positive regulation of MAP kinase activity | 55/3662 | 124/15509 | 2.77927e-07 | 3.71249e-06 | 2.23262e-06 | FGFR1/PTPRC/NOX4/P2RX7/PDGFB/CD40/FLT1/AXIN1/CSK/TGFB1/PIK3CG/EZH2/DKK1/MAP2K6/FZD10/PDGFRB/WNT5A/PTK2B/FLT3/IL1B/AJUBA/TLR4/THBS1/FGF2/EGF/MAP3K12/TNFRSF11A/PDGFC/EGFR/KIT/DVL3/SYK/NOD2/ADAM9/CCL19/HRAS/FZD4/ERN1/IRAK1/SRC/MAP3K5/ELANE/TNF/TNF/TNF/TNF/TNF/TNF/TNF/TNF/GH1/PTPRC/CD24/MIF/ELANE | 55 |
| GO:0001666 | response to hypoxia | 103/3662 | 278/15509 | 2.80435e-07 | 3.73793e-06 | 2.24793e-06 | BAD/CD38/CASR/CYBA/F7/HIPK2/RHOA/PDK3/SIRT2/MMP2/ALKBH5/ANGPT2/BMP7/SFRP1/PLAT/CXCL12/CRYAB/SLC11A2/PPARD/SLC29A1/IL1A/EPAS1/SLC2A1/MPL/FOXO3/PGF/DNMT3A/EGR1/PTK2B/CAT/CXCR4/BMP2/BECN1/PIN1/HP1BP3/GNGT1/AJUBA/CBFA2T3/EPO/PRKAA1/LOXL2/THBS1/TMBIM6/CYP1A1/SMAD4/PMAIP1/ARNT/PKLR/PSEN2/CCNA2/ALAD/NOTCH1/VEGFC/ITPR1/NR4A2/DDAH1/MMP14/ALAS2/STC1/LMNA/AK4/VCAM1/CAPN2/ERCC3/TGFBR2/FABP1/CASP3/TERT/CYBB/AQP3/HIF1AN/DDIT4/RBPJ/FOS/PRKCE/ARNT2/LEP/ADIPOQ/SLC8A1/IRAK1/ZFP36L1/P2RX2/SRC/DPP4/MTOR/TNF/TNF/LTA/TNF/LTA/TNF/TNF/TNF/TNF/LTA/LTA/TNF/LTA/ADSL/PKLR/CD24/LOC102724560/PTEN | 103 |
| GO:0051054 | positive regulation of DNA metabolic process | 102/3662 | 275/15509 | 3.0097e-07 | 3.99126e-06 | 2.40027e-06 | DBF4/HGF/PARP3/ARID1B/RAD51/FAM168A/TMEM161A/MAP2K4/TBX21/GLI2/ACTB/MLH1/SIRT6/XRCC5/PTPRC/ATRX/NOX4/BAX/MAPKAPK5/FUS/MSH2/BRPF3/HSP90AB1/CDC7/BCL7C/SMARCB1/PDGFB/GINS1/CD40/RBBP8/EYA1/NBN/ERCC2/PRKD2/TGFB1/EXOSC3/SMARCD2/NSD2/BCL7A/FOXM1/EYA4/SMOC2/IL4/RAD50/PDGFRB/INO80D/ARID1A/SLF2/PTK2B/SHLD2/MORF4L2/USP9X/YEATS4/POT1/DKC1/HNRNPA1/CCT7/EPC2/IL6/CYP1B1/ACTR2/FGF2/EGF/NABP2/IGF1R/ARRB2/PARP1/EGFR/SMARCA5/CCDC117/MRNIP/DBF4B/TNFSF13/PRKCD/BRD7/CCT2/CDK1/MGMT/KAT5/KCTD13/CD28/AURKB/MAPK15/USP7/H2AX/ARID2/HMGB1/TRRAP/SRC/TNF/TNF/TNF/TNF/TNF/TNF/TNF/TNF/PRKDC/RTEL1/PTPRC/SMARCB1/TINF2 | 102 |
| GO:0048302 | regulation of isotype switching to IgG isotypes | 12/3662 | 13/15509 | 3.01373e-07 | 3.99126e-06 | 2.40027e-06 | FOXP3/TBX21/MLH1/PTPRC/MSH2/CD40/IL27RA/IL4/NDFIP1/SLC15A4/CD28/PTPRC | 12 |
| GO:1902565 | positive regulation of neutrophil activation | 12/3662 | 13/15509 | 3.01373e-07 | 3.99126e-06 | 2.40027e-06 | ITGB2/PTAFR/ITGAM/TNF/CD177/TNF/TNF/TNF/TNF/TNF/TNF/TNF | 12 |
| GO:0032611 | interleukin-1 beta production | 45/3662 | 95/15509 | 3.38707e-07 | 4.46661e-06 | 2.68614e-06 | TYROBP/IGF1/ARG2/P2RX7/TLR8/ACP5/MEFV/PYCARD/CD33/NOD1/HSPB1/IFNG/IL17A/WNT5A/TNFAIP3/EGR1/CCR7/CD36/IL6/TLR4/ARRB2/APP/GBP5/NOD2/CX3CR1/LGALS9/CCL19/LPL/F2R/LILRB4/TNF/TNF/TNF/TNF/TNF/TNF/ORM1/TNF/TNF/NAIP/LILRB4/NAIP/LILRB4/LILRB4/NAIP | 45 |
| GO:0032651 | regulation of interleukin-1 beta production | 45/3662 | 95/15509 | 3.38707e-07 | 4.46661e-06 | 2.68614e-06 | TYROBP/IGF1/ARG2/P2RX7/TLR8/ACP5/MEFV/PYCARD/CD33/NOD1/HSPB1/IFNG/IL17A/WNT5A/TNFAIP3/EGR1/CCR7/CD36/IL6/TLR4/ARRB2/APP/GBP5/NOD2/CX3CR1/LGALS9/CCL19/LPL/F2R/LILRB4/TNF/TNF/TNF/TNF/TNF/TNF/ORM1/TNF/TNF/NAIP/LILRB4/NAIP/LILRB4/LILRB4/NAIP | 45 |
| GO:0030101 | natural killer cell activation | 46/3662 | 98/15509 | 3.51343e-07 | 4.6234e-06 | 2.78043e-06 | TYROBP/SLAMF7/PRDM1/PTPRC/PIBF1/HECTD1/BAG6/ELF4/IL21R/GATA3/IL12B/PRDX1/CD244/ULBP2/PTPN22/SNX27/IL18/MERTK/STAT5B/LEP/MICA/PBX1/BLOC1S3/IFNA1/BAG6/HLA-E/HLA-E/NCR3/HLA-E/NCR3/BAG6/HLA-E/BAG6/HLA-E/MICA/MICA/BAG6/HLA-E/BAG6/MICA/NCR3/HLA-E/NCR3/NCR3/NCR3/PTPRC | 46 |
| GO:0019058 | viral life cycle | 105/3662 | 286/15509 | 3.61656e-07 | 4.74903e-06 | 2.85598e-06 | CD4/LTF/CD74/YTHDC2/EIF2AK2/HYAL2/MID2/ATG16L1/CHMP5/MAVS/CCNK/ICAM1/HSP90AB1/SMARCB1/CHMP4B/VAPA/KPNA3/N4BP1/SLC1A5/TRIM14/CCL2/EFNB3/HSPA8/DDX6/CD81/AICDA/CD86/SPCS1/NR5A2/VAMP8/TRIM25/CD80/CXCR4/STAU1/NUP153/DEK/NECTIN2/APOE/CHMP1A/TOP2A/TRIM5/TRIM22/ARL8B/SRPK2/ITGAV/SLC7A1/TARBP2/FURIN/EPHA2/EGFR/GSN/NOTCH1/NCAM1/HMGA2/ITGB1/NMT2/EEF1A1/CTBP1/CCR5/VCP/ANPEP/TRIM68/SLC3A2/ATG16L2/LGALS9/CXCL8/GYPA/PDCD6IP/CDK1/TRIM8/BSG/DAG1/PDE12/CTBP2/BANF1/CHMP6/TMEM39A/CD28/CIITA/PRKN/SLC52A2/IFITM1/PLSCR1/HMGB1/PPIA/CD55/PCBP2/DPP4/WWP2/CR1/TNF/TNF/ZBED1/TNF/TNF/TNF/TNF/TNF/TNF/TRIM26/ITGB3/CCL5/CCL5/SMARCB1/ITCH | 105 |
| GO:0030522 | intracellular receptor signaling pathway | 93/3662 | 246/15509 | 3.68931e-07 | 4.83433e-06 | 2.90728e-06 | KDM1A/CRY1/RNF14/UFL1/SNAI2/BIRC3/PUM2/PLPP1/RHOA/PDK3/TP63/PIAS2/PGR/ESR1/RBFOX2/NFKBIA/RIOK3/SFRP1/EZH2/AHR/ZMIZ1/C1QBP/DDX5/MAP2K6/CYP27B1/VDR/PPARD/KDM3A/PARK7/HDAC1/NR5A2/PADI2/ARID1A/TNFAIP3/NR4A3/CRY2/TRIM24/PKN1/NR4A1/CNOT1/BMP2/THRA/NR1D1/IRF3/YWHAH/ALDH1A2/RARA/WBP2/PTPN22/TLR4/DDX60/SLC15A4/CARM1/ARNT/PARP1/CNOT9/THRB/POU4F2/NR4A2/NODAL/NR2F6/PRMT2/NLRX1/ALOX15/CLPB/HEYL/GPER1/NOD2/TRIM68/MN1/TADA3/CYP7B1/RARG/RELA/ESRRA/LEP/CTBP2/TAF7/CALR/LACC1/PRAME/AKR1C3/SRC/KANK2/RXRB/DAXX/DAXX/DAXX/DAXX/DAXX/LSM14A/PAGR1/ITCH | 93 |
| GO:0090068 | positive regulation of cell cycle process | 86/3662 | 223/15509 | 3.73493e-07 | 4.88377e-06 | 2.93701e-06 | CDC27/KMT2E/DBF4/PAF1/IGF1/SPAST/RHOA/SIRT2/CDC42/SPAG5/NDC80/ATRX/NSFL1C/ANAPC5/BIRC5/CDC6/CDC7/PDGFB/APEX1/CDC25B/RAB11A/EZH2/CCND1/FBXO5/CCND3/MACROH2A1/PDGFRB/SMC4/KAT2B/WNT5A/IL1A/SLF2/IL1B/BECN1/HSPA2/SOX15/CCNB1/CDCA8/NUMA1/RDX/NUSAP1/KIF23/EGF/RB1/CUL4A/IGF1R/CYP1A1/APP/DTL/DYRK3/PKP4/EGFR/NCAPG2/ADAMTS1/LSM11/CUL4B/CXCR5/DBF4B/WNT4/TERT/RRM1/CDK1/PRKCE/RHNO1/RRM2/KAT5/CD28/AURKB/RCC2/MAPK15/NPM1/PLCB1/CHEK2/CDK10/PBX1/PLSCR1/TFDP1/TNF/TNF/TNF/TNF/TNF/TNF/TNF/TNF/PAGR1 | 86 |
| GO:0022411 | cellular component disassembly | 145/3662 | 424/15509 | 3.77202e-07 | 4.9219e-06 | 2.95994e-06 | UPF1/SCIN/PAFAH1B1/UFL1/SNAI2/SPAST/CLEC16A/PHF23/VMP1/NAV3/TBC1D25/SPTB/CSNK2A2/WDR1/MARK2/NSF/ADD2/ACTN2/GSK3B/ZMPSTE24/CHMP5/BAX/MMP2/ADD1/DNM1L/TPX2/SUPT16H/SNAP29/MMP11/CECR2/SMARCB1/TFIP11/CTSG/ACIN1/MMP9/CHMP4B/TSC2/TGFB1/GSK3A/MTPN/TGFBR1/DKK1/SMARCD2/HSPA8/NEDD9/PARK7/CAPZA1/MFN2/STMN1/ARID1A/VAMP8/MTRF1/LRP1/C3/DSTN/BECN1/ATG14/HSPA2/CHMP1A/TOP2A/PRKAA1/APC/SNX14/MICAL1/LAMC1/LCP1/IL6/HMGA1/MMP7/RDX/GABARAPL1/IGF1R/FURIN/RETREG3/SH3GL1/KIF2C/DYRK3/SNAPIN/PIK3R1/OGT/GSN/MRRF/SSRP1/PLEKHH2/PRKCA/SCAF4/MMP14/WIPI2/DMTN/ADAMTS4/SPTBN4/SPTA1/FYCO1/MELTF/SLC25A46/GPER1/CDK5/VCP/FUNDC2/MAPRE2/GOLGA2/DDIT4/CX3CR1/ADRB2/ITGAM/CDK1/KIF5B/CFL1/KAT5/SPTBN2/ATP2A2/ATG13/CHMP6/TMEM39A/PLAAT3/FLII/H2AC25/CIB1/PRKN/TMPRSS6/CLN3/ARID2/RRP7A/MMP1/ATG7/ELANE/DPP4/SPTAN1/IQANK1/TNF/RIMOC1/TNF/FIS1/TNF/TNF/TNF/TNF/TNF/TNF/PDXP/TWF2/LIX1L/SMARCB1/ELANE/SQSTM1 | 145 |
| GO:0010720 | positive regulation of cell development | 107/3662 | 293/15509 | 3.79825e-07 | 4.94571e-06 | 2.97426e-06 | BAD/KDM1A/HOXA11/PAFAH1B1/TYROBP/UFL1/TNFRSF1B/NTN1/SIRT2/CDC42/PLXNA2/TP73/XRCC5/LRP2/ADD1/ABL1/ADNP/SMAD7/OLFM4/TGFB1/PTN/CXCL12/WNT3/C1QBP/MDK/IFNG/NEDD9/IL5/DBN1/HES1/FN1/ID2/HDAC1/MPL/CXCR4/EGR2/OBSL1/IL1B/NKX2-2/BMP2/LIF/EPHB2/KRAS/NGF/SERPINE2/IL6/DBNL/ACTR2/FGF2/CRABP2/SLIT2/NTRK2/NOTCH1/ITGB1/VEGFC/POU4F2/KIT/FAIM/DMTN/TBC1D24/DISC1/SLC9B2/SHH/GPER1/CX3CR1/RGS14/LIMS1/LPAR3/MAP6/FGG/FGA/PDE3A/DAG1/LIG4/BDNF/CALR/CDH4/ADIPOQ/PLAG1/SS18L1/CIB1/MME/MTOR/GPRASP3/TGM2/GDI1/TNF/TNF/LTA/TNF/LTA/TNF/TNF/TNF/TNF/LTA/LTA/TNF/LTA/TWF2/SHANK3/PRKDC/CUX1/ITGB3/NEFL/WNT3/WNT3 | 107 |
| GO:0035303 | regulation of dephosphorylation | 55/3662 | 125/15509 | 3.83165e-07 | 4.97873e-06 | 2.99412e-06 | PTBP1/MTMR1/ROCK1/SMG6/PTPRC/GSK3B/PPP1R15A/FKBP1A/HSP90AB1/PPP6R2/PPP1R16B/URI1/TGFB1/CD33/IFNG/PPP2R5D/PDGFRB/PTPA/MASTL/CRY2/BMP2/PIN1/STYXL1/ENSA/CALM2/BOD1/GNA12/SPPL3/PPP1R15B/CALM3/PRKCD/NSMF/CHP2/ANKLE2/PPP1R2/MAGI2/PPIA/SRC/MTOR/SMG5/CSNK2B/TNF/PPP1R11/TNF/TNF/CSNK2B/CSNK2B/TNF/TNF/CSNK2B/TNF/TNF/TNF/CSNK2B/PTPRC | 55 |
| GO:0034968 | histone lysine methylation | 51/3662 | 113/15509 | 3.85875e-07 | 5.00346e-06 | 3.00899e-06 | NFYA/KDM1A/KMT2E/ARID4B/KDM4A/NFYC/ATRX/DNMT3B/SMARCB1/SETD6/DOT1L/EZH2/GATA3/EZH1/NSD2/HCFC2/MACROH2A1/KDM3A/ASH1L/MYB/PHF19/H1-3/ASH2L/PRDM12/DNMT1/MEN1/SKIC8/SMAD4/BOD1/OGT/NSD3/LMNA/GFI1/PYGO2/NSD1/NNMT/SETD5/H1-4/HCFC1/TRMT112/SETD2/SETD3/KMT5A/TET3/H1-2/PAX5/WDR5/WDR5B/NCOA6/SMARCB1/PAGR1 | 51 |
| GO:0038061 | NIK/NF-kappaB signaling | 53/3662 | 119/15509 | 3.87431e-07 | 5.01314e-06 | 3.01482e-06 | MAP3K14/BIRC3/EIF2AK2/SPI1/RHOA/MKRN2/TRAF4/NFKBIA/BMP7/RASSF2/NFAT5/NOD1/IL12B/CD86/PRDX1/TNFRSF10B/IL1B/RBCK1/CHI3L1/PTPN22/TLR4/CCN3/PPM1B/APP/EGFR/PPP4C/IL18/NDUFC2/ADIPOR1/TLR3/TRIM44/NOD2/LGALS9/LIMS1/CD14/ALK/CCL19/RELA/CALR/IRAK1/PTP4A3/TLR7/TNF/TMSB4X/TNF/CHUK/CPNE1/TNF/TNF/TNF/TNF/TNF/TNF | 53 |
| GO:0002888 | positive regulation of myeloid leukocyte mediated immunity | 18/3662 | 25/15509 | 4.1682e-07 | 5.371e-06 | 3.23002e-06 | BTK/TYROBP/SPI1/DDX1/MAVS/ARG1/C3/ITGB2/PTAFR/ITGAM/HLA-E/CD177/HLA-E/HLA-E/HLA-E/HLA-E/HLA-E/HLA-E | 18 |
| GO:2000353 | positive regulation of endothelial cell apoptotic process | 18/3662 | 25/15509 | 4.1682e-07 | 5.371e-06 | 3.23002e-06 | CD40/CD40LG/CCL2/ITGA4/CD160/FASLG/FOXO3/THBS1/GPER1/AKR1C3/HLA-G/HLA-G/HLA-G/HLA-G/HLA-G/HLA-G/HLA-G/HLA-G | 18 |
| GO:0018205 | peptidyl-lysine modification | 129/3662 | 369/15509 | 4.29152e-07 | 5.51844e-06 | 3.31869e-06 | NFYA/KDM1A/KMT2E/MED24/BAZ1B/SNAI2/FOXP3/NNAT/ARID4B/KDM4A/NFYC/SPI1/SIRT2/MBD3/ACTB/PIAS2/ZMPSTE24/ATRX/ATXN7L3/DNMT3B/BRPF3/BAG6/SMARCB1/RASD2/RANGAP1/JADE3/SETD6/UBE2I/EYA1/DOT1L/EZH2/GATA3/ZMIZ1/EZH1/NSD2/NAA40/HCFC2/ZNF451/MACROH2A1/KAT2B/SF3B1/KDM3A/PARK7/ASH1L/DR1/MYB/PHF19/SLF2/EGR1/NAA50/EGR2/EEF1AKMT3/MORF4L2/SIRT5/H1-3/SOX4/DEK/RNF113A/YEATS4/LIF/ASH2L/PRDM12/DNMT1/PIAS3/PRKAA1/MYBBP1A/WBP2/MEN1/LOXL2/TAF5L/EPC2/IRF4/ATAT1/SENP7/BRCA2/SKIC8/SMAD4/FKBP10/SAE1/ARNT/BOD1/OGT/NSD3/KAT14/MBIP/SMARCA5/RANBP2/BRPF1/CTBP1/LMNA/TAF6L/GFI1/PYGO2/NSD1/BRD7/NNMT/SETD5/H1-4/HINT1/TADA3/HCFC1/KAT5/RELA/TRMT112/MSL2/TAF7/SETD2/SETD3/KMT5A/SUMO3/MUC1/TET3/H1-2/NOC2L/PAX5/WDR5/TRRAP/WDR5B/NCOA6/BAG6/ZBED1/BAG6/BAG6/BAG6/BAG6/SMARCB1/TADA2A/PCGF2/PAGR1 | 129 |
| GO:0002876 | positive regulation of chronic inflammatory response to antigenic stimulus | 13/3662 | 15/15509 | 4.47414e-07 | 5.74135e-06 | 3.45275e-06 | TNF/TNF/LTA/TNF/LTA/TNF/TNF/TNF/TNF/LTA/LTA/TNF/LTA | 13 |
| GO:0034284 | response to monosaccharide | 74/3662 | 185/15509 | 4.61367e-07 | 5.87726e-06 | 3.53448e-06 | BAD/CASR/CYBA/RHOA/PDK3/PRKACA/OPRK1/OXCT1/NOX4/ICAM1/ANGPT2/SMARCB1/XBP1/PCK2/SLC39A14/PPP3CB/RPS6KB1/PPARD/SLC29A1/IL1A/FOXO3/EIF2B2/GPAM/EGR1/PTK2B/CAT/SOX4/RUNX2/NKX2-2/NR1D1/SESN2/PRKAA1/MEN1/GLUL/THBS1/KHK/IGF1R/SMAD4/COL6A2/PKLR/EPHA5/TCF7L2/TGFBR2/SLC9B2/CASP3/GPER1/CCDC186/PRKCE/NPTX1/KAT5/BRSK2/LEP/SMAD2/LPL/ERN1/RMI1/ADIPOQ/PLCB1/MAFA/SLC8A1/PIM3/SELENOT/TNF/TNF/TNF/TNF/TNF/TNF/TNF/TNF/PKLR/TXNIP/SMARCB1/PRKACA | 74 |
| GO:0043405 | regulation of MAP kinase activity | 74/3662 | 185/15509 | 4.61367e-07 | 5.87726e-06 | 3.53448e-06 | HYAL2/FGFR1/PTPRC/NOX4/P2RX7/PDGFB/CD40/BMP7/FLT1/AXIN1/CSK/SFRP1/TGFB1/PIK3CG/EZH2/DKK1/MAP2K6/SH2B3/FZD10/PDGFRB/WNT5A/PTK2B/FLT3/IL1B/BMP2/AJUBA/APOE/PTPN22/SPRY2/TLR4/SORL1/THBS1/FGF2/EGF/MAP3K12/TNFRSF11A/DUSP10/PDGFC/EGFR/UCHL1/KIT/DVL3/PRKCD/DUSP7/SYK/NOD2/CDK12/ADAM9/RGS14/CCL19/HRAS/FZD4/ERN1/ADIPOQ/IRAK1/HGS/SPRY4/SRC/MAP3K5/ELANE/TNF/TNF/TNF/TNF/TNF/TNF/TNF/TNF/GH1/PTPRC/CD24/LOC102724560/MIF/ELANE | 74 |
| GO:0048754 | branching morphogenesis of an epithelial tube | 61/3662 | 144/15509 | 4.61799e-07 | 5.87726e-06 | 3.53448e-06 | HOXA11/CASR/TIE1/FGFR2/GLI2/SIRT6/PGR/ESR1/ABL1/BMP7/LAMA1/EYA1/TMEM59L/MET/HOXA5/ENG/AREG/MDK/VDR/WNT5A/KDM5B/PKD2/GNA13/BMP2/KDR/LAMA5/KRAS/SPRY2/NKX2-1/FGF2/EGF/GREB1L/SMAD4/EPHA2/SLIT2/ADAMTS16/NOTCH1/MMP14/WNT4/RBM15/TGFBR2/SHH/BTRC/SEMA3E/CCL11/DAG1/CTNNBIP1/NOG/CSF1/PBX1/SRC/NRARP/FKBPL/TNF/TNF/TNF/TNF/TNF/TNF/TNF/TNF | 61 |
| GO:0090316 | positive regulation of intracellular protein transport | 61/3662 | 144/15509 | 4.61799e-07 | 5.87726e-06 | 3.53448e-06 | CDH1/IPO5/HYAL2/CSNK2A2/PRKACA/SIRT6/PCM1/GSK3B/MAVS/HSP90AB1/SH3GLB1/GZMB/PDCD5/TGFB1/GSK3A/MAPK8/ZPR1/CD81/IFNG/MAPK14/TMEM30A/TARDBP/IL1B/ERGIC3/RAC2/PRKAA1/XPO4/NMT1/ANP32B/SORL1/CEP131/SAE1/PIK3R1/TCF7L2/BAG3/ITGB2/PCNT/BAP1/PRKCD/SHH/CDK5/CHP2/MFF/ITGAM/CDK1/LEP/HRAS/PDZK1/ATG13/CDK5R1/MIEF2/CIB1/UBE2L3/UBL5/HSPA1L/HSPA1L/FIS1/HSPA1L/HSPA1L/HSPA1L/PRKACA | 61 |
| GO:0006509 | membrane protein ectodomain proteolysis | 28/3662 | 49/15509 | 4.67615e-07 | 5.93909e-06 | 3.57166e-06 | TNFRSF1B/ROCK1/P2RX7/MYH9/SH3D19/IFNG/IL1B/APOE/ADAM19/IL10/MMP7/FURIN/PSEN2/RBMX/ADAM9/DAG1/RGMA/PRTN3/TNF/PSENEN/TNF/TNF/TNF/TNF/TNF/TNF/TNF/PRTN3 | 28 |
| GO:0009743 | response to carbohydrate | 82/3662 | 211/15509 | 4.76594e-07 | 6.04076e-06 | 3.6328e-06 | BAD/CASR/CYBA/MAP2K4/RHOA/PDK3/PRKACA/OPRK1/OXCT1/APOB/NOX4/ICAM1/ANGPT2/SMARCB1/XBP1/PCK2/ADNP/SLC39A14/PPP3CB/RPS6KB1/MAP2K6/PPARD/SLC29A1/IL1A/FOXO3/EIF2B2/GPAM/EGR1/PTK2B/CAT/SOX4/RUNX2/IL1B/NKX2-2/NR1D1/SESN2/PRKAA1/MEN1/GLUL/THBS1/KHK/IGF1R/SMAD4/COL6A2/PKLR/EPHA5/TCF7L2/TGFBR2/SLC9B2/CASP3/GPER1/CCDC186/PRKCE/NPTX1/KAT5/BRSK2/LEP/SMAD2/LPL/ERN1/RMI1/NQO1/ADIPOQ/PLCB1/MAFA/SLC8A1/ZFP36L1/P2RX2/PIM3/SELENOT/TNF/TNF/TNF/TNF/TNF/TNF/TNF/TNF/PKLR/TXNIP/SMARCB1/PRKACA | 82 |
| GO:0097305 | response to alcohol | 89/3662 | 234/15509 | 4.8044e-07 | 6.07707e-06 | 3.65464e-06 | BAD/OSBPL7/BAK1/CDH1/H6PD/FOXP3/RAD51/CYBA/F7/FGFR2/RHOA/ST6GAL1/GNB1/OPRK1/OXCT1/SLC23A2/MLC1/SFRP1/TGFB1/HAMP/AHR/TGFBR1/GATA3/CSF3/RPS6KB1/RECQL5/CCND1/XRN1/FOXO3/KLF9/DNMT3A/CRHR1/PTK2B/CAT/INHBA/FOSB/CCR7/CDO1/CYP2E1/RARA/PRKAA1/CCL21/FDX1/CYP1B1/ACTR2/IGF1R/TNFRSF11A/SOD1/PARP1/SLIT2/ALAD/CALM3/CCR5/SCNN1D/VCAM1/INHBB/TGFBR2/ADCY1/TP53INP1/CYBB/CDK1/FOS/MGMT/CD14/PRKCE/BCL2L1/CCL19/DAG1/LEP/SMAD2/FOSL1/A2M/GRIN1/TYMS/NQO1/ADIPOQ/SLIT3/AKR1C3/RPL10A/TNF/TNF/TNF/TNF/TNF/TNF/TNF/TNF/NEFL/LRP6 | 89 |
| GO:2000377 | regulation of reactive oxygen species metabolic process | 59/3662 | 138/15509 | 4.86696e-07 | 6.14199e-06 | 3.69369e-06 | TYROBP/CYBA/RHOA/PDK3/SIRT2/ARG2/PDGFB/BMP7/ACP5/TGFB1/CRYAB/FOXM1/MAPK14/PDGFRB/PARK7/GADD45A/FOXO3/PTK2B/SIRT5/CDKN1A/BECN1/TRAP1/RAC2/CD36/TLR4/TFAP2A/THBS1/CYP1B1/SOD1/FOXO1/NDUFC2/ITGB2/TGFBR2/PRKCD/STK17A/SYK/PRDX2/ITGAM/SLC25A33/LEP/GRIN1/GRB2/F2/ADGRB1/PRKN/AKR1C3/SLC5A3/TNF/CD177/TNF/TNF/TNF/TNF/TNF/TNF/TNF/EIF6/HP/AATF | 59 |
| GO:2000516 | positive regulation of CD4-positive, alpha-beta T cell activation | 26/3662 | 44/15509 | 4.87554e-07 | 6.14199e-06 | 3.69369e-06 | FOXP3/IL4R/IL12RB1/CD81/IFNG/IL12B/CD86/CD160/MYB/CD80/RARA/HLX/IL2RG/IL18/TGFBR2/LGALS9/CCL19/CD28/KLHL25/SOCS1/CD55/HLA-DRA/HLA-DRA/HLA-DRA/HLA-DRA/HLA-DRA | 26 |
| GO:0070227 | lymphocyte apoptotic process | 38/3662 | 76/15509 | 4.937e-07 | 6.2068e-06 | 3.73266e-06 | ST3GAL1/BTK/CD74/FAS/BAK1/ARG2/BAX/P2RX7/BIRC7/CLC/PRKD2/KDELR1/JAK3/BCL6/WNT5A/FASLG/GPAM/PKN1/BCL11B/IL2RA/IL10/TNFRSF21/BCL2L11/TSC22D3/RAG1/FADD/LGALS9/PRELID1/EFNA1/PTCRA/ORMDL3/AURKB/CHEK2/NOC2L/CCL5/CCL5/MIF/PTEN | 38 |
| GO:0046330 | positive regulation of JNK cascade | 46/3662 | 99/15509 | 5.07085e-07 | 6.36217e-06 | 3.8261e-06 | WNT16/NOX1/FLT4/TRAF1/HIPK2/MAP2K4/FCGR2B/TRAF4/GADD45B/BIRC7/RASSF2/AXIN1/PYCARD/NOD1/WNT5A/IL1A/GADD45A/PTK2B/IL1B/CCR7/EDA2R/TRAF3/TLR4/CCL21/APP/MBIP/TLR3/NOD2/CCL19/HRAS/PLCB1/CARD9/WNT7B/HMGB1/MAP3K5/TNF/TNF/TNF/TNF/TNF/TNF/TNF/TNF/NAIP/NAIP/NAIP | 46 |
| GO:0051099 | positive regulation of binding | 66/3662 | 160/15509 | 5.14074e-07 | 6.43683e-06 | 3.871e-06 | KDM1A/PON1/HFE/IGF1/HIPK2/SIRT2/ADD2/GSK3B/ADD1/FKBP1A/HSP90AB1/ABL1/MMP9/ERCC2/MED25/TGFB1/MET/EDF1/GATA3/CSF3/IFNG/PPP2CA/NPHP3/WNT5A/HES1/PARK7/STMN1/LRP1/USP9X/BMP2/PIN1/APOE/RARA/MEN1/NGF/NCBP1/DERL1/IRF4/EGF/RB1/APP/PARP1/CALM2/TCF7L2/POU4F2/POU4F1/ZNF618/SPPL3/SKI/EPB41/CALM3/PYGO2/SPTA1/TERT/CDK5/NMD3/CTBP2/BDNF/ANXA2/EIF3C/PRKN/H1-0/HMGB1/EBF2/NME1/B2M | 66 |
| GO:0070304 | positive regulation of stress-activated protein kinase signaling cascade | 56/3662 | 129/15509 | 5.17252e-07 | 6.46357e-06 | 3.88708e-06 | WNT16/NOX1/MAPK8IP2/FLT4/EIF2AK2/TRAF1/HIPK2/MAP2K4/SPI1/FCGR2B/TRAF4/OPRK1/RNF13/GADD45B/BIRC7/RASSF2/AXIN1/PYCARD/NOD1/WNT5A/IL1A/GADD45A/PTK2B/IL1B/BMP2/CCR7/PRMT1/EDA2R/TRAF3/TLR4/CCL21/APP/ARL6IP5/MBIP/TLR3/NOD2/SEMA4C/CCL19/LEP/HRAS/PLCB1/CARD9/WNT7B/HMGB1/MAP3K5/TNF/TNF/TNF/TNF/TNF/TNF/TNF/TNF/NAIP/NAIP/NAIP | 56 |
| GO:0071383 | cellular response to steroid hormone stimulus | 76/3662 | 192/15509 | 5.30777e-07 | 6.54627e-06 | 3.93681e-06 | KDM1A/CRY1/RNF14/UFL1/PLPP1/RHOA/TP63/PIAS2/PGR/ESR1/RBFOX2/PCK2/BMP7/SFRP1/PLAT/URI1/GSK3A/ZMIZ1/RPS6KB1/DDX5/HSPA8/PPARD/KDM3A/PARK7/HDAC1/PADI2/ARID1A/ARG1/FOXO3/KLF9/NR4A3/CRY2/FLT3/PKN1/CNOT1/NR1D1/ZFP36/YWHAH/ASS1/WBP2/CYP1B1/IGF1R/CARM1/PARP1/CNOT9/POU4F2/ZFP36L2/BCL2L11/NODAL/STC1/PRMT2/SCNN1D/ATP1A1/HEYL/GPER1/TRIM68/DDIT4/PAQR8/TADA3/CYP7B1/ESRRA/TAF7/CALR/SSTR2/ZFP36L1/UBE2L3/AKR1C3/SRC/KANK2/RXRB/DAXX/DAXX/DAXX/DAXX/DAXX/PAGR1 | 76 |
| GO:0045667 | regulation of osteoblast differentiation | 54/3662 | 123/15509 | 5.31252e-07 | 6.54627e-06 | 3.93681e-06 | LTF/IGF1/SNAI2/HGF/FGFR2/PRKACA/TP63/BMP7/RASSF2/SFRP1/BMPR1A/DDX5/AREG/FBXO5/SMAD5/RUNX2/BMP2/TWSG1/MEN1/IL6/SMAD6/FGF2/FBN2/TOB1/CCN1/NOTCH1/VEGFC/CRIM1/BMP6/SKI/IL6R/WNT4/RANBP3L/PTK2/RIOX1/CEBPB/ESRRA/FAM20C/CTNNBIP1/NOG/IFITM1/WNT7B/TNF/TNF/CEBPD/TNF/TNF/TNF/TNF/TNF/TNF/CEBPA/CRIM1/PRKACA | 54 |
| GO:0071803 | positive regulation of podosome assembly | 14/3662 | 17/15509 | 5.31259e-07 | 6.54627e-06 | 3.93681e-06 | RHOA/IL5/LCP1/MSN/CSF2/SRC/TNF/TNF/TNF/TNF/TNF/TNF/TNF/TNF | 14 |
| GO:2001199 | negative regulation of dendritic cell differentiation | 14/3662 | 17/15509 | 5.31259e-07 | 6.54627e-06 | 3.93681e-06 | FCGR2B/LILRB1/HLA-G/HLA-G/HLA-G/HLA-G/HLA-G/HLA-G/HLA-G/LILRB1/HLA-G/LILRB1/LILRB1/LILRB1 | 14 |
| GO:0035740 | CD8-positive, alpha-beta T cell proliferation | 16/3662 | 21/15509 | 5.31264e-07 | 6.54627e-06 | 3.93681e-06 | PTPN22/HLA-E/HLA-E/HLA-A/HLA-A/HLA-A/HLA-A/HLA-E/HLA-A/HLA-A/HLA-E/HLA-E/HLA-A/HLA-E/HLA-A/HLA-E | 16 |
| GO:1902563 | regulation of neutrophil activation | 16/3662 | 21/15509 | 5.31264e-07 | 6.54627e-06 | 3.93681e-06 | GRN/SPI1/FCGR2B/ITGB2/SYK/PTAFR/ITGAM/TNF/CD177/TNF/TNF/TNF/TNF/TNF/TNF/TNF | 16 |
| GO:2000564 | regulation of CD8-positive, alpha-beta T cell proliferation | 16/3662 | 21/15509 | 5.31264e-07 | 6.54627e-06 | 3.93681e-06 | PTPN22/HLA-E/HLA-E/HLA-A/HLA-A/HLA-A/HLA-A/HLA-E/HLA-A/HLA-A/HLA-E/HLA-E/HLA-A/HLA-E/HLA-A/HLA-E | 16 |
| GO:0002514 | B cell tolerance induction | 10/3662 | 10/15509 | 5.3366e-07 | 6.54975e-06 | 3.9389e-06 | FOXJ1/TGFBR2/HLA-G/HLA-G/HLA-G/HLA-G/HLA-G/HLA-G/HLA-G/HLA-G | 10 |
| GO:0060559 | positive regulation of calcidiol 1-monooxygenase activity | 10/3662 | 10/15509 | 5.3366e-07 | 6.54975e-06 | 3.9389e-06 | IFNG/IL1B/TNF/TNF/TNF/TNF/TNF/TNF/TNF/TNF | 10 |
| GO:0042130 | negative regulation of T cell proliferation | 39/3662 | 79/15509 | 5.35234e-07 | 6.55608e-06 | 3.94271e-06 | FOXP3/ARG2/LILRB1/CD86/ARG1/CD80/TWSG1/FOXJ1/NDFIP1/SFTPD/IL2RA/IL10/TNFRSF21/CTLA4/CASP3/SHH/LGALS9/CEBPB/GLMN/LILRB4/PDCD1LG2/CR1/HLA-G/HLA-G/HLA-G/HLA-G/HLA-G/HLA-G/HLA-G/LILRB1/LILRB4/HLA-G/LILRB1/LILRB1/LILRB1/LILRB4/LILRB4/PTEN/ITCH | 39 |
| GO:0009408 | response to heat | 52/3662 | 117/15509 | 5.38562e-07 | 6.58384e-06 | 3.9594e-06 | IGF1/ATXN3/PRKACA/GSK3B/HSP90AB1/RBBP7/DNAJB6/HSPB1/CXCL12/RPS6KB1/CRYAB/CHORDC1/CALCA/IL1A/EIF2B2/HSPA2/THBS1/SOD1/PKLR/POLR2D/STAC/BAG3/CLPB/IER5/MAPKAPK2/NOS3/TP53INP1/VCP/CD14/MICA/IRAK1/TRPV1/MTOR/DAXX/DAXX/MICB/MICB/HSBP1L1/DAXX/MICB/DAXX/MICB/MICA/MICB/DAXX/MICA/MICA/MICB/PDCD6/PKLR/CHORDC1/PRKACA | 52 |
| GO:0019722 | calcium-mediated signaling | 78/3662 | 199/15509 | 6.02784e-07 | 7.35443e-06 | 4.42283e-06 | SELE/CD4/BTK/PTBP1/CD22/IGF1/ATP2B4/ERBB3/PRKACA/PTPRC/GSK3B/P2RX5/ZMPSTE24/LAT2/P2RX7/NFATC2/NFAT5/PPP3CB/CCL20/ZAP70/FHL2/NR5A2/RCAN3/PTK2B/CXCR4/CCR7/DYRK2/KDR/TNNI3/PRKAA1/EDNRB/PLCE1/CALM2/ANK2/GSTO1/ITPR1/SPPL3/DMTN/CALM3/CXCR5/CCR5/VCAM1/CXCR1/SYK/CHP2/CX3CR1/CXCL8/HINT1/KSR2/EIF2AK3/RCAN2/CCR9/SELP/ATP2A2/GRIN1/CXCR2/SLC8A1/CCR4/CIB1/CXCR3/P2RX2/MTOR/TNF/TNF/STIMATE/FIS1/TNF/TNF/TNF/TNF/TNF/TNF/P2RY11/PTPRC/CCL4/CCL4/CCL4/PRKACA | 78 |
| GO:0070098 | chemokine-mediated signaling pathway | 41/3662 | 85/15509 | 6.08762e-07 | 7.41278e-06 | 4.45791e-06 | CCL22/CCL17/CXCL12/CCL2/SH2B3/CCL20/PADI2/MPL/GPR75/PTK2B/CXCR4/RNF113A/CCR7/CCL21/SLIT2/CXCL13/CXCR5/CCR5/RBM15/CXCR1/PF4/WBP1L/CX3CR1/CXCL8/CCL11/CCL19/CCR9/CXCR2/CCR4/SLIT3/CIB1/CXCR3/ACKR1/CCL5/CCL5/CCL4/CCL18/CCL4/CCL4/CCL18/CCL18 | 41 |
| GO:2000107 | negative regulation of leukocyte apoptotic process | 32/3662 | 60/15509 | 6.10257e-07 | 7.41642e-06 | 4.4601e-06 | ST3GAL1/CD74/ST6GAL1/ARG2/LILRB1/JAK3/CXCL12/BCL6/GPAM/CCR7/BCL11B/CCL21/MERTK/TSC22D3/RAG1/NOD2/FADD/EFNA1/BCL2L1/PTCRA/ORMDL3/CCL19/AURKB/CXCR2/NOC2L/CCL5/CCL5/LILRB1/LILRB1/MIF/LILRB1/LILRB1 | 32 |
| GO:0050852 | T cell receptor signaling pathway | 61/3662 | 145/15509 | 6.15247e-07 | 7.46243e-06 | 4.48778e-06 | BTN3A1/FOXP3/PTPRC/ABL1/CSK/KCNN4/PRKD2/GATA3/CD81/PDE4D/ZAP70/CD160/EIF2B2/RBCK1/CCR7/NECTIN2/PTPN22/TNFRSF21/CD8A/SPPL3/ICOSLG/CTLA4/BTNL9/INPP5D/RELA/HRAS/PTPN2/CD28/HLA-DQB1/CACNB4/PDE4B/BTN3A2/LILRB4/HLA-DQB1/HLA-DQB1/HLA-A/HLA-A/HLA-DPB1/HLA-DPB1/HLA-A/HLA-A/HLA-DQB1/HLA-DPB1/HLA-A/HLA-A/HLA-DPB1/HLA-DPB1/HLA-DPB1/HLA-DQB1/HLA-A/HLA-DQB1/HLA-DQB1/HLA-A/HLA-DPB1/HLA-DPB1/PTPRC/IKBKG/LILRB4/LILRB4/LILRB4/INPP5D | 61 |
| GO:0032388 | positive regulation of intracellular transport | 73/3662 | 183/15509 | 6.22866e-07 | 7.54009e-06 | 4.53448e-06 | CDH1/IPO5/HYAL2/CSNK2A2/PRKACA/SPAG5/SIRT6/ACTN2/PCM1/GSK3B/MAVS/HSP90AB1/SH3GLB1/MLC1/GZMB/PDCD5/TGFB1/GSK3A/MAPK8/ZPR1/CD81/IFNG/MAPK14/TMEM30A/NRDE2/TARDBP/IL1B/ERGIC3/RAC2/PRKAA1/XPO4/NMT1/ANP32B/NUMA1/SORL1/RDX/CEP131/SAE1/SNAPIN/PIK3R1/MSN/TCF7L2/BAG3/LDLRAP1/ITGB2/PCNT/BAP1/PRKCD/SHH/CDK5/CHP2/MFF/ITGAM/CDK1/LEP/HRAS/PDZK1/ATG13/CDK5R1/MIEF2/ANXA2/CIB1/PRKN/UBE2L3/PGAP1/UBL5/HSPA1L/HSPA1L/FIS1/HSPA1L/HSPA1L/HSPA1L/PRKACA | 73 |
| GO:0050767 | regulation of neurogenesis | 124/3662 | 354/15509 | 6.34878e-07 | 7.67051e-06 | 4.61291e-06 | KDM1A/TMEM98/IFRD1/PAFAH1B1/UFL1/TNFRSF1B/CDH1/NTN1/KDM4A/SIRT2/PLXNA2/PCM1/TP73/XRCC5/LRP2/ADNP/BMP7/TGFB1/PTN/EZH2/CXCL12/BMPR1A/WNT3/EFNB3/MDK/IFNG/DBN1/WNT5A/HES1/FN1/ID2/HDAC1/SPP1/CXCR4/EGR2/OBSL1/IL1B/NKX2-2/BMP2/ID1/NR1D1/YWHAH/LIF/PER2/EPHB2/KRAS/BHLHE40/NGF/LRP4/SERPINE2/IL6/DBNL/KIAA0319/SORL1/ACTR2/FGF2/RB1/CRABP2/DUSP10/HES6/CTDSP1/SLIT2/NTRK2/NOTCH1/ITGB1/VEGFC/POU4F2/POU4F1/KIT/DPYSL5/SKI/FAIM/TBC1D24/DISC1/HEYL/SHH/GPER1/CDK5/CX3CR1/SEMA4C/RGS14/SEMA3E/LPAR3/MAP6/CCL11/DAG1/LIG4/BDNF/CDH4/F2/PLAG1/ANXA2/NOG/SS18L1/NF2/DCC/MME/SYNGAP1/MBP/MTOR/GPRASP3/TGM2/GDI1/TNF/TNF/LTA/TNF/LTA/TNF/TNF/TNF/TNF/LTA/LTA/TNF/LTA/TWF2/SHANK3/CUX1/B2M/NEFL/WNT3/WNT3/PTEN | 124 |
| GO:0036293 | response to decreased oxygen levels | 105/3662 | 289/15509 | 6.45556e-07 | 7.78435e-06 | 4.68137e-06 | BAD/CD38/CASR/CYBA/F7/HIPK2/RHOA/PDK3/SIRT2/MMP2/ALKBH5/ANGPT2/BMP7/SFRP1/PLAT/CXCL12/CRYAB/SLC11A2/PPARD/SLC29A1/IL1A/EPAS1/SLC2A1/MPL/FOXO3/PGF/DNMT3A/EGR1/PTK2B/CAT/CXCR4/BMP2/BECN1/PIN1/HP1BP3/GNGT1/AJUBA/CBFA2T3/EPO/PRKAA1/LOXL2/THBS1/TMBIM6/BNIP2/CYP1A1/SMAD4/PMAIP1/ARNT/PKLR/PSEN2/CCNA2/ALAD/NOTCH1/VEGFC/ITPR1/NR4A2/DDAH1/MMP14/ALAS2/STC1/LMNA/AK4/VCAM1/CAPN2/ERCC3/TGFBR2/FABP1/CASP3/TERT/CYBB/AQP3/HIF1AN/DDIT4/RBPJ/FOS/PRKCE/ARNT2/LEP/OXTR/ADIPOQ/SLC8A1/IRAK1/ZFP36L1/P2RX2/SRC/DPP4/MTOR/TNF/TNF/LTA/TNF/LTA/TNF/TNF/TNF/TNF/LTA/LTA/TNF/LTA/ADSL/PKLR/CD24/LOC102724560/PTEN | 105 |
| GO:0010498 | proteasomal protein catabolic process | 155/3662 | 463/15509 | 6.61533e-07 | 7.96152e-06 | 4.78792e-06 | CDC27/OSBPL7/RHBDF1/PSMB1/HFE/PSMC4/RNF14/UFL1/HSPA5/HERPUD1/RNF4/ATXN3/PSME4/SIRT2/SEL1L/PRKACA/FBXW11/DERL2/TBX21/MKRN2/TRAF4/SIRT6/UBE2A/UBE2K/PCNP/GSK3B/XPO1/PSMC5/NSFL1C/ANAPC5/PSME1/HECTD1/BAG6/HSP90AB1/PSMD8/XBP1/KCTD17/PSMC6/PSMA3/PSMA6/USP14/SMAD7/UGGT2/N4BP1/AXIN1/BFAR/SGTA/GSK3A/DVL1/ATE1/FBXW4/PSMD3/CCDC47/UBE4A/USP5/MAN1A1/SKP1/PARK7/CDC20/FBXL5/RAD23B/AREL1/CLU/TRIM25/USP9X/KLHDC3/RBCK1/NR1D1/FBXL12/CBFA2T3/APOE/ADRM1/PSME3/UBE2G1/FBXO44/HSPBP1/RNF122/APC/AKIRIN2/ECPAS/DERL1/FAM8A1/RNF121/CUL4A/ARRB2/CSNK1D/PMAIP1/DTL/SPOPL/FEM1C/GNA12/TLK2/OGT/ERLIN2/EIF3H/ALAD/DNAJB12/RNF144A/CLGN/UCHL1/FBXL18/USP25/UBXN11/CUL4B/ZFAND2B/PSMB4/PSMC2/SPSB3/WDR26/RYBP/PSMD6/RCHY1/SHH/TMUB1/VCP/NEMF/PSMC3/BTRC/UBXN6/RNF187/ENC1/SPSB1/KAT5/PSMD1/BRSK2/GLMN/KCTD13/PSMD2/DDIT3/CALR/YOD1/PRKN/PRAME/USP7/PCBP2/DDI2/SVIP/WWP2/UBE2J1/DCAF12/RNF5/BAG6/FBXO48/TRIM13/PSMB10/BAG6/BAG6/BAG6/BAG6/CEBPA/FBXO17/PSMB3/PRKACA/F8A1/ITCH | 155 |
| GO:0097242 | amyloid-beta clearance | 25/3662 | 42/15509 | 6.67238e-07 | 8.00183e-06 | 4.81216e-06 | ROCK1/PICALM/LRP2/RAB11A/IFNG/IL4/HDAC1/CLU/LRP1/C3/APOE/LRP4/CD36/IGF1R/ITGB2/ITGAM/MME/TNF/TNF/TNF/TNF/TNF/TNF/TNF/TNF | 25 |
| GO:2000106 | regulation of leukocyte apoptotic process | 43/3662 | 91/15509 | 6.67465e-07 | 8.00183e-06 | 4.81216e-06 | ST3GAL1/BTK/CD74/ST6GAL1/ARG2/BAX/P2RX7/BIRC7/LILRB1/PRKD2/JAK3/CXCL12/BCL6/WNT5A/GPAM/CCR7/BCL11B/IL10/CCL21/BCL2L11/MERTK/TSC22D3/RAG1/NOD2/FADD/LGALS9/PRELID1/EFNA1/BCL2L1/PTCRA/ORMDL3/CCL19/AURKB/CXCR2/NOC2L/CCL5/CCL5/LILRB1/LILRB1/MIF/LILRB1/LILRB1/PTEN | 43 |
| GO:0060252 | positive regulation of glial cell proliferation | 20/3662 | 30/15509 | 6.69547e-07 | 8.0113e-06 | 4.81785e-06 | UFL1/NTN1/IL1B/KRAS/IL6/VEGFC/PLAG1/TNF/TNF/LTA/TNF/LTA/TNF/TNF/TNF/TNF/LTA/LTA/TNF/LTA | 20 |
| GO:0098727 | maintenance of cell number | 66/3662 | 161/15509 | 6.72248e-07 | 8.02812e-06 | 4.82797e-06 | PAF1/IGF1/MED17/ARID4B/BICRA/ELAVL1/SPI1/SMC1A/TP63/ACTB/PCM1/KDM2B/BCL7C/MED15/SMARCB1/BMP7/RBBP7/SETD6/SFRP1/PTN/EZH2/BMPR1A/SMC3/DDX6/BCL7A/HES1/KDM3A/BCL9/PRRX1/HDAC1/ARID1A/FOXO3/PHF19/SOX4/CNOT1/LIF/MED6/LOXL2/TAF5L/TET1/CUL4A/OGT/NOTCH1/HMGA2/FOXO1/ZFP36L2/KLF10/NODAL/KIT/SKI/FANCC/PADI4/TAF6L/SELENON/RBBP4/SAP30/MED30/RBPJ/CDH2/TRIM8/LIG4/NOG/BCL9L/ZNF358/SMARCB1/PADI4 | 66 |
| GO:0050851 | antigen receptor-mediated signaling pathway | 76/3662 | 193/15509 | 6.75321e-07 | 8.0493e-06 | 4.84071e-06 | CD38/CD79B/BTK/CD22/BTN3A1/FOXP3/FCGR2B/PTPRC/LAT2/BAX/SPG21/ABL1/NFATC2/CSK/KCNN4/PRKD2/CD79A/GATA3/LPXN/CD81/PDE4D/ZAP70/CD160/EIF2B2/RBCK1/CCR7/NECTIN2/PTPN22/CMTM3/TNFRSF21/CD8A/MS4A1/SPPL3/ICOSLG/CTLA4/SYK/BTNL9/INPP5D/RELA/HRAS/PTPN2/CD19/CD28/HLA-DQB1/CACNB4/PDE4B/BTN3A2/LILRB4/HLA-DQB1/HLA-DQB1/HLA-A/HLA-A/HLA-DPB1/HLA-DPB1/HLA-A/HLA-A/HLA-DQB1/HLA-DPB1/HLA-A/HLA-A/HLA-DPB1/HLA-DPB1/HLA-DPB1/HLA-DQB1/HLA-A/HLA-DQB1/HLA-DQB1/HLA-A/HLA-DPB1/HLA-DPB1/PTPRC/IKBKG/LILRB4/LILRB4/LILRB4/INPP5D | 76 |
| GO:0070201 | regulation of establishment of protein localization | 158/3662 | 474/15509 | 6.94641e-07 | 8.26369e-06 | 4.96964e-06 | BAD/CD38/RHBDF1/IGF1/CASR/CDH1/NNAT/IPO5/SP100/HYAL2/VPS35/CSNK2A2/PRKACA/DERL2/LLGL2/LMAN1/SIRT6/PCM1/GSK3B/XPO1/OXCT1/ACHE/DNM1L/MAVS/P2RX7/HSP90AB1/SH3GLB1/RANGAP1/GZMB/PCK2/FERMT1/NDFIP2/PARD6A/CSK/SFRP1/KCNN4/PDCD5/TGFB1/CD33/GSK3A/MAPK8/PPP3CB/NSD2/ZPR1/HSPA8/CD81/PSMD9/IFNG/PPARD/MAPK14/TMEM30A/APBB3/IL12B/IL1A/PARK7/P3H1/SERP1/TARDBP/ACSL3/SOX4/IL1B/ERGIC3/NR1D1/RAC2/APOE/DKC1/NDFIP1/PER2/PRKAA1/XPO4/CD36/MDFIC/CCT7/GLUL/LCP1/IL6/NMT1/TLR4/ANP32B/CCN3/SORL1/CEP131/SAE1/ENSA/EPHA5/PIK3R1/SNX12/GLUD1/TCF7L2/VEGFC/FOXO1/BAG3/BMP6/DMTN/ITGB2/PCNT/INHBB/BAP1/PRKCD/SLC9B2/ARFIP1/SHH/GPER1/CDK5/GAPVD1/CCT2/CHP2/ADAM9/PKIG/MFF/ITGAM/CDK1/PRKCE/FGG/FGA/BRSK2/LEP/HRAS/CEP135/PDZK1/ATG13/CDK5R1/MIEF2/PTPN11/YOD1/ADIPOQ/F2R/PTP4A3/CIB1/PRKN/UBE2L3/KCNJ11/CLN3/PPIA/SRC/SVIP/UBL5/PIM3/WWP2/UBE2J1/GDI1/HSPA1L/TNF/HSPA1L/TNF/FIS1/TNF/HSPA1L/TNF/TNF/TNF/TNF/TNF/HSPA1L/HSPA1L/CCL5/CCL5/PRKACA | 158 |
| GO:2001237 | negative regulation of extrinsic apoptotic signaling pathway | 45/3662 | 97/15509 | 7.10214e-07 | 8.43277e-06 | 5.07132e-06 | IGF1/SNAI2/HGF/GSK3B/ICAM1/GATA1/EYA1/IL7/SERPINE1/TGFBR1/UNC5B/RPS6KB1/EYA4/IL4/IL1A/PARK7/TNFAIP3/IL1B/PSME3/THBS1/ITGAV/COL2A1/TCF7L2/FAIM/LMNA/PEA15/PF4/TERT/CSF2/NOS3/PRDX2/BCL2L1/FGG/FGA/SCG2/RELA/SRC/TNF/TNF/TNF/TNF/TNF/TNF/TNF/TNF | 45 |
| GO:0032874 | positive regulation of stress-activated MAPK cascade | 55/3662 | 127/15509 | 7.15014e-07 | 8.47353e-06 | 5.09583e-06 | WNT16/NOX1/MAPK8IP2/FLT4/EIF2AK2/TRAF1/HIPK2/MAP2K4/SPI1/FCGR2B/TRAF4/OPRK1/GADD45B/BIRC7/RASSF2/AXIN1/PYCARD/NOD1/WNT5A/IL1A/GADD45A/PTK2B/IL1B/BMP2/CCR7/PRMT1/EDA2R/TRAF3/TLR4/CCL21/APP/ARL6IP5/MBIP/TLR3/NOD2/SEMA4C/CCL19/LEP/HRAS/PLCB1/CARD9/WNT7B/HMGB1/MAP3K5/TNF/TNF/TNF/TNF/TNF/TNF/TNF/TNF/NAIP/NAIP/NAIP | 55 |
| GO:0051223 | regulation of protein transport | 152/3662 | 453/15509 | 7.27209e-07 | 8.60161e-06 | 5.17286e-06 | BAD/CD38/RHBDF1/IGF1/CASR/CDH1/NNAT/IPO5/SP100/HYAL2/VPS35/CSNK2A2/PRKACA/DERL2/LLGL2/LMAN1/SIRT6/PCM1/GSK3B/XPO1/OXCT1/ACHE/DNM1L/MAVS/P2RX7/HSP90AB1/SH3GLB1/RANGAP1/GZMB/PCK2/FERMT1/NDFIP2/PARD6A/CSK/SFRP1/KCNN4/PDCD5/TGFB1/CD33/GSK3A/MAPK8/PPP3CB/ZPR1/HSPA8/CD81/PSMD9/IFNG/PPARD/MAPK14/TMEM30A/APBB3/IL12B/IL1A/PARK7/P3H1/SERP1/TARDBP/ACSL3/SOX4/IL1B/ERGIC3/NR1D1/RAC2/APOE/NDFIP1/PER2/PRKAA1/XPO4/CD36/MDFIC/GLUL/LCP1/IL6/NMT1/TLR4/ANP32B/CCN3/SORL1/CEP131/SAE1/ENSA/EPHA5/PIK3R1/SNX12/GLUD1/TCF7L2/VEGFC/FOXO1/BAG3/BMP6/DMTN/ITGB2/PCNT/INHBB/BAP1/PRKCD/SLC9B2/ARFIP1/SHH/GPER1/CDK5/GAPVD1/CHP2/ADAM9/PKIG/MFF/ITGAM/CDK1/PRKCE/FGG/FGA/BRSK2/LEP/HRAS/PDZK1/ATG13/CDK5R1/MIEF2/PTPN11/YOD1/ADIPOQ/F2R/CIB1/PRKN/UBE2L3/KCNJ11/CLN3/PPIA/SRC/SVIP/UBL5/PIM3/WWP2/UBE2J1/GDI1/HSPA1L/TNF/HSPA1L/TNF/FIS1/TNF/HSPA1L/TNF/TNF/TNF/TNF/TNF/HSPA1L/HSPA1L/CCL5/CCL5/PRKACA | 152 |
| GO:0002286 | T cell activation involved in immune response | 47/3662 | 103/15509 | 7.37158e-07 | 8.68613e-06 | 5.22369e-06 | ITGAL/TMEM98/SLC11A1/CD74/FOXP3/FCGR2B/TBX21/IL4R/ICAM1/IL12RB1/SMAD7/LILRB1/JAK3/GATA3/MDK/CD81/IFNG/IL12B/IL4/BCL6/CD86/MYB/CD80/RARA/LCP1/IL6/HLX/IRF4/IL21/IL18/CD1C/IL6R/LGALS9/CCL19/HMGB1/IFNA1/ENTPD7/MTOR/HLA-DRA/HLA-DRA/HLA-DRA/HLA-DRA/LILRB1/LILRB1/LILRB1/HLA-DRA/LILRB1 | 47 |
| GO:0018107 | peptidyl-threonine phosphorylation | 47/3662 | 103/15509 | 7.37158e-07 | 8.68613e-06 | 5.22369e-06 | DYRK4/CLK1/HIPK2/ROCK1/SIRT2/CSNK2A2/PRKACA/MARK2/UBE2K/GSK3B/BMP7/SMAD7/AXIN1/PRKD2/TGFB1/GSK3A/TGFBR1/MAPK8/WNT5A/DYRK2/CHI3L1/SPRY2/EGF/MAP3K12/APP/DYRK3/CALM2/PARD3/PRKCA/DMTN/CALM3/TGFBR2/PRKCD/CDK5/DDIT4/CDK1/CDK5R1/CDK10/SPRED2/MTOR/CSNK2B/CSNK2B/CSNK2B/CSNK2B/CSNK2B/PRKDC/PRKACA | 47 |
| GO:0035710 | CD4-positive, alpha-beta T cell activation | 49/3662 | 109/15509 | 7.4935e-07 | 8.80877e-06 | 5.29744e-06 | TMEM98/RUNX3/FOXP3/CBFB/TBX21/IL4R/ARG2/IL12RB1/SMAD7/JAK3/GATA3/CD81/IFNG/IL12B/IL4/BCL6/CD86/CD160/MYB/CD80/TWSG1/NDFIP1/RARA/IL2RA/IL6/HLX/IRF4/IL21/ARMC5/IL2RG/IL18/RUNX1/IL6R/TGFBR2/LGALS9/CCL19/CD28/KLHL25/SOCS1/HMGB1/CD55/ENTPD7/MTOR/HLA-DRA/HLA-DRA/HLA-DRA/HLA-DRA/HLA-DRA/ITCH | 49 |
| GO:0043200 | response to amino acid | 50/3662 | 112/15509 | 7.50408e-07 | 8.80877e-06 | 5.29744e-06 | BAD/UFL1/CPS1/RRAGD/CYBA/F7/IPO5/RHOA/MMP2/XBP1/RPS6KB1/LAMTOR3/ARG1/DNMT3A/BCL2L2/CDO1/ASS1/SESN2/DNMT1/PDGFRA/TMBIM6/IGF1R/MEAK7/PDGFC/EGFR/NTRK2/ALAD/ZEB1/SESN3/CAPN2/CASP3/CYBB/NSMF/BCL2L1/CEBPB/GRIN1/SLC38A9/NQO1/SOCS1/LAMTOR4/COL4A6/MTOR/TNF/TNF/TNF/TNF/TNF/TNF/TNF/TNF | 50 |
| GO:0097529 | myeloid leukocyte migration | 85/3662 | 223/15509 | 7.75015e-07 | 9.08042e-06 | 5.4608e-06 | PAFAH1B1/CD9/CD74/SPI1/WDR1/MMP2/DNM1L/PDGFB/CTSG/FLT1/CCL22/CCL17/PIK3CG/SERPINE1/CREB3/CXCL12/C1QBP/CCL2/MDK/CD81/CALCA/IL17A/IL4/IL1A/CCL20/CSF3R/PGF/PTK2B/NUP85/IL1B/CCR7/RAC2/MTUS1/SFTPD/EDNRB/IL6/CCN3/CCL21/THBS1/CYP19A1/TNFRSF11A/SLIT2/PIK3R1/VEGFC/CXCL13/MMP14/KIT/ITGB2/IL6R/CXCR1/PF4/SYK/NOD2/CX3CR1/RHOH/PTK2/CXCL8/SCG2/CCL11/BSG/CCL19/STAT5B/CXCR2/CSF1R/PLCB1/CSF1/PDE4B/HMGB1/PPIA/FUT4/PRTN3/CD47/DPP4/CD177/PECAM1/CCL5/CCL5/CCL4/CCL18/CCL4/MIF/PRTN3/CCL4/CCL18/CCL18 | 85 |
| GO:0001763 | morphogenesis of a branching structure | 73/3662 | 184/15509 | 7.96473e-07 | 9.31423e-06 | 5.60141e-06 | HOXA11/SNAI2/HGF/CASR/PRDM1/TIE1/FGFR2/TP63/GLI2/SIRT6/PGR/TMED2/ESR1/ABL1/BMP7/LAMA1/EYA1/SFRP1/TMEM59L/MET/HOXA5/ENG/AREG/MDK/VDR/WNT5A/KDM5B/PKD2/GNA13/BMP2/KDR/LAMA5/KRAS/SPRY2/NKX2-1/IL10/FGF2/EGF/GREB1L/SMAD4/EPHA2/SLIT2/ADAMTS16/NOTCH1/MMP14/WNT4/RBM15/TGFBR2/SHH/BTRC/FRS2/SEMA3E/CCL11/DAG1/GRB2/CTNNBIP1/SETD2/NOG/CSF1/PBX1/SRC/COL13A1/NRARP/TGM2/FKBPL/TNF/TNF/TNF/TNF/TNF/TNF/TNF/TNF | 73 |
| GO:0002312 | B cell activation involved in immune response | 39/3662 | 80/15509 | 8.07693e-07 | 9.42765e-06 | 5.66962e-06 | ST3GAL1/PARP3/FOXP3/SPI1/FCGR2B/TBX21/MLH1/PTPRC/MSH2/ABL1/XBP1/CD40/CD40LG/NBN/IL27RA/TGFB1/EXOSC3/NSD2/POU2AF1/AICDA/IL4/BCL6/PTK2B/SHLD2/NDFIP1/NOTCH2/IL6/IL10/TLR4/IL21/SLC15A4/IRF8/TNFSF13/LIG4/RAG2/CD19/CD28/CR1/PTPRC | 39 |
| GO:0034599 | cellular response to oxidative stress | 96/3662 | 260/15509 | 8.41429e-07 | 9.80296e-06 | 5.89533e-06 | WNT16/MPO/NOX1/BTK/HGF/GLRX2/AIFM2/TMEM161A/SIRT2/SLC25A24/MMP2/PXN/ABL1/GSKIP/APEX1/DHRS2/MMP9/BMP7/ABCC1/GSR/MET/HSPB1/EZH2/MAPK8/PPIF/EPAS1/PARK7/PRDX1/TNFAIP3/ARG1/FOXO3/PKD2/NR4A3/CAT/CHD6/STAU1/BECN1/TRAP1/MGAT3/SESN2/PRKAA1/PDGFRA/CD36/IL6/IL10/TLR4/IL18BP/CYP1B1/MEAK7/SOD1/ARNT/PARP1/RHOB/ARL6IP5/EGFR/NONO/FOXO1/NR4A2/FANCC/TBC1D24/SELENON/FABP1/PRKCD/NOS3/TP53INP1/FXN/PRDX2/CDK1/FOS/MGMT/RELA/ATP2A2/JUN/ERN1/NQO1/PRKN/AKR1C3/PPIA/DAPK1/SRC/MAP3K5/ZNF277/TNF/TNF/ZNF580/CHUK/TNF/TNF/TNF/TNF/TNF/TNF/GAS5/SRXN1/PCGF2/ABCC1 | 96 |
| GO:0044403 | biological process involved in symbiotic interaction | 101/3662 | 277/15509 | 8.66769e-07 | 1.00792e-05 | 6.06148e-06 | CD4/LTF/CD74/YTHDC2/THOC3/HYAL2/CDC42/MID2/CHMP5/CCNK/ICAM1/HSP90AB1/SMARCB1/CTSG/CHMP4B/VAPA/KPNA3/SLC1A5/TRIM14/EFNB3/HSPA8/CD81/CD86/FN1/HDAC1/ARG1/VAMP8/TARDBP/TRIM25/CD80/CXCR4/NUP153/NECTIN2/APOE/CHMP1A/TRIM5/TRIM22/SFTPD/ARL8B/ITGAV/SLC7A1/FURIN/EPHA2/EGFR/GSN/NCAM1/HMGA2/ITGB1/EEF1A1/CCR5/INHBB/THOC7/PF4/SAP30/MBL2/PSMC3/ANPEP/TRIM68/SLC3A2/CX3CR1/LGALS9/CXCL8/GYPA/CDK1/TRIM8/BCL2L1/PAIP1/BSG/CFL1/DAG1/CHMP6/JUN/CIITA/F2/EXOC7/CSF1R/PRKN/SLC52A2/IFITM1/CARD9/PLSCR1/HMGB1/PPIA/CD55/IGF2R/SRC/ELANE/DPP4/WWP2/CR1/ZBED1/TRIM26/ITGB3/CCL5/CCL5/CCL4/CCL4/SMARCB1/ELANE/CCL4/ITCH | 101 |
| GO:0150076 | neuroinflammatory response | 35/3662 | 69/15509 | 8.92993e-07 | 1.03647e-05 | 6.23317e-06 | TYROBP/IGF1/TNFRSF1B/GRN/PTPRC/MMP9/CTSC/IFNG/IL4/CLU/LRP1/IL1B/NR1D1/SYT11/DAGLA/IL6/APP/ITGB1/IL18/ITGB2/TLR3/ADCY1/CX3CR1/ITGAM/JUN/TRPV1/TNF/TNF/TNF/TNF/TNF/TNF/TNF/TNF/PTPRC | 35 |
| GO:0042771 | intrinsic apoptotic signaling pathway in response to DNA damage by p53 class mediator | 26/3662 | 45/15509 | 8.95562e-07 | 1.03751e-05 | 6.23942e-06 | KDM1A/CD74/CD44/USP28/HIPK2/TP63/TP73/MSH2/BAG6/PYCARD/CDKN1A/DYRK2/BRCA2/ZNF385A/RPL26/SHISA5/DDIT4/TRIAP1/CHEK2/MUC1/BAG6/BAG6/BAG6/BAG6/BAG6/MIF | 26 |
| GO:2000045 | regulation of G1/S transition of mitotic cell cycle | 58/3662 | 137/15509 | 8.97252e-07 | 1.03753e-05 | 6.23953e-06 | KMT2E/FHL1/ARID1B/ACTB/PSME1/CDC6/BCL7C/SMARCB1/APEX1/CASP2/EZH2/SMARCD2/CCL2/CCND1/BCL7A/CCND3/PPP2CA/ID2/ARID1A/PKD2/INHBA/CDKN1A/PSME3/CCNH/APC/RDX/RB1/CUL4A/CYP1A1/CTDSP1/PLK2/EGFR/ADAMTS1/LSM11/APPL1/CUL4B/PRMT2/RPL26/TERT/BRD7/WEE1/RRM1/RFWD3/TRIAP1/RRM2/CTDSP2/CACNB4/PLCB1/CHEK2/CDK10/MUC1/ARID2/KANK2/TFDP1/GIGYF2/PRKDC/SMARCB1/PTEN | 58 |
| GO:0032722 | positive regulation of chemokine production | 36/3662 | 72/15509 | 9.80506e-07 | 1.13169e-05 | 6.80579e-06 | CD74/EIF2AK2/IL4R/MAVS/PYCARD/IL7/IFNG/IL17A/WNT5A/EGR1/IL1B/IL6/TLR4/APP/IL18/IL6R/TLR3/SYK/NOD2/LGALS9/LPL/ADIPOQ/CSF1R/CARD9/HMGB1/TLR7/MBP/TNF/TNF/TNF/TNF/TNF/TNF/TNF/TNF/MIF | 36 |
| GO:0010332 | response to gamma radiation | 29/3662 | 53/15509 | 1.01113e-06 | 1.16487e-05 | 7.00533e-06 | KDM1A/BAK1/HSPA5/RAD51/CYBA/XRCC5/PTPRC/ZMPSTE24/BAX/GATA3/CRYAB/IL1A/EGR1/CDKN1A/ELK1/PRKAA1/MEN1/BRCA2/PARP1/TLK2/RPL26/BCL2L1/LIG4/HRAS/CHEK2/H2AX/TRIM13/PRKDC/PTPRC | 29 |
| GO:0002685 | regulation of leukocyte migration | 84/3662 | 221/15509 | 1.02844e-06 | 1.18186e-05 | 7.10752e-06 | SELE/CD9/CD74/F7/SPI1/RHOA/DNM1L/ICAM1/ABL1/PYCARD/IL27RA/PTN/SERPINE1/CREB3/CXCL12/C1QBP/CCL2/MDK/CD81/NEDD9/IL4/WNT5A/IL1A/CCL20/ITGA4/PADI2/PGF/PTK2B/CCR7/RAC2/MTUS1/IL6/CCN3/CCL21/THBS1/CYP19A1/APP/ABL2/SLIT2/PIK3R1/MSN/VEGFC/CXCL13/MMP14/IL6R/NOD2/FADD/CX3CR1/RHOH/LGALS9/PTK2/PTAFR/CXCL8/CCL19/SELP/CALR/CXCR2/CSF1R/PLCB1/CSF1/CXCR3/ZP3/HMGB1/FUT4/CD47/ELANE/DPP4/TNF/TNF/ZNF580/TNF/TNF/TNF/TNF/TNF/TNF/ITGB3/CCL5/CCL5/CCL4/CCL4/MIF/ELANE/CCL4 | 84 |
| GO:1905477 | positive regulation of protein localization to membrane | 46/3662 | 101/15509 | 1.0297e-06 | 1.18186e-05 | 7.10752e-06 | ITGA3/EPHA3/ATP2B4/GZMB/PDCD5/MAPK8/RANGRF/CD81/IFNG/LRP1/ACSL3/EPHB2/LRP4/NMT1/EPHA2/STAC/PIK3R1/EGFR/ITGB1/RER1/ITGB2/GPER1/CDK5/MFF/ITGAM/KIF5B/PRKCE/HRAS/PDZK1/CDK5R1/MIEF2/CIB1/PRKN/STAC3/CLN3/SLC5A3/TNF/TNF/FIS1/TNF/TNF/TNF/TNF/TNF/TNF/SQSTM1 | 46 |
| GO:0001501 | skeletal system development | 164/3662 | 499/15509 | 1.14674e-06 | 1.31377e-05 | 7.90078e-06 | HOXA11/SCIN/PAFAH1B1/TYROBP/MBTPS2/LTF/IGF1/SNAI2/RUNX3/CD44/BARX2/HEXB/ALX4/PUM2/FGFR2/RHOA/HYAL2/FGFR3/PITX1/NDST1/ATP6AP1/TP63/GLI2/FGFR1/TULP3/HOXA9/PTPRC/HSPB11/ZMPSTE24/MMP2/P2RX7/GLG1/MTHFD1/MMP9/BMP7/RASSF2/SMAD7/PLS3/ACP5/XYLT1/EYA1/SFRP1/SLC39A14/TLE5/LILRB1/TGFB1/HOXA5/SFRP4/TGFBR1/ENG/BMPR1A/HOXB6/RAI1/MAP2K6/NSD2/ZBTB16/MDK/WNT5B/SH2B3/VDR/MAPK14/PEX7/SMAD5/WNT5A/PRRX1/ASH1L/LEPR/P3H1/PRDX1/MTHFD1L/SNX19/SERP1/SOX4/RUNX2/BMP2/THRA/SBDS/KDR/LRRC17/HOXD3/HOXD9/TWSG1/RARA/CHI3L1/LOXL2/NOTCH2/PDGFRA/ADAMTS7/CCN3/TFAP2A/FGF2/FBN2/COL2A1/RB1/HAPLN3/EIF4A3/DYM/EPHA2/CCN1/MEIS1/CSRNP1/PDGFC/ZEB1/SERPINH1/HMGA2/ARID5B/SPEF2/GJA1/BMP6/NODAL/MMP14/KIT/SLC38A10/SKI/ADAMTS4/STC1/RUNX1/ZNF385A/FRZB/TGFBR2/SLC9B2/PITX2/RANBP3L/SHH/TNFRSF11B/RPL13/BMP1/HOXD4/EIF2AK3/RARG/ESRRA/HOXB2/LEP/SMAD2/TYMS/FAM20C/MAF/PTPN11/SETD2/CREB3L2/ANXA2/RFLNB/NOG/NOTUM/PBX1/WNT7B/PAX5/WDR5/COL27A1/SRC/COL13A1/SLC2A10/HOXA4/TGM2/COL11A2/HOXA10/GH1/PTPRC/LOC102724560/LILRB1/LILRB1/LILRB1/PCGF2/LILRB1 | 164 |
| GO:0002885 | positive regulation of hypersensitivity | 11/3662 | 12/15509 | 1.18309e-06 | 1.35291e-05 | 8.13619e-06 | BTK/C3/CCR7/ZP3/HLA-E/HLA-E/HLA-E/HLA-E/HLA-E/HLA-E/HLA-E | 11 |
| GO:0050921 | positive regulation of chemotaxis | 58/3662 | 138/15509 | 1.19491e-06 | 1.36391e-05 | 8.20231e-06 | CD74/CASR/F7/SPI1/FGFR1/DNM1L/PDGFB/PRKD2/TGFB1/PTN/MET/HSPB1/SERPINE1/CREB3/CXCL12/C1QBP/MDK/NEDD9/SMOC2/IL4/PDGFRB/WNT5A/PGF/PTK2B/CXCR4/CCR7/KDR/RAC2/IL6/CCL21/THBS1/FGF2/SLIT2/TPBG/VEGFC/CXCL13/IL6R/CX3CR1/LGALS9/PTK2/CXCL8/S1PR1/SCG2/IL16/CCL19/CALR/CXCR2/CSF1R/CCR4/CSF1/HMGB1/TMSB4X/ZNF580/CCL5/CCL5/CCL4/CCL4/CCL4 | 58 |
| GO:0043367 | CD4-positive, alpha-beta T cell differentiation | 39/3662 | 81/15509 | 1.2048e-06 | 1.37267e-05 | 8.25502e-06 | TMEM98/RUNX3/FOXP3/CBFB/TBX21/IL4R/IL12RB1/SMAD7/JAK3/GATA3/IFNG/IL12B/IL4/BCL6/CD86/MYB/CD80/RARA/IL6/HLX/IRF4/IL21/ARMC5/IL2RG/IL18/RUNX1/IL6R/LGALS9/CCL19/KLHL25/SOCS1/HMGB1/ENTPD7/MTOR/HLA-DRA/HLA-DRA/HLA-DRA/HLA-DRA/HLA-DRA | 39 |
| GO:2000146 | negative regulation of cell motility | 104/3662 | 289/15509 | 1.22075e-06 | 1.3883e-05 | 8.34899e-06 | NISCH/DCN/CD74/CDH1/ARID4B/ATP2B4/PTPRU/NGFR/TIE1/SP100/RHOA/NAV3/HYAL2/FBLN1/APOH/ANGPT2/APEX1/SMAD7/RBBP7/NDRG4/SFRP1/IL27RA/TGFB1/HAS1/SERPINE1/ENG/GATA3/CXCL12/BMPR1A/CCL2/CORO1C/NEDD9/PPARD/IL4/HDAC1/GADD45A/PADI2/FOXO3/GNA13/RECK/LRP1/SEMG1/RRAS/PIN1/APOE/NKX2-1/CCN3/CCL21/THBS1/CYP19A1/CYP1B1/TET1/FGF2/DUSP10/RHOB/SLIT2/GNA12/IGFBP3/OGT/NOTCH1/GJA1/RNF20/CXCL13/NODAL/STC1/ADIPOR1/RBBP4/WNT4/IL24/SAP30/SHH/TP53INP1/CX3CR1/DAG1/SVBP/CALR/MAPK15/ADIPOQ/ADGRB1/PLCB1/NOG/IFITM1/NF2/MAGI2/ARID2/HMGB1/SPOCK3/SRGAP3/DPP4/CSNK2B/TNF/TNF/TNF/CSNK2B/CSNK2B/TNF/TNF/CSNK2B/TNF/TNF/TNF/CSNK2B/MIF/PTEN | 104 |
| GO:0006986 | response to unfolded protein | 57/3662 | 135/15509 | 1.23261e-06 | 1.39922e-05 | 8.41467e-06 | MBTPS2/UFL1/BAK1/HSPA5/HERPUD1/EIF2AK2/DERL2/TMED2/PPP1R15A/BAX/HSP90AB1/XBP1/BFAR/HSPB1/CREB3/TMEM33/HSPA8/CCND1/PACRG/HSPA9/HSPE1/MFN2/SERP1/TMTC4/HSPA2/CHAC1/ABCB10/DERL1/THBS1/TMBIM6/MANF/PIK3R1/SERPINH1/BAG3/HSPB8/BCL2L11/PPP1R15B/ATF3/CREBRF/VCP/EIF2AK3/DDIT3/PTPN2/ERN1/YOD1/CREB3L2/PRKN/HSPA1L/DAXX/DAXX/HSPA1L/HSPA1L/DAXX/DAXX/DAXX/HSPA1L/HSPA1L | 57 |
| GO:0031100 | animal organ regeneration | 34/3662 | 67/15509 | 1.25894e-06 | 1.42389e-05 | 8.563e-06 | HGF/BAK1/F7/PTPRU/CSNK2A2/ANGPT2/PRPS2/GATA1/HAMP/EZH2/CXCL12/CCND1/NR4A3/PGF/FLT3/LCP1/IL6/IL10/CCNA2/NOTCH1/TGFBR2/NNMT/CDK1/CEBPB/TYMS/IGF2R/TNF/TNF/TNF/TNF/TNF/TNF/TNF/TNF | 34 |
| GO:0042531 | positive regulation of tyrosine phosphorylation of STAT protein | 34/3662 | 67/15509 | 1.25894e-06 | 1.42389e-05 | 8.563e-06 | IGF1/FGFR3/PIBF1/OSM/CD40/HPX/IFNG/IL12B/IL4/HES1/FLT3/LIF/EPO/IL6/IL21/IL18/KIT/IL6R/IL24/IL3/CSF2/LEP/CSF1R/TNF/TNF/TNF/TNF/TNF/TNF/TNF/TNF/GH1/CCL5/CCL5 | 34 |
| GO:0010921 | regulation of phosphatase activity | 40/3662 | 84/15509 | 1.26431e-06 | 1.42736e-05 | 8.58387e-06 | ROCK1/PTPRC/GSK3B/PPP1R15A/FKBP1A/HSP90AB1/PPP6R2/URI1/CD33/IFNG/PDGFRB/PTPA/MASTL/CRY2/BMP2/STYXL1/CALM2/BOD1/GNA12/PPP1R15B/CALM3/CHP2/PPP1R2/MAGI2/MTOR/CSNK2B/TNF/PPP1R11/TNF/TNF/CSNK2B/CSNK2B/TNF/TNF/CSNK2B/TNF/TNF/TNF/CSNK2B/PTPRC | 40 |
| GO:0040013 | negative regulation of locomotion | 114/3662 | 324/15509 | 1.38464e-06 | 1.56036e-05 | 9.38374e-06 | NISCH/DCN/CD74/CDH1/ARID4B/ATP2B4/PTPRU/NGFR/TIE1/SP100/RHOA/NAV3/HYAL2/ST6GAL1/FBLN1/APOH/ANGPT2/APEX1/SMAD7/RBBP7/NDRG4/SFRP1/IL27RA/TGFB1/HAS1/SERPINE1/ENG/GATA3/CXCL12/BMPR1A/WNT3/CCL2/CORO1C/NEDD9/PPARD/IL4/WNT5A/HDAC1/GADD45A/PADI2/FOXO3/GNA13/RECK/LRP1/SEMG1/RRAS/PIN1/APOE/NKX2-1/CCN3/CCL21/THBS1/CYP19A1/CYP1B1/TET1/FGF2/DUSP10/RHOB/SLIT2/GNA12/IGFBP3/OGT/NOTCH1/GJA1/RNF20/CXCL13/NODAL/STC1/ADIPOR1/RBBP4/WNT4/IL24/SAP30/SHH/TP53INP1/CX3CR1/SEMA4C/SEMA3E/DAG1/PTPN2/SVBP/CALR/MAPK15/ADIPOQ/ADGRB1/PLCB1/NOG/IFITM1/NF2/MAGI2/ARID2/HMGB1/SPOCK3/SRGAP3/ELANE/DPP4/CSNK2B/TNF/TNF/TNF/CSNK2B/CSNK2B/TNF/TNF/CSNK2B/TNF/TNF/TNF/CSNK2B/MIF/ELANE/WNT3/WNT3/PTEN | 114 |
| GO:1900180 | regulation of protein localization to nucleus | 52/3662 | 120/15509 | 1.39039e-06 | 1.56401e-05 | 9.40565e-06 | TMEM98/CDH1/NGFR/IPO5/HYAL2/SIRT6/GSK3B/MAVS/HSP90AB1/FERMT1/TGFB1/ZPR1/IFNG/MAPK14/PARK7/TARDBP/PIN1/LIF/SESN2/DKC1/CD36/MDFIC/CCT7/GLUL/TRIM29/PARP1/PIK3R1/BAG3/LMNA/PRKCD/TERT/SHH/CCT2/CHP2/PKIG/NMD3/CDK1/TRIM8/ORMDL3/EIF2AK3/LEP/LARP7/F2/NPM1/CACNB4/SUMO3/NF2/LILRB4/SRC/LILRB4/LILRB4/LILRB4 | 52 |
| GO:2000630 | positive regulation of miRNA metabolic process | 31/3662 | 59/15509 | 1.39944e-06 | 1.57133e-05 | 9.44969e-06 | NGFR/SPI1/PDGFB/TGFB1/GATA3/BMPR1A/MYB/FOXO3/EGR1/BMP2/IL10/SMAD6/FGF2/SMAD4/TERT/FOS/RELA/HRAS/FOSL1/JUN/TEAD1/MRTFA/TNF/TNF/TNF/TNF/TNF/TNF/TNF/TNF/GAS5 | 31 |
| GO:0032616 | interleukin-13 production | 16/3662 | 22/15509 | 1.51864e-06 | 1.6929e-05 | 1.01808e-05 | ARG2/GATA3/IL4/RARA/IRF4/TNFRSF21/IL18/LGALS9/IL1RAP/HLA-E/HLA-E/HLA-E/HLA-E/HLA-E/HLA-E/HLA-E | 16 |
| GO:0032656 | regulation of interleukin-13 production | 16/3662 | 22/15509 | 1.51864e-06 | 1.6929e-05 | 1.01808e-05 | ARG2/GATA3/IL4/RARA/IRF4/TNFRSF21/IL18/LGALS9/IL1RAP/HLA-E/HLA-E/HLA-E/HLA-E/HLA-E/HLA-E/HLA-E | 16 |
| GO:0032695 | negative regulation of interleukin-12 production | 16/3662 | 22/15509 | 1.51864e-06 | 1.6929e-05 | 1.01808e-05 | PIBF1/TLR8/ACP5/MEFV/LILRB1/JAK3/C1QBP/CCR7/IL10/THBS1/ARRB2/NOD2/LILRB1/LILRB1/LILRB1/LILRB1 | 16 |
| GO:0051044 | positive regulation of membrane protein ectodomain proteolysis | 16/3662 | 22/15509 | 1.51864e-06 | 1.6929e-05 | 1.01808e-05 | TNFRSF1B/SH3D19/IFNG/IL1B/APOE/FURIN/ADAM9/RGMA/TNF/TNF/TNF/TNF/TNF/TNF/TNF/TNF | 16 |
| GO:0033619 | membrane protein proteolysis | 32/3662 | 62/15509 | 1.59096e-06 | 1.77034e-05 | 1.06465e-05 | MBTPS2/TNFRSF1B/ROCK1/P2RX7/MYH9/TGFB1/SH3D19/IFNG/IL1B/APOE/ADAM19/IL10/MMP7/FURIN/PSEN2/RBMX/SPPL3/ADAM9/DAG1/RGMA/TMPRSS6/PRTN3/TNF/PSENEN/TNF/TNF/TNF/TNF/TNF/TNF/TNF/PRTN3 | 32 |
| GO:0060251 | regulation of glial cell proliferation | 26/3662 | 46/15509 | 1.59773e-06 | 1.77468e-05 | 1.06726e-05 | UFL1/NTN1/HES1/IL1B/KRAS/IL6/RB1/NOTCH1/VEGFC/SKI/SHH/PLAG1/NF2/TNF/TNF/LTA/TNF/LTA/TNF/TNF/TNF/TNF/LTA/LTA/TNF/LTA | 26 |
| GO:2000628 | regulation of miRNA metabolic process | 37/3662 | 76/15509 | 1.60169e-06 | 1.7759e-05 | 1.068e-05 | NGFR/SPI1/PDGFB/TGFB1/GATA3/BMPR1A/PPARD/MYB/FOXO3/EGR1/BMP2/RARA/IL10/SMAD6/FGF2/SMAD4/TERT/FOS/RELA/HRAS/FOSL1/JUN/LILRB4/TEAD1/MRTFA/TNF/TNF/TNF/TNF/TNF/TNF/TNF/TNF/GAS5/LILRB4/LILRB4/LILRB4 | 37 |
| GO:0002866 | positive regulation of acute inflammatory response to antigenic stimulus | 12/3662 | 14/15509 | 1.65169e-06 | 1.8151e-05 | 1.09157e-05 | BTK/PARK7/C3/CCR7/ZP3/HLA-E/HLA-E/HLA-E/HLA-E/HLA-E/HLA-E/HLA-E | 12 |
| GO:0048291 | isotype switching to IgG isotypes | 12/3662 | 14/15509 | 1.65169e-06 | 1.8151e-05 | 1.09157e-05 | FOXP3/TBX21/MLH1/PTPRC/MSH2/CD40/IL27RA/IL4/NDFIP1/SLC15A4/CD28/PTPRC | 12 |
| GO:0060556 | regulation of vitamin D biosynthetic process | 12/3662 | 14/15509 | 1.65169e-06 | 1.8151e-05 | 1.09157e-05 | SNAI2/CYP27B1/IFNG/GFI1/TNF/TNF/TNF/TNF/TNF/TNF/TNF/TNF | 12 |
| GO:0071316 | cellular response to nicotine | 12/3662 | 14/15509 | 1.65169e-06 | 1.8151e-05 | 1.09157e-05 | BAD/RELA/NTRK1/TNF/TNF/TNF/TNF/TNF/TNF/TNF/TNF/B2M | 12 |
| GO:0097527 | necroptotic signaling pathway | 12/3662 | 14/15509 | 1.65169e-06 | 1.8151e-05 | 1.09157e-05 | FAS/FASLG/TLR3/FADD/TNF/TNF/TNF/TNF/TNF/TNF/TNF/TNF | 12 |
| GO:0070316 | regulation of G0 to G1 transition | 22/3662 | 36/15509 | 1.67959e-06 | 1.84249e-05 | 1.10804e-05 | ARID1B/ACTB/BCL7C/SMARCB1/SMARCD2/BCL7A/ARID1A/SOX15/BRD7/RRM1/RHNO1/FOXO4/ARID2/HLA-G/HLA-G/HLA-G/HLA-G/HLA-G/HLA-G/HLA-G/SMARCB1/HLA-G | 22 |
| GO:0002468 | dendritic cell antigen processing and presentation | 15/3662 | 20/15509 | 1.72931e-06 | 1.89035e-05 | 1.13682e-05 | SLC11A1/CD74/FCGR2B/NOD1/CCR7/CD68/CCL21/THBS1/NOD2/CCL19/HLA-DRA/HLA-DRA/HLA-DRA/HLA-DRA/HLA-DRA | 15 |
| GO:0002666 | positive regulation of T cell tolerance induction | 15/3662 | 20/15509 | 1.72931e-06 | 1.89035e-05 | 1.13682e-05 | FOXP3/TGFBR2/LILRB4/HLA-G/HLA-G/HLA-G/HLA-G/HLA-G/HLA-G/HLA-G/LILRB4/HLA-G/LILRB4/LILRB4/ITCH | 15 |
| GO:0070555 | response to interleukin-1 | 53/3662 | 124/15509 | 1.84042e-06 | 2.00826e-05 | 1.20773e-05 | CD38/UPF1/SELE/YTHDC2/CYBA/HYAL2/MMP2/CD40/CCL22/CCL17/PYCARD/SFRP1/TLE5/CCL2/IL17A/HES1/CCL20/EGR1/IL1B/NR1D1/EPO/AKAP12/CHI3L1/IL6/ADAMTS7/TANK/IL1RN/CCL21/TNFRSF11A/APP/RBMX/PRKCA/INHBB/TNIP2/LGALS9/CXCL8/FGG/CCL11/CEBPB/CCL19/RELA/PLCB1/IRAK1/CD47/SRC/CCL5/CCL5/CCL4/CCL18/CCL4/CCL4/CCL18/CCL18 | 53 |
| GO:0061043 | regulation of vascular wound healing | 13/3662 | 16/15509 | 1.8659e-06 | 2.03044e-05 | 1.22107e-05 | XBP1/SERPINE1/SMOC2/TNFAIP3/CXCR4/TNF/TNF/TNF/TNF/TNF/TNF/TNF/TNF | 13 |
| GO:0032736 | positive regulation of interleukin-13 production | 14/3662 | 18/15509 | 1.8673e-06 | 2.03044e-05 | 1.22107e-05 | GATA3/IL4/RARA/IRF4/IL18/LGALS9/IL1RAP/HLA-E/HLA-E/HLA-E/HLA-E/HLA-E/HLA-E/HLA-E | 14 |
| GO:2001235 | positive regulation of apoptotic signaling pathway | 52/3662 | 121/15509 | 1.88334e-06 | 2.04301e-05 | 1.22863e-05 | BAD/NOX1/FAS/NGFR/HYAL2/TP63/PTPRC/BAX/DNM1L/SRPX/PYCARD/SFRP1/GSDME/CASP2/TGFBR1/SEPTIN4/CTSC/PARK7/TNFSF10/INHBA/EEF1E1/RBCK1/PLAGL2/BECN1/STYXL1/SERINC3/ITM2C/THBS1/PMAIP1/SOD1/BCL2L11/RPL26/PEA15/ATF3/INHBB/PRKCD/GPER1/FADD/DDIT3/PTPN2/PAK2/TNF/TNF/FIS1/TNF/TNF/TNF/TNF/TNF/TNF/PTPRC/PTEN | 52 |
| GO:1905475 | regulation of protein localization to membrane | 66/3662 | 165/15509 | 1.88545e-06 | 2.04301e-05 | 1.22863e-05 | ITGA3/EPHA3/ATP2B4/PICALM/ACTB/GPC4/HECTD1/GZMB/CSK/PDCD5/TGFB1/MAPK8/RANGRF/CD81/IFNG/TMEM59/VAMP8/LRP1/ACSL3/PPFIA1/EPHB2/LRP4/NMT1/EPHA2/STAC/PIK3R1/EGFR/GSN/ITGB1/MMP14/APPL1/RER1/LDLRAP1/DMTN/ITGB2/AP2M1/GPER1/CDK5/MFF/ITGAM/CDH2/KIF5B/PRKCE/BCL2L1/DAG1/HRAS/PDZK1/CDK5R1/MIEF2/CIB1/PRKN/STAC3/CLN3/FZD9/SLC5A3/GDI1/TNF/TNF/FIS1/TNF/TNF/TNF/TNF/TNF/TNF/SQSTM1 | 66 |
| GO:0009895 | negative regulation of catabolic process | 103/3662 | 288/15509 | 1.89902e-06 | 2.05412e-05 | 1.23531e-05 | SLC4A1/HFE/SLC11A1/HGF/CLEC16A/PHF23/ATP2B4/HIPK2/CTSA/ELAVL1/KDM4A/ROCK1/SIRT2/VPS35/CSNK2A2/SIRT6/FUS/HNRNPC/BAG6/HSP90AB1/CIRBP/CHMP4B/USP14/N4BP1/TSC2/SNRNP70/SGTA/GSK3A/PIK3CG/MET/TRDMT1/LARP4B/EIF4G2/MAPK14/PDCL3/PARK7/LEPR/SLIRP/NRDE2/TARDBP/USP9X/IL1B/BECN1/PIN1/ZFP36/MGAT3/CBFA2T3/DKC1/PRKAA1/TBC1D14/PTPN22/SERPINE2/IL10/SORL1/FURIN/TOB1/SMAD4/EGFR/TLK2/OGT/SNX12/EIF3H/ALAD/USP25/TAB3/MAPKAPK2/RYBP/SHH/GOLGA2/DDIT4/ALK/PAIP1/RELA/ANGEL2/LEP/TMEM39A/WDR6/NQO1/ADGRB1/ANXA2/RBM10/USP7/SECISBP2/SVIP/MTOR/RNF5/BAG6/TNF/TNF/MAGEA3/TNF/TNF/BAG6/TNF/TNF/BAG6/TNF/TNF/BAG6/BAG6/HP/TAF15/F8A1 | 103 |
| GO:0050920 | regulation of chemotaxis | 81/3662 | 214/15509 | 1.92958e-06 | 2.08354e-05 | 1.25301e-05 | CD74/CASR/F7/SPI1/ST6GAL1/FGFR1/DNM1L/ANGPT2/PDGFB/USP14/PRKD2/TGFB1/PTN/MET/HSPB1/SERPINE1/CREB3/CXCL12/WNT3/C1QBP/CCL2/MDK/NEDD9/SMOC2/IL4/PDGFRB/WNT5A/PADI2/PGF/PTK2B/CXCR4/CCR7/KDR/RAC2/MTUS1/PDGFRA/IL6/CCN3/CCL21/TUBB2B/THBS1/CYP19A1/FGF2/SLIT2/TPBG/NOTCH1/VEGFC/POU4F2/CXCL13/IL6R/NOD2/CX3CR1/SEMA4C/LGALS9/PTK2/CXCL8/SEMA3E/S1PR1/SCG2/IL16/CCL19/PTPN2/CALR/CXCR2/CSF1R/CCR4/CSF1/HMGB1/ELANE/DPP4/TMSB4X/ZNF580/CCL5/CCL5/CCL4/CCL4/MIF/ELANE/WNT3/WNT3/CCL4 | 81 |
| GO:0001776 | leukocyte homeostasis | 42/3662 | 91/15509 | 1.95061e-06 | 2.0953e-05 | 1.26008e-05 | BTK/CD74/FAS/BAK1/TNFRSF17/FOXP3/BAX/P2RX7/ABL1/MTHFD1/JAK3/PPP3CB/SH2B3/MPL/TNFAIP3/GPAM/FLT3/PKN1/IL2RA/IL6/SLC15A4/PMAIP1/BCL2L11/MERTK/TSC22D3/XKR8/SPTA1/BAP1/CASP3/RAG1/LMO1/PRDX2/FADD/LGALS9/STAT5B/CXCR2/F2R/CSF1/PDE4B/HMGB1/TNFRSF13B/MIF | 42 |
| GO:1990868 | response to chemokine | 42/3662 | 91/15509 | 1.95061e-06 | 2.0953e-05 | 1.26008e-05 | RHOA/CCL22/CCL17/CXCL12/CCL2/SH2B3/CCL20/PADI2/MPL/GPR75/PTK2B/CXCR4/RNF113A/CCR7/CCL21/SLIT2/CXCL13/CXCR5/CCR5/RBM15/CXCR1/PF4/WBP1L/CX3CR1/CXCL8/CCL11/CCL19/CCR9/CXCR2/CCR4/SLIT3/CIB1/CXCR3/ACKR1/CCL5/CCL5/CCL4/CCL18/CCL4/CCL4/CCL18/CCL18 | 42 |
| GO:1990869 | cellular response to chemokine | 42/3662 | 91/15509 | 1.95061e-06 | 2.0953e-05 | 1.26008e-05 | RHOA/CCL22/CCL17/CXCL12/CCL2/SH2B3/CCL20/PADI2/MPL/GPR75/PTK2B/CXCR4/RNF113A/CCR7/CCL21/SLIT2/CXCL13/CXCR5/CCR5/RBM15/CXCR1/PF4/WBP1L/CX3CR1/CXCL8/CCL11/CCL19/CCR9/CXCR2/CCR4/SLIT3/CIB1/CXCR3/ACKR1/CCL5/CCL5/CCL4/CCL18/CCL4/CCL4/CCL18/CCL18 | 42 |
| GO:0050435 | amyloid-beta metabolic process | 30/3662 | 57/15509 | 1.9706e-06 | 2.11311e-05 | 1.27079e-05 | IGF1/ROCK1/PICALM/GSK3A/IFNG/CLU/BECN1/PIN1/MGAT3/APOE/RTN3/SORL1/RTN1/PSEN2/REN/NTRK2/SLC2A13/CASP3/EFNA1/RELA/MME/TNF/PSENEN/TNF/TNF/TNF/TNF/TNF/TNF/TNF | 30 |
| GO:0006413 | translational initiation | 49/3662 | 112/15509 | 1.98333e-06 | 2.11578e-05 | 1.27239e-05 | DHX33/EIF2AK2/EIF4B/DDX1/BZW1/TMED2/PPP1R15A/EIF3J/HSPB1/EIF3B/EIF4H/EIF3A/RPS6KB1/EIF4G2/EIF1B/EIF2B2/PAIP2/EIF2S2/EIF4E2/BZW2/NCBP1/POLR2D/EIF3H/EIF4EBP2/EIF3M/CDC123/EIF4A2/PPP1R15B/EIF4A1/EIF2AK3/PAIP1/EIF1/NPM1/RPS17/KLHL25/EIF3C/YTHDF3/MTOR/TNF/TNF/TNF/TNF/TNF/TNF/TNF/TNF/EIF6/CCL5/CCL5 | 49 |
| GO:0018210 | peptidyl-threonine modification | 49/3662 | 112/15509 | 1.98333e-06 | 2.11578e-05 | 1.27239e-05 | DYRK4/CLK1/HIPK2/ROCK1/SIRT2/CSNK2A2/PRKACA/MARK2/UBE2K/GSK3B/BMP7/SMAD7/AXIN1/PRKD2/TGFB1/GSK3A/TGFBR1/MAPK8/WNT5A/GALNT3/DYRK2/CHI3L1/SPRY2/EGF/MAP3K12/APP/DYRK3/CALM2/PARD3/PRKCA/DMTN/CALM3/TGFBR2/PRKCD/CDK5/DDIT4/CDK1/CDK5R1/GALNT11/CDK10/SPRED2/MTOR/CSNK2B/CSNK2B/CSNK2B/CSNK2B/CSNK2B/PRKDC/PRKACA | 49 |
| GO:0032355 | response to estradiol | 49/3662 | 112/15509 | 1.98333e-06 | 2.11578e-05 | 1.27239e-05 | BAD/CD38/F7/MBD3/APOB/MMP2/ESR1/BMP7/SFRP1/GPI/TGFB1/EZH2/AREG/CRYAB/CCND1/PDGFRB/IGFBP2/DNMT3A/CAT/ALDH1A2/BCL2L2/ARPC1B/ASS1/RARA/IL10/STXBP1/CYP19A1/CYP1B1/IGF1R/CCNA2/EGFR/POU4F2/POU4F1/BCL2L11/CASP3/GPER1/GPX4/KAT5/ESRRA/STAT5B/LEP/CALR/SSTR2/OXTR/NQO1/ZNF703/GH1/TXNIP/GPI | 49 |
| GO:2000181 | negative regulation of blood vessel morphogenesis | 47/3662 | 106/15509 | 2.01848e-06 | 2.14958e-05 | 1.29272e-05 | E2F2/DCN/SARS1/ATP2B4/EPN1/TIE1/ROCK1/APOH/ANGPT2/AGO1/HOXA5/SERPINE1/STAT1/GADD45A/CD160/FASLG/TEK/SPRY2/THBS1/EPHA2/PLK2/HHEX/ADAMTS1/WNT4/PF4/SEMA3E/ADGRB1/FOXO4/HGS/THBS2/TNF/HLA-G/TNF/HLA-G/TNF/TNF/TNF/TNF/TNF/HLA-G/TNF/HLA-G/HLA-G/HLA-G/HLA-G/YJEFN3/HLA-G | 47 |
| GO:0010638 | positive regulation of organelle organization | 149/3662 | 450/15509 | 2.20025e-06 | 2.33914e-05 | 1.40672e-05 | BAD/CDC27/SCIN/DCN/IGF1/SPAST/ZDHHC6/BAK1/GRN/IFT88/RHOA/NAV3/SIRT2/VPS35/CDC42/WDR1/LMAN1/ARHGEF10L/SPAG5/SIRT6/ACTN2/XRCC5/GSK3B/ATRX/BAX/DNM1L/MAPKAPK5/P2RX7/ANAPC5/PXN/ABL1/SH3GLB1/PDGFB/KCTD17/GZMB/MMP9/HCK/PYCARD/NBN/SFRP1/ARHGEF10/PDCD5/GSK3A/MET/TGFBR1/MAPK8/PPIF/CSF3/RAD50/IL5/MACROH2A1/PDGFRB/SMC4/WNT5A/SNX4/INO80D/IL1A/SDC1/PARK7/ELAPOR1/SLF2/TEK/PTK2B/TNFSF10/CNOT1/IL1B/DSTN/ID1/CCR7/BECN1/KDR/CDC42EP1/POT1/DNMT1/DKC1/WASF3/KATNBL1/PSRC1/PPHLN1/HRK/HNRNPA1/CCT7/LCP1/NMT1/CCL21/NUMA1/NUSAP1/ABI2/EGF/NABP2/RB1/SLAIN1/BBS4/PMAIP1/MSN/GSN/CDC42EP2/BCL2L11/ARHGAP35/ALOX15/TAL1/WNT4/CDC42EP3/FYCO1/RICTOR/CSF2/GPER1/CDK5/CCT2/ATMIN/MFF/ADRB2/PDCD6IP/PRKCE/CCL11/KAT5/LIG4/HRAS/CEP135/CDK5R1/MIEF2/GRB2/CD28/AURKB/MAPK15/PLCB1/ANXA2/PRKN/DRG1/NF2/CD47/SRC/MTOR/TNF/TNF/FIS1/TNF/TNF/TNF/TNF/TNF/TNF/PDXP/PGAM5/BRK1/RTEL1/PIP4K2B/SEPTIN9/TINF2 | 149 |
| GO:0030225 | macrophage differentiation | 25/3662 | 44/15509 | 2.22246e-06 | 2.35467e-05 | 1.41605e-05 | CD4/SPI1/CDC42/CEBPE/MMP9/TGFB1/IFNG/ID2/INHBA/LIF/TSPAN2/RB1/APP/PARP1/PRKCA/PF4/CSF2/FADD/PTPN2/ADIPOQ/CSF1R/CSF1/SOCS1/L3MBTL3/CEBPA | 25 |
| GO:0090199 | regulation of release of cytochrome c from mitochondria | 25/3662 | 44/15509 | 2.22246e-06 | 2.35467e-05 | 1.41605e-05 | BAD/IGF1/HGF/BAK1/BAX/DNM1L/MMP9/PYCARD/PDCD5/PPIF/CLU/TNFSF10/BCL2L2/HRK/ARRB2/PMAIP1/BCL2L11/LMNA/GPER1/FXN/MFF/PRELID1/TRIAP1/BCL2L1/PRKN | 25 |
| GO:0031056 | regulation of histone modification | 62/3662 | 153/15509 | 2.29463e-06 | 2.42698e-05 | 1.45954e-05 | NFYA/KDM1A/KMT2E/PAF1/AASS/BAZ1B/SNAI2/FOXP3/HPF1/KDM4A/NFYC/SPI1/ZMPSTE24/ATRX/DNMT3B/SMARCB1/PRKD2/GATA3/MAPK8/ZNF451/MACROH2A1/BCL6/SF3B1/KDM3A/PARK7/DR1/MYB/PHF19/DEK/LIF/PRDM12/DNMT1/MYBBP1A/WBP2/TET1/SKIC8/SMAD4/NCAPG2/OGT/NSD3/KAT14/MBIP/SMARCA5/RNF20/SKI/CTBP1/LMNA/GFI1/PYGO2/NSD1/BRD7/NNMT/SETD5/TADA3/HCFC1/TAF7/MUC1/NOC2L/PAX5/WDR5/SMARCB1/TADA2A | 62 |
| GO:0045622 | regulation of T-helper cell differentiation | 23/3662 | 39/15509 | 2.34548e-06 | 2.47233e-05 | 1.48682e-05 | FOXP3/TBX21/IL4R/IL12RB1/SMAD7/JAK3/GATA3/IL12B/IL4/BCL6/CD86/MYB/CD80/RARA/HLX/IRF4/IL18/CCL19/HLA-DRA/HLA-DRA/HLA-DRA/HLA-DRA/HLA-DRA | 23 |
| GO:0050901 | leukocyte tethering or rolling | 23/3662 | 39/15509 | 2.34548e-06 | 2.47233e-05 | 1.48682e-05 | SELE/ROCK1/ADD2/CXCL12/ITGA4/CCL21/ITGB1/VCAM1/CX3CR1/PTAFR/SELP/LEP/FUT4/ELANE/TNF/TNF/TNF/TNF/TNF/TNF/TNF/TNF/ELANE | 23 |
| GO:0001836 | release of cytochrome c from mitochondria | 28/3662 | 52/15509 | 2.37845e-06 | 2.49858e-05 | 1.5026e-05 | BAD/GGCT/IGF1/HGF/BAK1/BAX/DNM1L/MMP9/PYCARD/PDCD5/PPIF/CLU/TNFSF10/BCL2L2/HRK/ARRB2/PMAIP1/BCL2L11/LMNA/GPER1/FXN/MFF/PRELID1/TRIAP1/BCL2L1/PRKN/FZD9/FIS1 | 28 |
| GO:0032768 | regulation of monooxygenase activity | 28/3662 | 52/15509 | 2.37845e-06 | 2.49858e-05 | 1.5026e-05 | ATP2B4/CDH3/FCER2/NOD1/CYP27B1/VDR/IFNG/IL1A/PARK7/PTK2B/IL1B/APOE/EGFR/DDAH1/CALM3/GFI1/TERT/LEP/ZDHHC21/CNR2/TNF/TNF/TNF/TNF/TNF/TNF/TNF/TNF | 28 |
| GO:0032984 | protein-containing complex disassembly | 81/3662 | 215/15509 | 2.3879e-06 | 2.50426e-05 | 1.50602e-05 | UPF1/SCIN/SPAST/CLEC16A/PHF23/VMP1/NAV3/TBC1D25/SPTB/WDR1/NSF/ADD2/ACTN2/GSK3B/ZMPSTE24/CHMP5/ADD1/TPX2/SUPT16H/SNAP29/SMARCB1/TFIP11/CHMP4B/MTPN/SMARCD2/HSPA8/CAPZA1/STMN1/ARID1A/VAMP8/MTRF1/DSTN/BECN1/ATG14/CHMP1A/APC/SNX14/MICAL1/HMGA1/RDX/IGF1R/SH3GL1/KIF2C/DYRK3/SNAPIN/GSN/SSRP1/PLEKHH2/SCAF4/DMTN/SPTBN4/SPTA1/FYCO1/VCP/DDIT4/ADRB2/KIF5B/CFL1/SPTBN2/ATP2A2/CHMP6/TMEM39A/FLII/H2AC25/CIB1/CLN3/ARID2/SPTAN1/IQANK1/TNF/TNF/TNF/TNF/TNF/TNF/TNF/TNF/PDXP/TWF2/LIX1L/SMARCB1 | 81 |
| GO:0032693 | negative regulation of interleukin-10 production | 18/3662 | 27/15509 | 2.46301e-06 | 2.57868e-05 | 1.55077e-05 | BTK/TYROBP/FOXP3/FCGR2B/LILRB1/JAK3/IL12B/TNFRSF21/PRG2/LILRB4/PDCD1LG2/LILRB1/LILRB4/LILRB1/LILRB1/LILRB1/LILRB4/LILRB4 | 18 |
| GO:0061515 | myeloid cell development | 38/3662 | 80/15509 | 2.49835e-06 | 2.59126e-05 | 1.55834e-05 | SLC4A1/PAFAH1B1/TYROBP/LTF/ALAS1/ATP6AP1/GATA1/ERCC2/LILRB1/SLC11A2/SH2B3/RHAG/BCL6/MYB/PTBP3/EPO/TSPAN2/NOTCH2/ABCB10/APP/MEIS1/KIT/ALAS2/DMTN/ZNF385A/BAP1/SLC9B2/EPB42/CEBPB/FAM20C/PTPN11/ANXA2/SRC/L3MBTL3/LILRB1/LILRB1/LILRB1/LILRB1 | 38 |
| GO:0002294 | CD4-positive, alpha-beta T cell differentiation involved in immune response | 32/3662 | 63/15509 | 2.5043e-06 | 2.59126e-05 | 1.55834e-05 | TMEM98/FOXP3/TBX21/IL4R/IL12RB1/SMAD7/JAK3/GATA3/IFNG/IL12B/IL4/BCL6/CD86/MYB/CD80/RARA/IL6/HLX/IRF4/IL21/IL18/IL6R/LGALS9/CCL19/HMGB1/ENTPD7/MTOR/HLA-DRA/HLA-DRA/HLA-DRA/HLA-DRA/HLA-DRA | 32 |
| GO:0032613 | interleukin-10 production | 32/3662 | 63/15509 | 2.5043e-06 | 2.59126e-05 | 1.55834e-05 | BTK/TYROBP/HGF/FOXP3/FCGR2B/PIBF1/CD40LG/PYCARD/LILRB1/JAK3/IL12B/IL4/IL6/TLR4/IRF4/TNFRSF21/SYK/NOD2/LGALS9/CD28/PRG2/LILRB4/HMGB1/CD47/PDCD1LG2/LILRB1/LILRB4/LILRB1/LILRB1/LILRB1/LILRB4/LILRB4 | 32 |
| GO:0032623 | interleukin-2 production | 32/3662 | 63/15509 | 2.5043e-06 | 2.59126e-05 | 1.55834e-05 | CD4/FOXP3/NAV3/TBX21/PTPRC/ABL1/PRKD2/GATA3/PDE4D/CD86/IL1A/TNFAIP3/CD80/IL1B/ZFP36/SFTPD/IRF4/RUNX1/NOD2/KAT5/STAT5B/GLMN/CD28/PDE4B/LILRB4/CARD9/PNP/CR1/PTPRC/LILRB4/LILRB4/LILRB4 | 32 |
| GO:0032653 | regulation of interleukin-10 production | 32/3662 | 63/15509 | 2.5043e-06 | 2.59126e-05 | 1.55834e-05 | BTK/TYROBP/HGF/FOXP3/FCGR2B/PIBF1/CD40LG/PYCARD/LILRB1/JAK3/IL12B/IL4/IL6/TLR4/IRF4/TNFRSF21/SYK/NOD2/LGALS9/CD28/PRG2/LILRB4/HMGB1/CD47/PDCD1LG2/LILRB1/LILRB4/LILRB1/LILRB1/LILRB1/LILRB4/LILRB4 | 32 |
| GO:0032663 | regulation of interleukin-2 production | 32/3662 | 63/15509 | 2.5043e-06 | 2.59126e-05 | 1.55834e-05 | CD4/FOXP3/NAV3/TBX21/PTPRC/ABL1/PRKD2/GATA3/PDE4D/CD86/IL1A/TNFAIP3/CD80/IL1B/ZFP36/SFTPD/IRF4/RUNX1/NOD2/KAT5/STAT5B/GLMN/CD28/PDE4B/LILRB4/CARD9/PNP/CR1/PTPRC/LILRB4/LILRB4/LILRB4 | 32 |
| GO:0032731 | positive regulation of interleukin-1 beta production | 32/3662 | 63/15509 | 2.5043e-06 | 2.59126e-05 | 1.55834e-05 | TYROBP/P2RX7/TLR8/MEFV/PYCARD/NOD1/HSPB1/IFNG/IL17A/WNT5A/EGR1/CD36/IL6/TLR4/APP/GBP5/NOD2/LGALS9/CCL19/LPL/TNF/TNF/TNF/TNF/TNF/TNF/ORM1/TNF/TNF/NAIP/NAIP/NAIP | 32 |
| GO:0071214 | cellular response to abiotic stimulus | 108/3662 | 307/15509 | 2.62245e-06 | 2.70449e-05 | 1.62643e-05 | BAD/KDM1A/MAP3K14/NOX1/CRY1/SNAI2/FAS/BAK1/HSPA5/USP28/RAD51/CYBA/TMEM161A/MYLK/MAP2K4/HYAL2/XRCC5/ZMPSTE24/BAX/MMP2/MMP9/CD40/ACTR5/TLR8/NFAT5/N4BP1/PIEZO1/PYCARD/SFRP1/EEF1D/HAMP/MTPN/CASP2/ENG/GATA3/MAPK8/CRYAB/ASIC1/MAPK14/GADD45A/SLC2A1/PKD2/EGR1/TNFRSF10B/TNFRSF8/CRY2/KCNJ2/CDKN1A/IL1B/SLC25A23/ELK1/EPO/DDB2/NMT1/TANK/TLR4/XPA/FGF2/BRCA2/CUL4A/IGF1R/PARP1/RHOB/PIK3R1/TLK2/BAG3/NMT2/BMP6/XPC/CUL4B/AQP5/RPL26/SCNN1D/PRKCD/CASP3/TLR3/TP53INP1/NSMF/FADD/LETM1/PTAFR/MAP3K2/MGMT/TRIAP1/BCL2L1/RHNO1/DAG1/LIG4/HRAS/GRB2/PLEC/AURKB/CALR/NPM1/H2AC25/CHEK2/ZFP36L1/H2AX/CLN3/NOC2L/MME/MMP1/TLR7/TRPV1/MTOR/SIPA1/ITGB3/PTEN | 108 |
| GO:0104004 | cellular response to environmental stimulus | 108/3662 | 307/15509 | 2.62245e-06 | 2.70449e-05 | 1.62643e-05 | BAD/KDM1A/MAP3K14/NOX1/CRY1/SNAI2/FAS/BAK1/HSPA5/USP28/RAD51/CYBA/TMEM161A/MYLK/MAP2K4/HYAL2/XRCC5/ZMPSTE24/BAX/MMP2/MMP9/CD40/ACTR5/TLR8/NFAT5/N4BP1/PIEZO1/PYCARD/SFRP1/EEF1D/HAMP/MTPN/CASP2/ENG/GATA3/MAPK8/CRYAB/ASIC1/MAPK14/GADD45A/SLC2A1/PKD2/EGR1/TNFRSF10B/TNFRSF8/CRY2/KCNJ2/CDKN1A/IL1B/SLC25A23/ELK1/EPO/DDB2/NMT1/TANK/TLR4/XPA/FGF2/BRCA2/CUL4A/IGF1R/PARP1/RHOB/PIK3R1/TLK2/BAG3/NMT2/BMP6/XPC/CUL4B/AQP5/RPL26/SCNN1D/PRKCD/CASP3/TLR3/TP53INP1/NSMF/FADD/LETM1/PTAFR/MAP3K2/MGMT/TRIAP1/BCL2L1/RHNO1/DAG1/LIG4/HRAS/GRB2/PLEC/AURKB/CALR/NPM1/H2AC25/CHEK2/ZFP36L1/H2AX/CLN3/NOC2L/MME/MMP1/TLR7/TRPV1/MTOR/SIPA1/ITGB3/PTEN | 108 |
| GO:0042100 | B cell proliferation | 41/3662 | 89/15509 | 2.73138e-06 | 2.81214e-05 | 1.69117e-05 | CD38/BTK/TYROBP/CD22/CD74/FCGR2B/PTPRC/BAX/ABL1/CD40/NFATC2/CD40LG/IL7/CD79A/AHR/CD81/IL4/IL5/BCL6/PKN1/CDKN1A/CD70/EPHB2/IL10/TLR4/IL21/TNFRSF21/MS4A1/TNFRSF13C/CTLA4/PRKCD/CASP3/INPP5D/RAG2/CD19/IFNA1/TNFRSF13B/PTPRC/MIF/INPP5D/PTEN | 41 |
| GO:0032612 | interleukin-1 production | 48/3662 | 110/15509 | 2.74831e-06 | 2.82021e-05 | 1.69602e-05 | TYROBP/IGF1/ARG2/P2RX7/TLR8/ACP5/MEFV/PYCARD/CD33/NOD1/HSPB1/IFNG/IL17A/WNT5A/TNFAIP3/EGR1/CCR7/CD36/IL6/IL10/TLR4/ARRB2/APP/GBP5/NOD2/CX3CR1/LGALS9/IL16/CCL19/LPL/F2R/LILRB4/HMGB1/TNF/TNF/TNF/TNF/TNF/TNF/ORM1/TNF/TNF/NAIP/LILRB4/NAIP/LILRB4/LILRB4/NAIP | 48 |
| GO:0032652 | regulation of interleukin-1 production | 48/3662 | 110/15509 | 2.74831e-06 | 2.82021e-05 | 1.69602e-05 | TYROBP/IGF1/ARG2/P2RX7/TLR8/ACP5/MEFV/PYCARD/CD33/NOD1/HSPB1/IFNG/IL17A/WNT5A/TNFAIP3/EGR1/CCR7/CD36/IL6/IL10/TLR4/ARRB2/APP/GBP5/NOD2/CX3CR1/LGALS9/IL16/CCL19/LPL/F2R/LILRB4/HMGB1/TNF/TNF/TNF/TNF/TNF/TNF/ORM1/TNF/TNF/NAIP/LILRB4/NAIP/LILRB4/LILRB4/NAIP | 48 |
| GO:0042119 | neutrophil activation | 26/3662 | 47/15509 | 2.77414e-06 | 2.82931e-05 | 1.7015e-05 | KMT2E/TYROBP/GRN/SPI1/FCGR2B/STXBP2/CTSG/IL18/ITGB2/PRKCD/SYK/PTAFR/CXCL8/ITGAM/CXCR2/TNF/CD177/TNF/TNF/TNF/TNF/TNF/TNF/TNF/CCL5/CCL5 | 26 |
| GO:0008625 | extrinsic apoptotic signaling pathway via death domain receptors | 42/3662 | 92/15509 | 2.77539e-06 | 2.82931e-05 | 1.7015e-05 | BAD/HGF/SPI1/SP100/GSK3B/BAX/ICAM1/SFRP1/SERPINE1/PARK7/FASLG/TNFAIP3/TNFRSF10B/NGF/THBS1/PMAIP1/PIK3R1/BAG3/FAIM/PEA15/ATF3/ZDHHC3/NOS3/FADD/BCL2L1/FGG/FGA/DAPK1/TNF/DAXX/DAXX/TNF/TNF/DAXX/TNF/TNF/TNF/DAXX/TNF/DAXX/TNF/PTEN | 42 |
| GO:0002673 | regulation of acute inflammatory response | 29/3662 | 55/15509 | 2.77544e-06 | 2.82931e-05 | 1.7015e-05 | BTK/FCGR2B/OSM/PIK3CG/IL4/PARK7/ASH1L/IL1B/C3/CCR7/EDNRB/IL6/TNFRSF11A/ZP3/TNF/HLA-E/TNF/HLA-E/TNF/HLA-E/TNF/TNF/TNF/HLA-E/TNF/HLA-E/TNF/HLA-E/HLA-E | 29 |
| GO:0043525 | positive regulation of neuron apoptotic process | 29/3662 | 55/15509 | 2.77544e-06 | 2.82931e-05 | 1.7015e-05 | TYROBP/GRN/MAP2K4/RHOA/BAX/ABL1/MYBL2/GSK3A/CASP2/FASLG/FOXO3/SRPK2/TFAP2A/POU4F1/BCL2L11/CASP3/CDK5/ITGAM/DDIT3/CDK5R1/NQO1/TNF/TNF/TNF/TNF/TNF/TNF/TNF/TNF | 29 |
| GO:1901343 | negative regulation of vasculature development | 47/3662 | 107/15509 | 2.78192e-06 | 2.83125e-05 | 1.70266e-05 | E2F2/DCN/SARS1/ATP2B4/EPN1/TIE1/ROCK1/APOH/ANGPT2/AGO1/HOXA5/SERPINE1/STAT1/GADD45A/CD160/FASLG/TEK/SPRY2/THBS1/EPHA2/PLK2/HHEX/ADAMTS1/WNT4/PF4/SEMA3E/ADGRB1/FOXO4/HGS/THBS2/TNF/HLA-G/TNF/HLA-G/TNF/TNF/TNF/TNF/TNF/HLA-G/TNF/HLA-G/HLA-G/HLA-G/HLA-G/YJEFN3/HLA-G | 47 |
| GO:0019827 | stem cell population maintenance | 63/3662 | 157/15509 | 2.82136e-06 | 2.86669e-05 | 1.72397e-05 | PAF1/MED17/ARID4B/BICRA/ELAVL1/SPI1/SMC1A/TP63/ACTB/PCM1/KDM2B/BCL7C/MED15/SMARCB1/BMP7/RBBP7/SETD6/SFRP1/PTN/BMPR1A/SMC3/DDX6/BCL7A/HES1/KDM3A/BCL9/PRRX1/HDAC1/ARID1A/FOXO3/PHF19/SOX4/CNOT1/LIF/MED6/LOXL2/TAF5L/TET1/CUL4A/OGT/NOTCH1/HMGA2/FOXO1/ZFP36L2/KLF10/NODAL/KIT/SKI/FANCC/PADI4/TAF6L/RBBP4/SAP30/MED30/RBPJ/CDH2/TRIM8/LIG4/NOG/BCL9L/ZNF358/SMARCB1/PADI4 | 63 |
| GO:0032753 | positive regulation of interleukin-4 production | 20/3662 | 32/15509 | 3.04292e-06 | 3.08171e-05 | 1.85328e-05 | FOXP3/CD40LG/GATA3/CD86/RARA/IRF4/SYK/LGALS9/CEBPB/CD28/PRG2/ZP3/IL1RAP/HLA-E/HLA-E/HLA-E/HLA-E/HLA-E/HLA-E/HLA-E | 20 |
| GO:0045672 | positive regulation of osteoclast differentiation | 20/3662 | 32/15509 | 3.04292e-06 | 3.08171e-05 | 1.85328e-05 | TYROBP/IFNG/NEDD9/IL17A/IL12B/NOTCH2/POU4F2/POU4F1/KLF10/SLC9B2/FOS/CSF1/TNF/TNF/TNF/TNF/TNF/TNF/TNF/TNF | 20 |
| GO:0030336 | negative regulation of cell migration | 99/3662 | 277/15509 | 3.08526e-06 | 3.10978e-05 | 1.87017e-05 | NISCH/DCN/CD74/CDH1/ARID4B/ATP2B4/PTPRU/NGFR/TIE1/SP100/RHOA/NAV3/HYAL2/APOH/ANGPT2/APEX1/SMAD7/RBBP7/NDRG4/SFRP1/IL27RA/TGFB1/HAS1/SERPINE1/ENG/CXCL12/BMPR1A/CCL2/CORO1C/NEDD9/PPARD/IL4/HDAC1/GADD45A/PADI2/FOXO3/GNA13/RECK/LRP1/RRAS/APOE/NKX2-1/CCN3/CCL21/THBS1/CYP19A1/CYP1B1/TET1/FGF2/DUSP10/RHOB/SLIT2/GNA12/IGFBP3/OGT/NOTCH1/GJA1/RNF20/CXCL13/NODAL/STC1/ADIPOR1/RBBP4/WNT4/IL24/SAP30/SHH/TP53INP1/CX3CR1/DAG1/SVBP/CALR/MAPK15/ADIPOQ/ADGRB1/PLCB1/NOG/IFITM1/NF2/MAGI2/ARID2/HMGB1/SRGAP3/DPP4/CSNK2B/TNF/TNF/TNF/CSNK2B/CSNK2B/TNF/TNF/CSNK2B/TNF/TNF/TNF/CSNK2B/MIF/PTEN | 99 |
| GO:1902003 | regulation of amyloid-beta formation | 24/3662 | 42/15509 | 3.08838e-06 | 3.10978e-05 | 1.87017e-05 | IGF1/ROCK1/PICALM/GSK3A/IFNG/CLU/PIN1/APOE/RTN3/SORL1/RTN1/NTRK2/SLC2A13/CASP3/EFNA1/RELA/TNF/TNF/TNF/TNF/TNF/TNF/TNF/TNF | 24 |
| GO:1904037 | positive regulation of epithelial cell apoptotic process | 24/3662 | 42/15509 | 3.08838e-06 | 3.10978e-05 | 1.87017e-05 | BAD/BAX/CD40/CD40LG/SFRP4/CCL2/ITGA4/CD160/FASLG/FOXO3/IL6/THBS1/ARRB2/GSN/GPER1/AKR1C3/HLA-G/HLA-G/HLA-G/HLA-G/HLA-G/HLA-G/HLA-G/HLA-G | 24 |
| GO:0043161 | proteasome-mediated ubiquitin-dependent protein catabolic process | 134/3662 | 399/15509 | 3.09072e-06 | 3.10978e-05 | 1.87017e-05 | CDC27/PSMB1/HFE/PSMC4/RNF14/UFL1/HSPA5/HERPUD1/RNF4/ATXN3/SIRT2/SEL1L/FBXW11/DERL2/TBX21/MKRN2/TRAF4/SIRT6/UBE2A/UBE2K/PCNP/GSK3B/XPO1/PSMC5/NSFL1C/ANAPC5/HECTD1/BAG6/HSP90AB1/PSMD8/KCTD17/PSMC6/PSMA3/PSMA6/USP14/SMAD7/N4BP1/AXIN1/BFAR/SGTA/GSK3A/DVL1/FBXW4/PSMD3/CCDC47/UBE4A/USP5/MAN1A1/SKP1/PARK7/CDC20/FBXL5/RAD23B/AREL1/CLU/TRIM25/USP9X/KLHDC3/RBCK1/FBXL12/CBFA2T3/ADRM1/UBE2G1/FBXO44/HSPBP1/RNF122/APC/AKIRIN2/ECPAS/DERL1/FAM8A1/RNF121/CUL4A/ARRB2/CSNK1D/DTL/SPOPL/FEM1C/GNA12/TLK2/OGT/ERLIN2/EIF3H/DNAJB12/RNF144A/CLGN/UCHL1/FBXL18/UBXN11/CUL4B/ZFAND2B/PSMB4/PSMC2/SPSB3/WDR26/RYBP/PSMD6/RCHY1/SHH/TMUB1/VCP/NEMF/PSMC3/BTRC/RNF187/SPSB1/KAT5/PSMD1/GLMN/KCTD13/PSMD2/DDIT3/CALR/YOD1/PRKN/PRAME/USP7/PCBP2/SVIP/WWP2/UBE2J1/DCAF12/RNF5/BAG6/FBXO48/TRIM13/BAG6/BAG6/BAG6/BAG6/CEBPA/FBXO17/PSMB3/ITCH | 134 |
| GO:0006479 | protein methylation | 70/3662 | 180/15509 | 3.10206e-06 | 3.1111e-05 | 1.87096e-05 | NFYA/KDM1A/KMT2E/PAF1/AASS/ARID4B/PRDM1/KDM4A/NFYC/ATRX/MECOM/DNMT3B/SMARCB1/SNRPD3/SETD6/DOT1L/FBL/EZH2/GATA3/EZH1/NSD2/HCFC2/MACROH2A1/KDM3A/ASH1L/MYB/PHF19/DNMT3A/EEF1AKMT3/H1-3/PRMT1/ASH2L/PRDM12/DNMT1/PRMT7/MEN1/TET1/SKIC8/SMAD4/CARM1/BOD1/OGT/NSD3/SMARCA5/RNF20/BTG2/PRMT2/LMNA/GFI1/PYGO2/NSD1/NNMT/SETD5/H1-4/COPRS/HCFC1/TRMT112/SUZ12/SETD2/SETD3/KMT5A/TET3/H1-2/PAX5/WDR5/WDR5B/NCOA6/PCMTD2/SMARCB1/PAGR1 | 70 |
| GO:0008213 | protein alkylation | 70/3662 | 180/15509 | 3.10206e-06 | 3.1111e-05 | 1.87096e-05 | NFYA/KDM1A/KMT2E/PAF1/AASS/ARID4B/PRDM1/KDM4A/NFYC/ATRX/MECOM/DNMT3B/SMARCB1/SNRPD3/SETD6/DOT1L/FBL/EZH2/GATA3/EZH1/NSD2/HCFC2/MACROH2A1/KDM3A/ASH1L/MYB/PHF19/DNMT3A/EEF1AKMT3/H1-3/PRMT1/ASH2L/PRDM12/DNMT1/PRMT7/MEN1/TET1/SKIC8/SMAD4/CARM1/BOD1/OGT/NSD3/SMARCA5/RNF20/BTG2/PRMT2/LMNA/GFI1/PYGO2/NSD1/NNMT/SETD5/H1-4/COPRS/HCFC1/TRMT112/SUZ12/SETD2/SETD3/KMT5A/TET3/H1-2/PAX5/WDR5/WDR5B/NCOA6/PCMTD2/SMARCB1/PAGR1 | 70 |
| GO:0060445 | branching involved in salivary gland morphogenesis | 17/3662 | 25/15509 | 3.12555e-06 | 3.12454e-05 | 1.87905e-05 | SNAI2/HGF/FGFR2/BMP7/LAMA1/LAMA5/SHH/DAG1/TGM2/TNF/TNF/TNF/TNF/TNF/TNF/TNF/TNF | 17 |
| GO:0071800 | podosome assembly | 17/3662 | 25/15509 | 3.12555e-06 | 3.12454e-05 | 1.87905e-05 | RHOA/HCK/IL5/LCP1/DBNL/MSN/GSN/CSF2/SRC/TNF/TNF/TNF/TNF/TNF/TNF/TNF/TNF | 17 |
| GO:0050769 | positive regulation of neurogenesis | 83/3662 | 223/15509 | 3.15565e-06 | 3.14955e-05 | 1.89409e-05 | KDM1A/PAFAH1B1/UFL1/TNFRSF1B/NTN1/PLXNA2/TP73/XRCC5/LRP2/ADNP/TGFB1/PTN/CXCL12/WNT3/MDK/IFNG/DBN1/HES1/FN1/ID2/HDAC1/CXCR4/EGR2/OBSL1/IL1B/NKX2-2/BMP2/LIF/EPHB2/KRAS/NGF/SERPINE2/IL6/DBNL/ACTR2/FGF2/CRABP2/SLIT2/NTRK2/NOTCH1/ITGB1/VEGFC/POU4F2/KIT/FAIM/TBC1D24/DISC1/SHH/GPER1/CX3CR1/RGS14/LPAR3/MAP6/DAG1/LIG4/BDNF/CDH4/PLAG1/SS18L1/MME/MTOR/GPRASP3/TGM2/GDI1/TNF/TNF/LTA/TNF/LTA/TNF/TNF/TNF/TNF/LTA/LTA/TNF/LTA/TWF2/SHANK3/CUX1/NEFL/WNT3/WNT3 | 83 |
| GO:0032633 | interleukin-4 production | 22/3662 | 37/15509 | 3.21911e-06 | 3.20257e-05 | 1.92597e-05 | FOXP3/CD40LG/GATA3/CD86/NDFIP1/RARA/IRF4/SYK/LGALS9/CEBPB/DDIT3/CD28/PRG2/ZP3/IL1RAP/HLA-E/HLA-E/HLA-E/HLA-E/HLA-E/HLA-E/HLA-E | 22 |
| GO:0032673 | regulation of interleukin-4 production | 22/3662 | 37/15509 | 3.21911e-06 | 3.20257e-05 | 1.92597e-05 | FOXP3/CD40LG/GATA3/CD86/NDFIP1/RARA/IRF4/SYK/LGALS9/CEBPB/DDIT3/CD28/PRG2/ZP3/IL1RAP/HLA-E/HLA-E/HLA-E/HLA-E/HLA-E/HLA-E/HLA-E | 22 |
| GO:0032386 | regulation of intracellular transport | 107/3662 | 305/15509 | 3.36555e-06 | 3.34289e-05 | 2.01036e-05 | CDH1/ATP9A/IPO5/SP100/HYAL2/VPS35/CSNK2A2/PRKACA/DERL2/LMAN1/SPAG5/SIRT6/ACTN2/PCM1/GSK3B/XPO1/MAVS/HSP90AB1/SH3GLB1/RANGAP1/MLC1/GZMB/FERMT1/NDRG4/PDCD5/TGFB1/GSK3A/MAPK8/CRYAB/ZPR1/CD81/IFNG/MAPK14/BVES/TMEM30A/PARK7/TNNT2/NRDE2/TARDBP/NUP153/IL1B/ERGIC3/RAC2/PRKAA1/REEP2/XPO4/CD36/MDFIC/LCP1/NMT1/ANP32B/NUMA1/SORL1/RDX/CEP131/SAE1/SNAPIN/PIK3R1/MSN/SNX12/TCF7L2/BAG3/LDLRAP1/DMTN/ITGB2/PCNT/BAP1/PRKCD/ARFIP1/SHH/CDK5/CHP2/PKIG/MFF/ITGAM/CDK1/ARV1/BRSK2/LEP/HRAS/PDZK1/ATG13/CDK5R1/MIEF2/PTPN11/YOD1/MAPK15/ADIPOQ/SETD2/ANXA2/CIB1/PRKN/UBE2L3/USP7/PGAP1/SRC/SVIP/UBL5/UBE2J1/GDI1/HSPA1L/HSPA1L/FIS1/HSPA1L/HSPA1L/HSPA1L/PRKACA | 107 |
| GO:0031331 | positive regulation of cellular catabolic process | 127/3662 | 375/15509 | 3.45247e-06 | 3.42374e-05 | 2.05898e-05 | BAD/UPF1/DCN/RNF14/UFL1/IGF1/TNFRSF1B/HERPUD1/ROCK1/SIRT2/MKRN2/MLH1/SIRT6/MID2/GSK3B/TUT7/ATG16L1/BAX/P2RX7/HECTD1/SH3GLB1/SMAD7/AXIN1/NPRL3/TSC2/MEFV/SGTA/GSK3A/NOD1/TRIM14/EXOSC3/DVL1/SH3D19/IFNG/USP5/IL4/SNX4/TMEM59/PARK7/ELAPOR1/CDC20/FOXO3/CLU/PTK2B/TARDBP/CNOT1/IL1B/BECN1/ZFP36/KDR/CBFA2T3/APOE/SESN2/TRIM5/TRIM22/PRKAA1/GRSF1/HSPBP1/IL6/TTC5/EGF/FURIN/TOB1/CSNK1D/TRIM65/APP/ARNT/POLR2D/CNOT9/PLK2/C9orf72/SESN3/FOXO1/RNF144A/BAG3/HSPB8/ZFP36L2/BCL2L11/CNOT11/ZC3H18/BTG2/DISC1/FABP1/RCHY1/FYCO1/PRKCD/TP53INP1/VCP/NOD2/TRIM68/GPD1/ADAM9/ADRB2/PTK2/TRIM8/ORMDL3/PAIP1/DCP2/KAT5/PDE12/ATG13/MAGEF1/RGMA/PRKN/ZFP36L1/YTHDF3/HMGB1/DAPK1/SVIP/MTOR/GIGYF2/DXO/TNF/TRIM13/TNF/TNF/TNF/TNF/TNF/TNF/TNF/GAS5/CEBPA/IKBKG/PIP4K2B/PTEN/ITCH | 127 |
| GO:0010596 | negative regulation of endothelial cell migration | 31/3662 | 61/15509 | 3.53372e-06 | 3.49314e-05 | 2.10071e-05 | DCN/ATP2B4/SP100/RHOA/APOH/ANGPT2/TGFB1/GADD45A/APOE/THBS1/FGF2/SLIT2/NOTCH1/CXCL13/STC1/SVBP/ADGRB1/HMGB1/CSNK2B/TNF/TNF/TNF/CSNK2B/CSNK2B/TNF/TNF/CSNK2B/TNF/TNF/TNF/CSNK2B | 31 |
| GO:0070059 | intrinsic apoptotic signaling pathway in response to endoplasmic reticulum stress | 31/3662 | 61/15509 | 3.53372e-06 | 3.49314e-05 | 2.10071e-05 | BAK1/HERPUD1/PPP1R15A/BAX/BAG6/XBP1/CREB3/PARK7/TNFRSF10B/CHAC1/SERINC3/TMBIM6/PMAIP1/ITPR1/BCL2L11/BCL2L1/EIF2AK3/CEBPB/BRSK2/DDIT3/PTPN2/ERN1/GRINA/PRKN/MAP3K5/BAG6/MAGEA3/BAG6/BAG6/BAG6/BAG6 | 31 |
| GO:0030323 | respiratory tube development | 71/3662 | 184/15509 | 3.67025e-06 | 3.62233e-05 | 2.1784e-05 | ITGA3/FLT4/FGFR2/CDC42/GLI2/TRAF4/TULP3/TP73/HSPB11/PGR/ADAMTS2/RBBP9/BAG6/LAMA1/HOXA5/AIMP2/BMPR1A/PDGFRB/NPHP3/WNT5A/HES1/EPAS1/ARG1/THRA/ELK1/KDR/LIF/ALDH1A2/FOXJ1/LAMA5/AP3B1/CHI3L1/SFTPD/KRAS/PDGFRA/SPRY2/NKX2-1/FGF2/CYP1A2/NOTCH1/THRB/NODAL/MMP14/SELENON/TGFBR2/SHH/NOS3/ABCA3/RBPJ/NKIRAS2/ZFPM2/DAG1/SMAD2/NOG/WNT7B/MME/NKIRAS1/BAG6/TNF/TNF/TNF/TNF/BAG6/TNF/TNF/BAG6/TNF/TNF/BAG6/BAG6/CEBPA | 71 |
| GO:0045732 | positive regulation of protein catabolic process | 74/3662 | 194/15509 | 3.79337e-06 | 3.73789e-05 | 2.2479e-05 | OSBPL7/MYLIP/PSMC4/RNF14/TNFRSF1B/HERPUD1/ATXN3/SIRT2/VPS35/NSF/MKRN2/SIRT6/LRP2/GSK3B/PSMC5/HECTD1/BAG6/MARCHF2/PSMC6/SMAD7/AXIN1/SGTA/HAMP/GSK3A/DVL1/SH3D19/CD81/IFNG/USP5/WNT5A/CDC20/TNFAIP3/FBXL5/CLU/LRP1/IL1B/CBFA2T3/APOE/NDFIP1/HSPBP1/APC/SORL1/RDX/FURIN/CSNK1D/DTL/PLK2/MSN/FOXO1/RNF144A/CUL4B/PSMC2/RCHY1/VCP/PSMC3/ADAM9/RGMA/PRKN/ATG7/BAG6/TNF/TNF/TNF/TNF/BAG6/TNF/TNF/BAG6/TNF/TNF/BAG6/BAG6/CEBPA/ITCH | 74 |
| GO:0045766 | positive regulation of angiogenesis | 62/3662 | 155/15509 | 3.81496e-06 | 3.74725e-05 | 2.25353e-05 | HGF/GRN/HIPK2/TIE1/PKM/SIRT6/ANGPT2/ABL1/XBP1/CD40/FLT1/TJP1/PRKD2/HSPB1/SERPINE1/ENG/MDK/SMOC2/WNT5A/IL1A/PDCL3/WARS2/PGF/TEK/PTK2B/CXCR4/IL1B/C3/RRAS/KDR/CHI3L1/BTG1/IL10/THBS1/CYP1B1/FGF2/ITGAX/RHOB/HMGA2/ITGB1/VEGFC/DDAH1/PRKCA/NODAL/RUNX1/EMC10/JAK1/TGFBR2/AGGF1/TLR3/TERT/NOS3/CYBB/STIM1/CX3CR1/CXCL8/CCL11/CXCR2/PDCD6/ITGB3/AKT3/TJP1 | 62 |
| GO:1904018 | positive regulation of vasculature development | 62/3662 | 155/15509 | 3.81496e-06 | 3.74725e-05 | 2.25353e-05 | HGF/GRN/HIPK2/TIE1/PKM/SIRT6/ANGPT2/ABL1/XBP1/CD40/FLT1/TJP1/PRKD2/HSPB1/SERPINE1/ENG/MDK/SMOC2/WNT5A/IL1A/PDCL3/WARS2/PGF/TEK/PTK2B/CXCR4/IL1B/C3/RRAS/KDR/CHI3L1/BTG1/IL10/THBS1/CYP1B1/FGF2/ITGAX/RHOB/HMGA2/ITGB1/VEGFC/DDAH1/PRKCA/NODAL/RUNX1/EMC10/JAK1/TGFBR2/AGGF1/TLR3/TERT/NOS3/CYBB/STIM1/CX3CR1/CXCL8/CCL11/CXCR2/PDCD6/ITGB3/AKT3/TJP1 | 62 |
| GO:0016525 | negative regulation of angiogenesis | 46/3662 | 105/15509 | 3.85923e-06 | 3.76844e-05 | 2.26627e-05 | E2F2/DCN/SARS1/ATP2B4/EPN1/TIE1/ROCK1/APOH/ANGPT2/AGO1/HOXA5/SERPINE1/STAT1/GADD45A/CD160/FASLG/TEK/SPRY2/THBS1/EPHA2/PLK2/HHEX/ADAMTS1/PF4/SEMA3E/ADGRB1/FOXO4/HGS/THBS2/TNF/HLA-G/TNF/HLA-G/TNF/TNF/TNF/TNF/TNF/HLA-G/TNF/HLA-G/HLA-G/HLA-G/HLA-G/YJEFN3/HLA-G | 46 |
| GO:0002287 | alpha-beta T cell activation involved in immune response | 32/3662 | 64/15509 | 3.87984e-06 | 3.76844e-05 | 2.26627e-05 | TMEM98/FOXP3/TBX21/IL4R/IL12RB1/SMAD7/JAK3/GATA3/IFNG/IL12B/IL4/BCL6/CD86/MYB/CD80/RARA/IL6/HLX/IRF4/IL21/IL18/IL6R/LGALS9/CCL19/HMGB1/ENTPD7/MTOR/HLA-DRA/HLA-DRA/HLA-DRA/HLA-DRA/HLA-DRA | 32 |
| GO:0002293 | alpha-beta T cell differentiation involved in immune response | 32/3662 | 64/15509 | 3.87984e-06 | 3.76844e-05 | 2.26627e-05 | TMEM98/FOXP3/TBX21/IL4R/IL12RB1/SMAD7/JAK3/GATA3/IFNG/IL12B/IL4/BCL6/CD86/MYB/CD80/RARA/IL6/HLX/IRF4/IL21/IL18/IL6R/LGALS9/CCL19/HMGB1/ENTPD7/MTOR/HLA-DRA/HLA-DRA/HLA-DRA/HLA-DRA/HLA-DRA | 32 |
| GO:0002886 | regulation of myeloid leukocyte mediated immunity | 32/3662 | 64/15509 | 3.87984e-06 | 3.76844e-05 | 2.26627e-05 | BTK/TYROBP/GAB2/C12orf4/SPI1/FCGR2B/STXBP2/IL4R/DDX1/MAVS/GATA1/IL4/SNX4/ARG1/VAMP8/C3/RAC2/STXBP1/ITGB2/SYK/CX3CR1/LGALS9/PTAFR/ITGAM/HLA-E/CD177/HLA-E/HLA-E/HLA-E/HLA-E/HLA-E/HLA-E | 32 |
| GO:0046850 | regulation of bone remodeling | 25/3662 | 45/15509 | 3.88108e-06 | 3.76844e-05 | 2.26627e-05 | CD38/P2RX7/CSK/SFRP1/HAMP/MDK/CALCA/LEPR/TNFAIP3/SPP1/IAPP/IL6/DEF8/TNFRSF11A/PRKCA/TNFRSF11B/SYK/INPP5D/S1PR1/GPR137/LEP/CSF1R/SRC/ITGB3/INPP5D | 25 |
| GO:0050850 | positive regulation of calcium-mediated signaling | 25/3662 | 45/15509 | 3.88108e-06 | 3.76844e-05 | 2.26627e-05 | CD4/PTBP1/IGF1/ERBB3/P2RX5/PPP3CB/ZAP70/SPPL3/SYK/CHP2/HINT1/CIB1/P2RX2/TNF/TNF/STIMATE/TNF/TNF/TNF/TNF/TNF/TNF/CCL4/CCL4/CCL4 | 25 |
| GO:2001239 | regulation of extrinsic apoptotic signaling pathway in absence of ligand | 25/3662 | 45/15509 | 3.88108e-06 | 3.76844e-05 | 2.26627e-05 | SNAI2/FGFR1/SRPX/GATA1/EYA1/IL7/UNC5B/EYA4/IL1A/INHBA/IL1B/COL2A1/PF4/TERT/CSF2/PRDX2/BCL2L1/TNF/TNF/TNF/TNF/TNF/TNF/TNF/TNF | 25 |
| GO:0010001 | glial cell differentiation | 80/3662 | 214/15509 | 3.88658e-06 | 3.76844e-05 | 2.26627e-05 | TMEM98/CNTN1/TNFRSF1B/GRN/ERBB3/KDM4A/RHOA/SIRT2/WDR1/TP73/ABL1/CSK/ARHGEF10/ERCC2/TGFB1/PTN/CNTNAP1/MDK/IFNG/HES1/ID2/HDAC1/EIF2B2/CLU/CXCR4/EGR2/LRP1/SOX4/MYRF/IL1B/NKX2-2/BMP2/NR1D1/LIF/WASF3/KRAS/TSPAN2/SERPINE2/IL6/NKX2-1/TLR4/FGF2/SOD1/APP/DUSP10/TNFRSF21/NTRK2/NOTCH1/PARD3/SKI/CUL4B/B4GALT5/MXRA8/SLC25A46/SHH/CDK5/CDK1/CDH2/LAMB2/DAG1/CNP/KCNJ10/PLEC/SUZ12/PTPN11/F2/NOG/CNTN2/POU3F2/ROR1/MTOR/TNF/TNF/TNF/TNF/TNF/TNF/TNF/TNF/PTEN | 80 |
| GO:0002645 | positive regulation of tolerance induction | 16/3662 | 23/15509 | 3.89126e-06 | 3.76844e-05 | 2.26627e-05 | FOXP3/FOXJ1/TGFBR2/LILRB4/HLA-G/HLA-G/HLA-G/HLA-G/HLA-G/HLA-G/HLA-G/LILRB4/HLA-G/LILRB4/LILRB4/ITCH | 16 |
| GO:0007059 | chromosome segregation | 113/3662 | 327/15509 | 4.09422e-06 | 3.95881e-05 | 2.38076e-05 | CDC27/BAZ1B/CENPQ/ARID1B/PUM2/MSH4/SIRT2/CSNK2A2/CDC42/SMC1A/NDE1/ACTB/MLH1/SPAG5/NDC80/PIBF1/ATRX/SEH1L/CHMP5/ZW10/ANAPC5/BIRC5/NUDC/KIF4A/CDC6/BAG6/BCL7C/SMARCB1/CCNB1IP1/CHMP4B/RIOK3/UBE2I/RAB11A/ERCC2/CCNE1/SMC3/RECQL5/SMARCD2/BCL7A/FBXO5/MACROH2A1/SMC4/KAT2B/TTL/CDC20/NSL1/ARID1A/SLF2/TEX14/NAA50/PDS5A/CENPK/USP9X/BECN1/MAU2/CEP85/CHMP1A/TOP2A/CCNB1/ARL8B/PSRC1/CDCA8/APC/NUMA1/NUSAP1/KIF23/KNL1/ACTR2/CENPE/RB1/KIF2C/ARL8A/CIAO1/CENPC/BOD1/TLK2/NCAPG2/MKI67/SPC25/SMARCA5/SKA1/EME1/GEM/SKA3/BRD7/CENPN/RGS14/BUB1/CENPX/KAT5/ZWILCH/CCNE2/BANF1/RMI2/CHMP6/RMI1/AURKB/RCC2/MAPK15/KMT5A/PLSCR1/ARID2/BAG6/SYCE1L/BAG6/BAG6/BAG6/BAG6/KIFC1/SMARCB1/NDE1/TOP3A/SPICE1 | 113 |
| GO:0009746 | response to hexose | 69/3662 | 178/15509 | 4.14877e-06 | 4.00531e-05 | 2.40872e-05 | BAD/CASR/CYBA/RHOA/PDK3/PRKACA/OPRK1/OXCT1/NOX4/ICAM1/ANGPT2/SMARCB1/XBP1/PCK2/SLC39A14/PPP3CB/RPS6KB1/PPARD/SLC29A1/FOXO3/EIF2B2/GPAM/EGR1/PTK2B/SOX4/NKX2-2/NR1D1/SESN2/PRKAA1/MEN1/GLUL/THBS1/KHK/IGF1R/SMAD4/COL6A2/PKLR/EPHA5/TCF7L2/TGFBR2/SLC9B2/CASP3/GPER1/CCDC186/PRKCE/NPTX1/KAT5/BRSK2/SMAD2/LPL/ERN1/RMI1/ADIPOQ/MAFA/SLC8A1/PIM3/SELENOT/TNF/TNF/TNF/TNF/TNF/TNF/TNF/TNF/PKLR/TXNIP/SMARCB1/PRKACA | 69 |
| GO:0043372 | positive regulation of CD4-positive, alpha-beta T cell differentiation | 21/3662 | 35/15509 | 4.4056e-06 | 4.24664e-05 | 2.55386e-05 | FOXP3/IL4R/IL12RB1/IFNG/IL12B/CD86/MYB/CD80/RARA/HLX/IL2RG/IL18/LGALS9/CCL19/KLHL25/SOCS1/HLA-DRA/HLA-DRA/HLA-DRA/HLA-DRA/HLA-DRA | 21 |
| GO:2001020 | regulation of response to DNA damage stimulus | 99/3662 | 279/15509 | 4.41481e-06 | 4.24891e-05 | 2.55522e-05 | KDM1A/CRY1/BAZ1B/SNAI2/CD74/CD44/PARP3/ARID1B/RAD51/FAM168A/TMEM161A/ACTB/SIRT6/ZMPSTE24/ATXN7L3/FUS/ABL1/BCL7C/SMARCB1/TFIP11/RBBP8/EYA1/YJU2/ZNHIT1/CXCL12/RECQL5/SMARCD2/DDX5/NSD2/BCL7A/FOXM1/FBXO5/EYA4/KAT2B/NEK4/INO80D/ARID1A/SLF2/CLU/SHLD2/MORF4L2/SOX4/DEK/EEF1E1/YEATS4/AUNIP/POT1/TAF5L/EPC2/IER3/ACTR2/BRCA2/CUL4A/PMAIP1/DYRK3/PARP1/EGFR/RADX/PPP4C/HMGA2/SMARCA5/CCDC117/MRNIP/ZNF385A/RPL26/TAF6L/PRKCD/BRD7/RNF169/NUDT16L1/RFWD3/MGMT/TRIAP1/TADA3/BCL2L1/KAT5/RMI2/MAGEF1/TAF7/NPM1/SETD2/PTTG1IP/CHEK2/KMT5A/MUC1/H2AX/ARID2/HMGB1/TRRAP/SPRED2/IER3/IER3/IER3/IER3/IER3/PRKDC/RTEL1/SMARCB1/MIF | 99 |
| GO:0034250 | positive regulation of cellular amide metabolic process | 59/3662 | 146/15509 | 4.42777e-06 | 4.25478e-05 | 2.55875e-05 | ELAVL1/PKM/RHOA/PICALM/PPP1R15A/GCN1/CIRBP/PCIF1/GSK3A/LARP4B/RPS6KB1/C1QBP/IFNG/PASK/SERP1/CLU/PTK2B/SOX4/NIBAN1/IL6/THBS1/CYP1B1/LARP1B/TARBP2/TOB1/EIF4A3/CCN1/POLR2D/SLC2A13/CDC123/GUF1/RMND1/USP16/RPL26/PRKCD/CASP3/RPUSD4/NOD2/EFNA1/PTAFR/PAIP1/RELA/CD28/NPM1/EIF3C/YTHDF3/MTOR/TNF/TNF/TNF/TNF/TNF/TNF/TNF/TNF/EIF6/PRKDC/CCL5/CCL5 | 59 |
| GO:0002604 | regulation of dendritic cell antigen processing and presentation | 10/3662 | 11/15509 | 4.6128e-06 | 4.39849e-05 | 2.64517e-05 | SLC11A1/CD74/FCGR2B/NOD1/CCR7/CD68/CCL21/THBS1/NOD2/CCL19 | 10 |
| GO:0002941 | synoviocyte proliferation | 10/3662 | 11/15509 | 4.6128e-06 | 4.39849e-05 | 2.64517e-05 | BTK/TNF/TNF/TNF/TNF/TNF/TNF/TNF/TNF/NEAT1 | 10 |
| GO:0016098 | monoterpenoid metabolic process | 10/3662 | 11/15509 | 4.6128e-06 | 4.39849e-05 | 2.64517e-05 | CYP2D6/CYP2E1/CYP1A2/CYP3A4/CYP2C19/CYP2D6/CYP2D6/CYP2D6/CYP2D6/CYP2D6 | 10 |
| GO:1901645 | regulation of synoviocyte proliferation | 10/3662 | 11/15509 | 4.6128e-06 | 4.39849e-05 | 2.64517e-05 | BTK/TNF/TNF/TNF/TNF/TNF/TNF/TNF/TNF/NEAT1 | 10 |
| GO:1901647 | positive regulation of synoviocyte proliferation | 10/3662 | 11/15509 | 4.6128e-06 | 4.39849e-05 | 2.64517e-05 | BTK/TNF/TNF/TNF/TNF/TNF/TNF/TNF/TNF/NEAT1 | 10 |
| GO:1902991 | regulation of amyloid precursor protein catabolic process | 26/3662 | 48/15509 | 4.69638e-06 | 4.4713e-05 | 2.68896e-05 | IGF1/ROCK1/PICALM/FKBP1A/GSK3A/IFNG/CLU/PIN1/APOE/FLOT2/RTN3/SORL1/RTN1/NTRK2/SLC2A13/CASP3/EFNA1/RELA/TNF/TNF/TNF/TNF/TNF/TNF/TNF/TNF | 26 |
| GO:0034728 | nucleosome organization | 57/3662 | 140/15509 | 4.85995e-06 | 4.61993e-05 | 2.77835e-05 | ATRX/SUPT16H/SMARCB1/CHRAC1/ZNHIT1/SMARCD2/MACROH2A1/ARID1A/H1-3/H2BC11/YEATS4/HP1BP3/ANP32B/HMGA1/ANP32E/SSRP1/SMARCA5/H2BC5/CHAF1B/PADI4/H3-3A/CHAF1A/H1-4/KAT5/NPM1/H2AC25/SETD2/H2BC21/H1-2/H2AX/H1-0/ARID2/H2BC26/BRD2/DAXX/DAXX/DNAJC9/BRD2/DAXX/DAXX/BRD2/DAXX/H2BC15/BRD2/BRD2/H4C15/H4C14/H4C12/H2BC6/H3C6/SMARCB1/H4C5/H4C4/H2BC7/H3C10/PADI4/H3C2 | 57 |
| GO:0010633 | negative regulation of epithelial cell migration | 36/3662 | 76/15509 | 4.93924e-06 | 4.68095e-05 | 2.81504e-05 | DCN/ATP2B4/SP100/RHOA/APOH/ANGPT2/TGFB1/CORO1C/IL4/GADD45A/APOE/THBS1/FGF2/DUSP10/SLIT2/NOTCH1/CXCL13/STC1/ADIPOR1/SVBP/ADGRB1/HMGB1/CSNK2B/TNF/TNF/TNF/CSNK2B/CSNK2B/TNF/TNF/CSNK2B/TNF/TNF/TNF/CSNK2B/PTEN | 36 |
| GO:0042982 | amyloid precursor protein metabolic process | 36/3662 | 76/15509 | 4.93924e-06 | 4.68095e-05 | 2.81504e-05 | IGF1/SOAT1/ROCK1/PICALM/ACHE/FKBP1A/GSK3A/IFNG/CLU/NECAB3/PIN1/APOE/FLOT2/RTN3/ADAM19/ITM2C/SORL1/RTN1/PSEN2/NTRK2/SLC2A13/LDLRAP1/CASP3/EFNA1/RELA/CLN3/TNF/PSENEN/TNF/TNF/TNF/TNF/TNF/TNF/TNF/AATF | 36 |
| GO:0060541 | respiratory system development | 76/3662 | 202/15509 | 5.10963e-06 | 4.83503e-05 | 2.9077e-05 | ITGA3/FLT4/FGFR2/CDC42/GLI2/TULP3/TP73/HSPB11/PGR/ADAMTS2/RBBP9/BAG6/LAMA1/RPGRIP1L/HOXA5/AIMP2/BMPR1A/PDGFRB/NPHP3/WNT5A/HES1/EPAS1/ARG1/THRA/ELK1/KDR/LIF/ALDH1A2/FOXJ1/LAMA5/ASS1/RARA/AP3B1/CHI3L1/SFTPD/KRAS/PDGFRA/SPRY2/NKX2-1/FGF2/CYP1A2/NOTCH1/THRB/SPEF2/NODAL/MMP14/SKI/SELENON/TGFBR2/SHH/NOS3/ABCA3/RBPJ/NKIRAS2/ZFPM2/RARG/DAG1/SMAD2/NOG/WNT7B/MME/NKIRAS1/BAG6/TNF/TNF/TNF/TNF/BAG6/TNF/TNF/BAG6/TNF/TNF/BAG6/BAG6/CEBPA | 76 |
| GO:0010038 | response to metal ion | 114/3662 | 332/15509 | 5.2213e-06 | 4.93317e-05 | 2.96672e-05 | BAD/HFE/PPP5C/CPS1/CASR/CDH1/HSPA5/RASGRP2/SLC25A24/ADD1/P2RX7/MMP9/GPI/HAMP/GSK3A/TFR2/MAPK8/PPIF/CCND1/SLC11A2/CUTA/PPP2CA/WNT5A/IL1A/SLC30A3/IGFBP2/SDC1/PARK7/TNNT2/ARG1/PKD2/DNMT3A/PTK2B/CAT/SLC25A23/FOSB/BECN1/ASS1/PRKAA1/SYT11/LOXL2/TFAP2A/THBS1/KHK/CARF/CYP1A1/CYP1A2/IMPA2/SOD1/APP/KCNH1/PKLR/PARP1/SYT2/CALM2/EGFR/ALAD/BMP6/KIT/DMTN/CALM3/ADAMTS13/ALOX15/VCAM1/INHBB/CASP3/TERT/SHH/ADCY1/TNFRSF11B/FXN/TRPV6/CYBB/AQP3/CHP2/STIM1/ADAM9/AHCYL1/ARL13B/CDK1/FOS/CD14/NPTX1/FGG/FGA/GPHN/EIF2AK3/BSG/LIG4/JUN/KCNJ10/CALR/NQO1/PRKN/PLSCR1/AKR1C3/CACNA1H/MBP/GDI1/DAXX/DAXX/CHUK/CPNE1/DAXX/DAXX/DAXX/CEBPA/PDCD6/PKLR/TXNIP/B2M/TRPV6/ADAMTS13/GPI | 114 |
| GO:0002444 | myeloid leukocyte mediated immunity | 46/3662 | 106/15509 | 5.27047e-06 | 4.97205e-05 | 2.9901e-05 | KMT2E/BTK/TYROBP/GAB2/C12orf4/SPI1/WDR1/FCGR2B/STXBP2/IL4R/DDX1/LAT2/MAVS/CTSG/GATA1/PIK3CG/IL4/SNX4/ARG1/VAMP8/NR4A3/C3/RAC2/IL6/STXBP1/CPLX2/KIT/ITGB2/SYK/CX3CR1/LGALS9/PTAFR/ITGAM/SERPINB9/F2/CARD9/ELANE/HLA-E/CD177/HLA-E/HLA-E/HLA-E/HLA-E/HLA-E/HLA-E/ELANE | 46 |
| GO:0033209 | tumor necrosis factor-mediated signaling pathway | 45/3662 | 103/15509 | 5.35161e-06 | 5.04092e-05 | 3.03152e-05 | BIRC3/FAS/TNFRSF1B/TNFRSF17/TRAF1/UBE2K/NFKBIA/BIRC7/PYCARD/KRT18/STAT1/TNFAIP3/FOXO3/PTK2B/H2BC11/CD70/EDA2R/TRAF3/PIAS3/TNFRSF11A/COMMD7/TNFRSF13C/SYK/NKIRAS2/LIMS1/RELA/PTPN2/ADIPOQ/TRAIP/PRKN/NKIRAS1/TNF/TMSB4X/TNF/CHUK/CPNE1/TNF/TNF/TNF/TNF/TNF/TNF/NAIP/NAIP/NAIP | 45 |
| GO:0071824 | protein-DNA complex subunit organization | 89/3662 | 246/15509 | 5.4478e-06 | 5.12374e-05 | 3.08133e-05 | MED24/MED17/RAD51/MED29/RNF4/SIRT6/ATRX/ESR1/SUPT16H/MED15/SMARCB1/PSMC6/TAF1C/CHRAC1/MED25/ZNHIT1/SMARCD2/MACROH2A1/DR1/ARID1A/HELLS/CENPK/H1-3/H2BC11/THRA/YEATS4/HP1BP3/MED6/ANP32B/HMGA1/TAF8/CENPE/RB1/ANP32E/CENPC/BDP1/SSRP1/SMARCA5/H2BC5/CHAF1B/PADI4/TAF6L/H3-3A/MED30/GTF2A1/CENPN/CHAF1A/H1-4/CENPX/KAT5/MED16/TAF7/NPM1/H2AC25/SETD2/H2BC21/BRF1/H1-2/CENPP/H2AX/H1-0/ARID2/HMGB1/H2BC26/TAF13/BRD2/DAXX/DAXX/DNAJC9/BRD2/DAXX/DAXX/BRD2/DAXX/H2BC15/BRD2/BRD2/H4C15/H4C14/H4C12/H2BC6/H3C6/SMARCB1/H4C5/H4C4/H2BC7/H3C10/PADI4/H3C2 | 89 |
| GO:0043550 | regulation of lipid kinase activity | 31/3662 | 62/15509 | 5.47647e-06 | 5.14291e-05 | 3.09285e-05 | FGFR3/CDC42/EPHA8/PIK3IP1/PDGFB/EEF1A2/FLT1/TGFB1/CCKBR/CD81/PDGFRB/CISH/TEK/PTK2B/FLT3/CCR7/ATG14/PDGFRA/CCL21/FGF2/RB1/PIK3R1/KIT/NOD2/PTK2/CCL19/CD19/F2/SOCS1/SRC/PIP4K2B | 31 |
| GO:0051090 | regulation of DNA-binding transcription factor activity | 132/3662 | 396/15509 | 5.62727e-06 | 5.27652e-05 | 3.17321e-05 | KDM1A/DHX33/BTK/MBTPS2/LTF/UFL1/FOXP3/EIF2AK2/TRAF1/HIPK2/SPI1/SP100/TCF3/MID2/ERC1/MAVS/ESR1/SMARCB1/PSMA6/NFKBIA/CD40/BMP7/HCK/SMAD7/CD40LG/SETD6/PYCARD/PRKD2/MTPN/TAX1BP1/NOD1/EZH2/SFRP4/TRIM14/MAPK8/CSF3/IL5/WNT5A/HES1/ID2/PARK7/TNFAIP3/PKD2/SFRP5/CLU/TRIM25/CAT/IL1B/RBCK1/BMP2/ID1/FOXJ1/EDA2R/TRAF3/TRIM5/TRIM22/FLOT2/BEX1/MEN1/BHLHE40/CD36/IL6/IL10/TLR4/CYP1B1/CARF/RB1/ARRB2/TNFRSF11A/APP/HES6/EPHA5/TCF7L2/PPRC1/COMMD7/ARID5B/IL18/POU4F2/POU4F1/NODAL/KIT/PRMT2/GFI1/HEYL/TLR3/SHH/ADCY1/SYK/BTRC/NOD2/TRIM68/PRDX2/CX3CR1/LGALS9/ALK/TRIM8/RELA/FZD4/DDIT3/FOSL1/CTNNBIP1/NPM1/TRAIP/IRAK1/CIB1/SIGIRR/ROR1/RNF220/USP7/CARD9/IL1RAP/PPIA/TFDP1/WWP2/NTRK1/TNF/TRIM13/TMSB4X/TNF/CHUK/TNF/TNF/TNF/TNF/TNF/TNF/TRIM26/IKBKG/SMARCB1/LRP6/PTEN/ITCH | 132 |
| GO:1901990 | regulation of mitotic cell cycle phase transition | 100/3662 | 284/15509 | 5.80056e-06 | 5.43079e-05 | 3.26598e-05 | CDC27/KMT2E/FHL1/ARID1B/SIRT2/ACTB/NDC80/ZW10/ANAPC5/BIRC5/PSME1/CDC6/CDC7/BCL7C/SMARCB1/APEX1/CDC25B/RBBP8/RAB11A/NBN/ERCC2/CASP2/EZH2/SMARCD2/CCL2/CCND1/BCL7A/FBXO5/CCND3/CCNG1/RAD50/PPP2CA/ID2/CDC20/ARID1A/PKD2/TEX14/INHBA/CDKN1A/HSPA2/PSME3/CCNB1/CCNH/CDCA8/APC/RDX/CENPE/NABP2/RB1/CUL4A/CYP1A1/APP/DTL/INTS3/CTDSP1/PLK2/EGFR/SPC25/ZFP36L2/ADAMTS1/XPC/LSM11/APPL1/CUL4B/PRMT2/BRSK1/MRNIP/DBF4B/RPL26/ERCC3/TERT/BRD7/WEE1/RRM1/RFWD3/BUB1/AVEN/CDK1/TRIAP1/RRM2/NABP1/ZWILCH/CTDSP2/AURKB/RCC2/CACNB4/PLCB1/CHEK2/FOXO4/CDK10/MUC1/PBX1/ZFP36L1/ARID2/KANK2/TFDP1/GIGYF2/PRKDC/SMARCB1/PTEN | 100 |
| GO:1902806 | regulation of cell cycle G1/S phase transition | 63/3662 | 160/15509 | 5.89736e-06 | 5.51309e-05 | 3.31548e-05 | KMT2E/PAF1/FHL1/ARID1B/ATP2B4/ACTB/PSME1/CDC6/BCL7C/SMARCB1/APEX1/CASP2/EZH2/SMARCD2/CCL2/CCND1/BCL7A/CCND3/PPP2CA/ID2/ARID1A/PKD2/INHBA/CDKN1A/PSME3/MEN1/CCNH/APC/RDX/RB1/CUL4A/CYP1A1/CTDSP1/PLK2/EGFR/ADAMTS1/LSM11/APPL1/CUL4B/PRMT2/RPL26/TERT/BRD7/WEE1/RRM1/RFWD3/MN1/TRIAP1/RRM2/CTDSP2/CACNB4/PLCB1/CHEK2/CDK10/MUC1/ARID2/KANK2/TFDP1/GIGYF2/PRKDC/SMARCB1/PAGR1/PTEN | 63 |
| GO:0045023 | G0 to G1 transition | 22/3662 | 38/15509 | 5.94167e-06 | 5.5295e-05 | 3.32535e-05 | ARID1B/ACTB/BCL7C/SMARCB1/SMARCD2/BCL7A/ARID1A/SOX15/BRD7/RRM1/RHNO1/FOXO4/ARID2/HLA-G/HLA-G/HLA-G/HLA-G/HLA-G/HLA-G/HLA-G/SMARCB1/HLA-G | 22 |
| GO:1901099 | negative regulation of signal transduction in absence of ligand | 22/3662 | 38/15509 | 5.94167e-06 | 5.5295e-05 | 3.32535e-05 | SNAI2/GATA1/EYA1/IL7/UNC5B/EYA4/IL1A/IL1B/COL2A1/PF4/TERT/CSF2/PRDX2/BCL2L1/TNF/TNF/TNF/TNF/TNF/TNF/TNF/TNF | 22 |
| GO:2001240 | negative regulation of extrinsic apoptotic signaling pathway in absence of ligand | 22/3662 | 38/15509 | 5.94167e-06 | 5.5295e-05 | 3.32535e-05 | SNAI2/GATA1/EYA1/IL7/UNC5B/EYA4/IL1A/IL1B/COL2A1/PF4/TERT/CSF2/PRDX2/BCL2L1/TNF/TNF/TNF/TNF/TNF/TNF/TNF/TNF | 22 |
| GO:0010508 | positive regulation of autophagy | 51/3662 | 122/15509 | 6.19048e-06 | 5.73013e-05 | 3.446e-05 | BAD/DCN/UFL1/ROCK1/MID2/GSK3B/ATG16L1/SH3GLB1/NPRL3/TSC2/MEFV/GSK3A/NOD1/TRIM14/IFNG/IL4/SNX4/TMEM59/PARK7/ELAPOR1/FOXO3/BECN1/KDR/SESN2/TRIM5/TRIM22/PRKAA1/TRIM65/PLK2/C9orf72/SESN3/FOXO1/BAG3/HSPB8/BCL2L11/FYCO1/TP53INP1/NOD2/TRIM68/ADRB2/TRIM8/ORMDL3/KAT5/ATG13/PRKN/HMGB1/DAPK1/SVIP/TRIM13/IKBKG/PIP4K2B | 51 |
| GO:0044772 | mitotic cell cycle phase transition | 129/3662 | 386/15509 | 6.19371e-06 | 5.73013e-05 | 3.446e-05 | CDC27/KMT2E/USH1C/DBF4/SPAST/FHL1/ARID1B/SIRT2/ACTB/NDC80/ABCB1/ZW10/ANAPC5/BIRC5/PSME1/CDC6/CDC7/BCL7C/SMARCB1/CDKN3/APEX1/CDC25B/CHMP4B/RBBP8/RAB11A/NBN/ERCC2/CCNE1/CASP2/EZH2/RPS6KB1/SMARCD2/CCL2/ZPR1/CCND1/BCL7A/FOXM1/FBXO5/CCND3/CCNG1/RAD50/PPP2CA/ID2/CDC20/ARID1A/PKD2/CCNI/PPP6C/MASTL/TEX14/INHBA/CDKN1A/HSPA2/FBXL12/PKMYT1/PSME3/CCNA1/CCNB1/CCNH/CDCA8/APC/RDX/CENPE/NABP2/RB1/CUL4A/CYP1A1/APP/ENSA/DTL/INTS3/CALM2/CTDSP1/CCNA2/PLK2/EGFR/ITGB1/CACUL1/SPC25/ZFP36L2/ADAMTS1/XPC/LSM11/APPL1/CUL4B/CALM3/PRMT2/BRSK1/MRNIP/DBF4B/RPL26/GFI1/ERCC3/TERT/CDK5/BRD7/WEE1/RRM1/RFWD3/BUB1/AVEN/CDK1/PPM1D/TRIAP1/RRM2/KLF11/CKS1B/NABP1/ZWILCH/BRSK2/CTDSP2/CCNE2/AURKB/RCC2/CACNB4/PLCB1/CHEK2/FOXO4/CDK10/MUC1/PBX1/ZFP36L1/ARID2/KANK2/TFDP1/GIGYF2/PRKDC/SMARCB1/PTEN | 129 |
| GO:0002678 | positive regulation of chronic inflammatory response | 13/3662 | 17/15509 | 6.20348e-06 | 5.73013e-05 | 3.446e-05 | TNF/TNF/LTA/TNF/LTA/TNF/TNF/TNF/TNF/LTA/LTA/TNF/LTA | 13 |
| GO:0031642 | negative regulation of myelination | 13/3662 | 17/15509 | 6.20348e-06 | 5.73013e-05 | 3.446e-05 | TMEM98/CTSC/TNFRSF21/EIF2AK3/TNF/TNF/TNF/TNF/TNF/TNF/TNF/TNF/PTEN | 13 |
| GO:0042368 | vitamin D biosynthetic process | 13/3662 | 17/15509 | 6.20348e-06 | 5.73013e-05 | 3.446e-05 | SNAI2/CYP27B1/IFNG/CYP3A4/GFI1/TNF/TNF/TNF/TNF/TNF/TNF/TNF/TNF | 13 |
| GO:0002883 | regulation of hypersensitivity | 12/3662 | 15/15509 | 6.46879e-06 | 5.9663e-05 | 3.58803e-05 | BTK/FCGR2B/C3/CCR7/ZP3/HLA-E/HLA-E/HLA-E/HLA-E/HLA-E/HLA-E/HLA-E | 12 |
| GO:0044770 | cell cycle phase transition | 154/3662 | 476/15509 | 6.51928e-06 | 5.99622e-05 | 3.60602e-05 | CDC27/UPF1/KMT2E/USH1C/DBF4/PAF1/CRY1/SPAST/FHL1/USP28/ARID1B/RAD51/ATP2B4/SIRT2/ACTB/NDC80/PTPRC/ABCB1/ZW10/ANAPC5/BIRC5/PSME1/CDC6/MSH2/CDC7/BCL7C/SMARCB1/CDKN3/APEX1/CDC25B/CHMP4B/RBBP8/RAB11A/NBN/ERCC2/DOT1L/CCNE1/CASP2/EZH2/RPS6KB1/SMARCD2/CCL2/ZPR1/CCND1/BCL7A/FOXM1/FBXO5/MAPK14/CCND3/CCNG1/RAD50/PPP2CA/MACROH2A1/ID2/CDC20/ARID1A/PKD2/CCNI/PPP6C/MASTL/TEX14/INHBA/CDKN1A/HSPA2/FBXL12/PKMYT1/PSME3/CCNA1/MEN1/CCNB1/CCNH/CDCA8/APC/RDX/CENPE/NABP2/BRCA2/RB1/CUL4A/CYP1A1/APP/ENSA/DTL/DYRK3/INTS3/CALM2/CTDSP1/CCNA2/PLK2/EGFR/ITGB1/CACUL1/SPC25/ZFP36L2/ADAMTS1/XPC/EME1/LSM11/APPL1/CUL4B/CALM3/PRMT2/BRSK1/MRNIP/DBF4B/RPL26/GFI1/ERCC3/TERT/CDK5/BRD7/WEE1/RRM1/RFWD3/MN1/BUB1/AVEN/CDK1/PPM1D/TRIAP1/RHNO1/RRM2/KLF11/CKS1B/NABP1/ZWILCH/BRSK2/CTDSP2/CCNE2/AURKB/RCC2/PTPN11/MAPK15/NPM1/CACNB4/PLCB1/CEP63/CHEK2/FOXO4/CDK10/MUC1/PBX1/ZFP36L1/UBE2L3/H2AX/ARID2/KANK2/TFDP1/GIGYF2/PRKDC/PTPRC/SMARCB1/PAGR1/PTEN | 154 |
| GO:0030324 | lung development | 69/3662 | 180/15509 | 6.52057e-06 | 5.99622e-05 | 3.60602e-05 | ITGA3/FLT4/FGFR2/CDC42/GLI2/TP73/HSPB11/PGR/ADAMTS2/RBBP9/BAG6/LAMA1/HOXA5/AIMP2/BMPR1A/PDGFRB/NPHP3/WNT5A/HES1/EPAS1/ARG1/THRA/ELK1/KDR/LIF/ALDH1A2/FOXJ1/LAMA5/AP3B1/CHI3L1/SFTPD/KRAS/PDGFRA/SPRY2/NKX2-1/FGF2/CYP1A2/NOTCH1/THRB/NODAL/MMP14/SELENON/TGFBR2/SHH/NOS3/ABCA3/RBPJ/NKIRAS2/ZFPM2/DAG1/SMAD2/NOG/WNT7B/MME/NKIRAS1/BAG6/TNF/TNF/TNF/TNF/BAG6/TNF/TNF/BAG6/TNF/TNF/BAG6/BAG6/CEBPA | 69 |
| GO:0043409 | negative regulation of MAPK cascade | 61/3662 | 154/15509 | 6.5891e-06 | 6.05026e-05 | 3.63852e-05 | PAFAH1B1/HYAL2/RPS6KA6/FBLN1/PTPRC/MECOM/P2RX7/PEBP1/ABL1/BMP7/CSK/SFRP1/FKTN/AMBP/FOXM1/SH2B3/ASH1L/IL1B/BMP2/PRMT1/PIN1/LIF/APOE/EPHB2/MEN1/PTPN22/SPRY2/TLR4/SORL1/DUSP5/IGF1R/SMAD4/DUSP10/FOXO1/CNKSR3/UCHL1/DUSP2/ATF3/RNF149/PRKCD/DUSP7/GPER1/NDRG2/RGS14/EFNA1/DAG1/PTPN2/ADIPOQ/PRKN/NF2/LILRB4/C1QL4/SPRY4/PPIA/SPRED2/PTPRC/LILRB4/LILRB4/LILRB4/PTEN/ITCH | 61 |
| GO:0046636 | negative regulation of alpha-beta T cell activation | 25/3662 | 46/15509 | 6.59935e-06 | 6.0507e-05 | 3.63879e-05 | HFE/RUNX3/FOXP3/CBFB/TBX21/IL4R/ARG2/SMAD7/LILRB1/JAK3/IL4/BCL6/TWSG1/NDFIP1/HLX/RUNX1/SHH/LGALS9/SOCS1/HMGB1/LILRB1/LILRB1/LILRB1/LILRB1/ITCH | 25 |
| GO:0021782 | glial cell development | 47/3662 | 110/15509 | 6.98173e-06 | 6.39184e-05 | 3.84394e-05 | CNTN1/GRN/SIRT2/ARHGEF10/ERCC2/CNTNAP1/MDK/IFNG/EIF2B2/CLU/LRP1/SOX4/MYRF/IL1B/NKX2-2/NR1D1/WASF3/KRAS/TSPAN2/IL6/TLR4/SOD1/APP/NTRK2/PARD3/SKI/B4GALT5/MXRA8/SLC25A46/SHH/CDK5/LAMB2/DAG1/KCNJ10/PLEC/CNTN2/POU3F2/ROR1/TNF/TNF/TNF/TNF/TNF/TNF/TNF/TNF/PTEN | 47 |
| GO:0042104 | positive regulation of activated T cell proliferation | 17/3662 | 26/15509 | 7.0376e-06 | 6.43349e-05 | 3.86899e-05 | IGF1/IL12RB1/PYCARD/IL27RA/JAK3/IL12B/IGFBP2/GPAM/TNFSF9/EPO/IL2RA/IL18/ICOSLG/FADD/STAT5B/HMGB1/CD24 | 17 |
| GO:0045123 | cellular extravasation | 36/3662 | 77/15509 | 7.18123e-06 | 6.55512e-05 | 3.94214e-05 | ITGAL/SELE/ROCK1/ADD2/ICAM1/IL27RA/PIK3CG/CXCL12/CCL2/MDK/ITGA4/CCL21/ITGB1/VCAM1/FADD/CX3CR1/PTAFR/SELP/LEP/PLCB1/FUT4/PRTN3/CD47/ELANE/TNF/CD177/TNF/TNF/TNF/TNF/TNF/TNF/TNF/PECAM1/ELANE/PRTN3 | 36 |
| GO:0046849 | bone remodeling | 37/3662 | 80/15509 | 7.36388e-06 | 6.71196e-05 | 4.03645e-05 | WNT16/CD38/NOX4/P2RX7/RASSF2/ACP5/CSK/SFRP1/IL7/TGFB1/HAMP/PTN/MDK/CALCA/LEPR/TNFAIP3/SPP1/PTK2B/IAPP/NOTCH2/IL6/DEF8/TNFRSF11A/EPHA2/GJA1/PRKCA/TNFRSF11B/SYK/INPP5D/ADRB2/S1PR1/GPR137/LEP/CSF1R/SRC/ITGB3/INPP5D | 37 |
| GO:0071229 | cellular response to acid chemical | 38/3662 | 83/15509 | 7.49632e-06 | 6.82264e-05 | 4.10302e-05 | RRAGD/CYBA/IPO5/MMP2/XBP1/LAMTOR3/PKD2/DNMT3A/BCL2L2/ASS1/SESN2/DNMT1/PDGFRA/PDGFC/EGFR/NTRK2/ZEB1/SESN3/CAPN2/CYBB/NSMF/BCL2L1/CEBPB/SLC38A9/PLEC/SOCS1/LAMTOR4/COL4A6/MTOR/TNF/TNF/SIPA1/TNF/TNF/TNF/TNF/TNF/TNF | 38 |
| GO:0034614 | cellular response to reactive oxygen species | 53/3662 | 129/15509 | 7.542e-06 | 6.85415e-05 | 4.12197e-05 | MPO/BTK/HGF/GLRX2/MMP2/PXN/ABL1/APEX1/MMP9/BMP7/MET/EZH2/MAPK8/PPIF/PARK7/PRDX1/TNFAIP3/ARG1/FOXO3/PKD2/NR4A3/CAT/BECN1/TRAP1/PRKAA1/PDGFRA/CD36/IL6/IL10/IL18BP/CYP1B1/SOD1/RHOB/EGFR/FANCC/FABP1/PRKCD/NOS3/FXN/PRDX2/CDK1/FOS/RELA/JUN/ERN1/NQO1/AKR1C3/SRC/MAP3K5/ZNF277/ZNF580/CHUK/PCGF2 | 53 |
| GO:0007163 | establishment or maintenance of cell polarity | 79/3662 | 214/15509 | 7.67769e-06 | 6.96725e-05 | 4.18998e-05 | PAFAH1B1/ANK1/SDCCAG8/RHOA/ROCK1/CDC42/WDR1/MARK2/FBXW11/NDE1/LLGL2/ACTB/SPAG5/NDC80/DLG3/GSK3B/RAB10/ZW10/NSFL1C/HSP90AB1/ABL1/MYH9/FERMT1/LAMA1/PARD6A/RPGRIP1L/GATA3/CYTH1/LIN7A/CAP2/NPHP3/AMOTL2/WNT5A/HES1/SFRP5/TEK/PDZD11/PTK2B/CCR7/PLEKHG3/RAC2/FOXJ1/CAP1/FLOT2/SPRY2/CCL21/NUMA1/ACTR2/IGF1R/KIF2C/ABL2/SNX27/RHOB/MSN/GSN/PARD3/ITGB1/DST/GJA1/ARHGAP35/BRSK1/LMNA/ARPC5/RICTOR/SHH/TTC8/WEE1/RHOH/PTK2/PDCD6IP/CCL19/KAT5/BRSK2/WNT7B/PARVA/CCL4/CCL4/NDE1/CCL4 | 79 |
| GO:0043524 | negative regulation of neuron apoptotic process | 58/3662 | 145/15509 | 7.72578e-06 | 6.99697e-05 | 4.20785e-05 | GRN/HIPK2/ERBB3/MAP2K4/RHOA/ROCK1/BAX/KDM2B/AARS1/MSH2/HSP90AB1/ADNP/IL27RA/GPI/UNC5B/CCL2/ZPR1/CCND1/MDK/PARK7/PTK2B/CNTFR/KDR/APOE/KRAS/NGF/IL10/STXBP1/MAP3K12/ARRB2/SOD1/NONO/NTRK2/POU4F1/NR4A2/BTG2/TERT/FOXQ1/CX3CR1/SEMA3E/BCL2L1/CEBPB/LIG4/HRAS/BDNF/JUN/F2R/PRKN/CLN3/FZD9/SYNGAP1/NTRK1/GPRASP3/NAIP/NAIP/NEFL/NAIP/GPI | 58 |
| GO:0042987 | amyloid precursor protein catabolic process | 30/3662 | 60/15509 | 7.73301e-06 | 6.99697e-05 | 4.20785e-05 | IGF1/ROCK1/PICALM/FKBP1A/GSK3A/IFNG/CLU/PIN1/APOE/FLOT2/RTN3/ADAM19/SORL1/RTN1/PSEN2/NTRK2/SLC2A13/CASP3/EFNA1/RELA/CLN3/TNF/PSENEN/TNF/TNF/TNF/TNF/TNF/TNF/TNF | 30 |
| GO:0001774 | microglial cell activation | 26/3662 | 49/15509 | 7.76459e-06 | 7.00508e-05 | 4.21273e-05 | TYROBP/GRN/PTPRC/CTSC/IFNG/IL4/CLU/NR1D1/SYT11/IL6/APP/ITGB2/TLR3/CX3CR1/ITGAM/JUN/TRPV1/TNF/TNF/TNF/TNF/TNF/TNF/TNF/TNF/PTPRC | 26 |
| GO:0034205 | amyloid-beta formation | 26/3662 | 49/15509 | 7.76459e-06 | 7.00508e-05 | 4.21273e-05 | IGF1/ROCK1/PICALM/GSK3A/IFNG/CLU/PIN1/APOE/RTN3/SORL1/RTN1/PSEN2/NTRK2/SLC2A13/CASP3/EFNA1/RELA/TNF/PSENEN/TNF/TNF/TNF/TNF/TNF/TNF/TNF | 26 |
| GO:0018022 | peptidyl-lysine methylation | 52/3662 | 126/15509 | 7.85772e-06 | 7.0788e-05 | 4.25707e-05 | NFYA/KDM1A/KMT2E/ARID4B/KDM4A/NFYC/ATRX/DNMT3B/SMARCB1/SETD6/DOT1L/EZH2/GATA3/EZH1/NSD2/HCFC2/MACROH2A1/KDM3A/ASH1L/MYB/PHF19/EEF1AKMT3/H1-3/ASH2L/PRDM12/DNMT1/MEN1/SKIC8/SMAD4/BOD1/OGT/NSD3/LMNA/GFI1/PYGO2/NSD1/NNMT/SETD5/H1-4/HCFC1/TRMT112/SETD2/SETD3/KMT5A/TET3/H1-2/PAX5/WDR5/WDR5B/NCOA6/SMARCB1/PAGR1 | 52 |
| GO:0035107 | appendage morphogenesis | 57/3662 | 142/15509 | 8.12909e-06 | 7.29148e-05 | 4.38497e-05 | HOXA11/BAK1/ALX4/FGFR2/PITX1/TP63/PLXNA2/TULP3/HOXA9/ATRX/BAX/BMP7/RPGRIP1L/LMBR1/BMPR1A/FBXW4/DKK1/WNT3/ZBTB16/WNT5A/PRRX1/HDAC1/RECK/SOX4/RUNX2/HOXD9/ALDH1A2/NOTCH2/LRP4/TFAP2A/FBN2/COL2A1/RNF165/SMAD4/CRABP2/AFF3/GNA12/NOTCH1/FREM2/MBNL1/BCL2L11/SKI/SHH/RARG/NOG/PBX1/ZNF358/PBX2/PBX2/SP9/PBX2/PBX2/PBX2/PBX2/HOXA10/WNT3/WNT3 | 57 |
| GO:0035108 | limb morphogenesis | 57/3662 | 142/15509 | 8.12909e-06 | 7.29148e-05 | 4.38497e-05 | HOXA11/BAK1/ALX4/FGFR2/PITX1/TP63/PLXNA2/TULP3/HOXA9/ATRX/BAX/BMP7/RPGRIP1L/LMBR1/BMPR1A/FBXW4/DKK1/WNT3/ZBTB16/WNT5A/PRRX1/HDAC1/RECK/SOX4/RUNX2/HOXD9/ALDH1A2/NOTCH2/LRP4/TFAP2A/FBN2/COL2A1/RNF165/SMAD4/CRABP2/AFF3/GNA12/NOTCH1/FREM2/MBNL1/BCL2L11/SKI/SHH/RARG/NOG/PBX1/ZNF358/PBX2/PBX2/SP9/PBX2/PBX2/PBX2/PBX2/HOXA10/WNT3/WNT3 | 57 |
| GO:0051092 | positive regulation of NF-kappaB transcription factor activity | 57/3662 | 142/15509 | 8.12909e-06 | 7.29148e-05 | 4.38497e-05 | DHX33/BTK/LTF/EIF2AK2/TRAF1/MID2/ERC1/PSMA6/CD40/CD40LG/PYCARD/PRKD2/MTPN/NOD1/TRIM14/WNT5A/CLU/TRIM25/CAT/IL1B/RBCK1/EDA2R/TRIM5/TRIM22/FLOT2/CD36/TLR4/TNFRSF11A/APP/IL18/TLR3/NOD2/TRIM68/CX3CR1/LGALS9/ALK/TRIM8/RELA/NPM1/IRAK1/CIB1/ROR1/CARD9/IL1RAP/PPIA/NTRK1/TNF/TRIM13/TNF/CHUK/TNF/TNF/TNF/TNF/TNF/TNF/IKBKG | 57 |
| GO:0071675 | regulation of mononuclear cell migration | 51/3662 | 123/15509 | 8.17185e-06 | 7.31923e-05 | 4.40166e-05 | SPI1/RHOA/ABL1/PYCARD/IL27RA/SERPINE1/CREB3/CXCL12/C1QBP/CCL2/MDK/NEDD9/IL4/WNT5A/CCL20/ITGA4/PADI2/PTK2B/CCR7/CCN3/CCL21/THBS1/APP/ABL2/SLIT2/MSN/CXCL13/FADD/CX3CR1/LGALS9/PTK2/CALR/CSF1R/PLCB1/CSF1/HMGB1/CD47/TNF/TNF/TNF/TNF/TNF/TNF/TNF/TNF/ITGB3/CCL5/CCL5/CCL4/CCL4/CCL4 | 51 |
| GO:0042698 | ovulation cycle | 31/3662 | 63/15509 | 8.35577e-06 | 7.47317e-05 | 4.49423e-05 | HSPA5/PGR/OPRK1/MMP2/ESR1/ADNP/PTN/CASP2/MAP2K6/MDK/FOXO3/EGR1/INHBA/PDGFRA/CYP1B1/IGF1R/ARRB2/SLIT2/GAS2/ADAMTS1/CASP3/GDF9/NOS3/STAT5B/LEP/FZD4/A2M/OXTR/SLIT3/ZP3/SRC | 31 |
| GO:0030326 | embryonic limb morphogenesis | 50/3662 | 120/15509 | 8.48204e-06 | 7.56427e-05 | 4.54902e-05 | HOXA11/ALX4/PITX1/TP63/TULP3/HOXA9/BAX/BMP7/RPGRIP1L/LMBR1/BMPR1A/FBXW4/DKK1/WNT3/ZBTB16/WNT5A/PRRX1/HDAC1/RECK/RUNX2/HOXD9/ALDH1A2/NOTCH2/LRP4/TFAP2A/FBN2/SMAD4/CRABP2/AFF3/GNA12/NOTCH1/FREM2/MBNL1/BCL2L11/SKI/SHH/RARG/NOG/PBX1/ZNF358/PBX2/PBX2/SP9/PBX2/PBX2/PBX2/PBX2/HOXA10/WNT3/WNT3 | 50 |
| GO:0035113 | embryonic appendage morphogenesis | 50/3662 | 120/15509 | 8.48204e-06 | 7.56427e-05 | 4.54902e-05 | HOXA11/ALX4/PITX1/TP63/TULP3/HOXA9/BAX/BMP7/RPGRIP1L/LMBR1/BMPR1A/FBXW4/DKK1/WNT3/ZBTB16/WNT5A/PRRX1/HDAC1/RECK/RUNX2/HOXD9/ALDH1A2/NOTCH2/LRP4/TFAP2A/FBN2/SMAD4/CRABP2/AFF3/GNA12/NOTCH1/FREM2/MBNL1/BCL2L11/SKI/SHH/RARG/NOG/PBX1/ZNF358/PBX2/PBX2/SP9/PBX2/PBX2/PBX2/PBX2/HOXA10/WNT3/WNT3 | 50 |
| GO:0030856 | regulation of epithelial cell differentiation | 56/3662 | 139/15509 | 8.54325e-06 | 7.60791e-05 | 4.57526e-05 | BAD/PROM1/ROCK1/TP63/TP73/ADD1/MMP9/BMP7/ESRP1/SERPINE1/EZH2/SFRP4/GATA3/CCND1/CYP27B1/VDR/IFNG/MACROH2A1/HES1/IL1A/STAT1/IL1B/NKX2-2/BMP2/ID1/ZFP36/LIF/FOXJ1/BTG1/KRAS/AHI1/SPRY2/NUMA1/FGF2/NOTCH1/ZEB1/BMP6/NODAL/FRZB/AQP3/CEBPB/STAT5B/ZDHHC21/PLCB1/ZFP36L1/MAFG/SPRED2/TNF/TNF/TNF/TNF/TNF/TNF/TNF/TNF/CD24 | 56 |
| GO:0031641 | regulation of myelination | 27/3662 | 52/15509 | 8.89035e-06 | 7.88474e-05 | 4.74174e-05 | TMEM98/HGF/TNFRSF1B/SIRT2/PTN/CTSC/ZPR1/EGR2/MYRF/RARA/WASF3/ITGAX/TNFRSF21/PARD3/EIF2AK3/RARG/DAG1/MTOR/TNF/TNF/TNF/TNF/TNF/TNF/TNF/TNF/PTEN | 27 |
| GO:0036230 | granulocyte activation | 27/3662 | 52/15509 | 8.89035e-06 | 7.88474e-05 | 4.74174e-05 | KMT2E/TYROBP/GRN/KARS1/SPI1/FCGR2B/STXBP2/CTSG/IL18/ITGB2/PRKCD/SYK/PTAFR/CXCL8/ITGAM/CXCR2/TNF/CD177/TNF/TNF/TNF/TNF/TNF/TNF/TNF/CCL5/CCL5 | 27 |
| GO:0034113 | heterotypic cell-cell adhesion | 32/3662 | 66/15509 | 8.90499e-06 | 7.88474e-05 | 4.74174e-05 | CD44/PKP2/PTPRC/CEACAM6/DSP/BMP7/PERP/ITGA4/IL1B/IL10/IL1RN/ITGAV/ITGAX/ITGB1/ITGB2/VCAM1/FGG/FGA/ADIPOQ/CD47/PARVA/MBP/TNF/TNF/TNF/TNF/TNF/TNF/TNF/TNF/ITGB3/PTPRC | 32 |
| GO:1901224 | positive regulation of NIK/NF-kappaB signaling | 32/3662 | 66/15509 | 8.90499e-06 | 7.88474e-05 | 4.74174e-05 | EIF2AK2/RHOA/NFAT5/NOD1/IL12B/CD86/IL1B/RBCK1/TLR4/APP/EGFR/IL18/TLR3/TRIM44/NOD2/LGALS9/LIMS1/CD14/CCL19/RELA/CALR/IRAK1/PTP4A3/TLR7/TNF/TNF/TNF/TNF/TNF/TNF/TNF/TNF | 32 |
| GO:0061042 | vascular wound healing | 16/3662 | 24/15509 | 9.10654e-06 | 8.05169e-05 | 4.84215e-05 | ADIPOR2/MCAM/XBP1/SERPINE1/SMOC2/TNFAIP3/CXCR4/KDR/TNF/TNF/TNF/TNF/TNF/TNF/TNF/TNF | 16 |
| GO:0009266 | response to temperature stimulus | 70/3662 | 185/15509 | 9.46079e-06 | 8.35299e-05 | 5.02334e-05 | IGF1/GLRX2/NGFR/ATXN3/PRKACA/ACADVL/GSK3B/HSP90AB1/CIRBP/NFKBIA/RBBP7/DNAJB6/HSPB1/CXCL12/RPS6KB1/CRYAB/CHORDC1/CALCA/IL1A/EIF2B2/CXCR4/THRA/HSPA2/PRDM12/PRKAA1/THBS1/ARRB2/SOD1/PKLR/POLR2D/STAC/FOXO1/BAG3/SLC25A27/NR2F6/CLPB/IER5/MAPKAPK2/NOS3/TP53INP1/VCP/ADRB2/FOS/CD14/EIF2AK3/LPL/MICA/IRAK1/TRPV1/NTRK1/MTOR/DAXX/DAXX/MICB/MICB/HSBP1L1/DAXX/MICB/DAXX/MICB/MICA/MICB/DAXX/MICA/MICA/MICB/PDCD6/PKLR/CHORDC1/PRKACA | 70 |
| GO:0014909 | smooth muscle cell migration | 34/3662 | 72/15509 | 9.7702e-06 | 8.61389e-05 | 5.18025e-05 | IGF1/RHOA/PDGFB/APEX1/NDRG4/PLAT/SERPINE1/BMPR1A/RPS6KB1/MDK/PPARD/PDGFRB/NR4A3/GNA13/LRP1/TLR4/CCN3/SORL1/CYP1B1/SLIT2/GNA12/IGFBP3/ADAMTS1/ARPC5/S100A11/TERT/DDIT3/ADIPOQ/FOXO4/SRC/PARVA/ITGB3/CCL5/CCL5 | 34 |
| GO:0061900 | glial cell activation | 28/3662 | 55/15509 | 9.95013e-06 | 8.76007e-05 | 5.26815e-05 | TYROBP/GRN/PTPRC/CTSC/IFNG/IL4/CLU/LRP1/IL1B/NR1D1/SYT11/IL6/APP/ITGB2/TLR3/CX3CR1/ITGAM/JUN/TRPV1/TNF/TNF/TNF/TNF/TNF/TNF/TNF/TNF/PTPRC | 28 |
| GO:0002064 | epithelial cell development | 75/3662 | 202/15509 | 1.01952e-05 | 8.96309e-05 | 5.39025e-05 | BAD/FOXP3/ARID4B/PRDM1/ROCK1/TP63/FOSL2/PGR/GSK3B/ATRX/ADD1/ICAM1/ESR1/PDGFB/PPP1R16B/GATA1/TJP1/GSK3A/MET/HOXA5/RAPGEF1/ACTA2/WNT5B/PDE4D/WNT5A/IL1A/SDC1/EPAS1/CXCR4/IL1B/NKX2-2/BCL11B/KDR/PODXL/FOXJ1/RARA/HSD17B4/NOTCH2/EDNRB/CCM2/RDX/ABI2/EPHA2/RAB13/MSN/NOTCH1/BMP6/STC1/FRZB/FRS2/CDH2/LAMB2/RARG/ZDHHC21/TYMS/PLEC/ADIPOQ/YIPF6/PLCB1/COL18A1/MAGI2/WNT7B/SRC/NTRK1/TNF/TNF/TNF/TNF/TNF/TNF/TNF/TNF/CEBPA/PECAM1/TJP1 | 75 |
| GO:0033627 | cell adhesion mediated by integrin | 37/3662 | 81/15509 | 1.04941e-05 | 9.21278e-05 | 5.5404e-05 | ITGAL/ITGA3/ITGA2B/SNAI2/EPHA8/ITGA8/ICAM1/FERMT1/PIEZO1/PIK3CG/SERPINE1/LPXN/ITGA4/LIF/PODXL/CCN3/CCL21/ITGA11/CYP1B1/ITGAV/ITGAX/EPHA2/ITGB1/CXCL13/ITGB2/SYK/ADAM9/EFNA1/PTK2/ITGAM/PTPN11/CIB1/MUC1/DPP4/ITGB3/CCL5/CCL5 | 37 |
| GO:0001938 | positive regulation of endothelial cell proliferation | 41/3662 | 93/15509 | 1.05469e-05 | 9.24607e-05 | 5.56043e-05 | FLT4/CYBA/SIRT6/FGFR1/PDGFB/PPP1R16B/PRKD2/TGFBR1/CXCL12/MDK/WNT5A/ITGA4/PDCL3/NRP2/ARG1/PGF/TEK/NR4A1/BMP2/STAT5A/KDR/IL10/FGF2/EGF/ARNT/VEGFC/BMP6/PRKCA/EMC10/AGGF1/SCG2/CCL11/EGFL7/JUN/HMGB1/NRARP/ZNF580/NRAS/PDCD6/ITGB3/AKT3 | 41 |
| GO:0046629 | gamma-delta T cell activation | 22/3662 | 39/15509 | 1.05956e-05 | 9.26253e-05 | 5.57032e-05 | PTPRC/LILRB1/SOX4/SYK/NOD2/CCR9/STAT5B/MICA/MICB/MICB/MICB/MICB/MICA/MICB/MICA/MICA/MICB/PTPRC/LILRB1/LILRB1/LILRB1/LILRB1 | 22 |
| GO:0150077 | regulation of neuroinflammatory response | 22/3662 | 39/15509 | 1.05956e-05 | 9.26253e-05 | 5.57032e-05 | IGF1/TNFRSF1B/GRN/PTPRC/MMP9/CTSC/IL4/IL1B/NR1D1/SYT11/DAGLA/IL6/IL18/TNF/TNF/TNF/TNF/TNF/TNF/TNF/TNF/PTPRC | 22 |
| GO:0050871 | positive regulation of B cell activation | 40/3662 | 90/15509 | 1.0616e-05 | 9.26729e-05 | 5.57319e-05 | BAD/CD38/BTK/CD74/TBX21/MLH1/PTPRC/MSH2/XBP1/CD40/NFATC2/IL7/TGFB1/EXOSC3/NSD2/CD81/IL4/IL5/BCL6/SHLD2/CDKN1A/EPHB2/AKIRIN2/IL6/IL10/TLR4/IL21/IL2RG/MMP14/TNFRSF13C/TNFSF13/SYK/NOD2/TNIP2/INPP5D/STAT5B/CD28/PTPRC/MIF/INPP5D | 40 |
| GO:0033135 | regulation of peptidyl-serine phosphorylation | 51/3662 | 124/15509 | 1.07268e-05 | 9.35086e-05 | 5.62345e-05 | HGF/CD44/BAK1/FNIP2/ATP2B4/BAX/HSP90AB1/OSM/TCL1A/RASSF2/SMAD7/AXIN1/PRKD2/TGFB1/GSK3A/DKK1/CSF3/IFNG/PDE4D/WNT5A/PARK7/GADD45A/LIF/PRKAA1/NGF/SPRY2/IL6/ARRB2/APP/CNOT9/EGFR/NTRK2/CNKSR3/DMTN/SPTBN4/RICTOR/NSD1/DDIT4/BDNF/INPP5J/IFNA1/TNF/TNF/TNF/TNF/TNF/TNF/TNF/TNF/MIF/PTEN | 51 |
| GO:0031334 | positive regulation of protein-containing complex assembly | 68/3662 | 179/15509 | 1.07997e-05 | 9.40121e-05 | 5.65372e-05 | DHX33/BAK1/FNIP2/RHOA/NAV3/GSK3B/BAX/ESR1/SH3GLB1/PSMC6/TCL1A/FERMT1/HCK/PIEZO1/PYCARD/MED25/TGFB1/MET/CSF3/IFNG/IL5/PARK7/SLF2/CLU/PTK2B/CCR7/CDC42EP1/AJUBA/PSRC1/HRK/CD36/LCP1/TLR4/CCL21/ATAT1/NUMA1/SLAIN1/WARS1/MSN/CDC42EP2/BCL2L11/GBP5/CXCL13/ALOX15/TAL1/CDC42EP3/RICTOR/CSF2/SYK/VCP/ABCA3/PRKCE/CCL11/CDK5R1/GRB2/DRG1/MMP1/SRC/MTOR/TNF/TNF/TNF/TNF/TNF/TNF/TNF/TNF/BRK1 | 68 |
| GO:0032515 | negative regulation of phosphoprotein phosphatase activity | 18/3662 | 29/15509 | 1.10307e-05 | 9.56883e-05 | 5.75453e-05 | ROCK1/GSK3B/PPP1R15A/FKBP1A/PTPA/MASTL/CRY2/STYXL1/BOD1/TNF/PPP1R11/TNF/TNF/TNF/TNF/TNF/TNF/TNF | 18 |
| GO:0051043 | regulation of membrane protein ectodomain proteolysis | 18/3662 | 29/15509 | 1.10307e-05 | 9.56883e-05 | 5.75453e-05 | TNFRSF1B/ROCK1/SH3D19/IFNG/IL1B/APOE/IL10/FURIN/ADAM9/RGMA/TNF/TNF/TNF/TNF/TNF/TNF/TNF/TNF | 18 |
| GO:0051091 | positive regulation of DNA-binding transcription factor activity | 87/3662 | 243/15509 | 1.10386e-05 | 9.56883e-05 | 5.75453e-05 | KDM1A/DHX33/BTK/MBTPS2/LTF/EIF2AK2/TRAF1/HIPK2/TCF3/MID2/ERC1/MAVS/ESR1/SMARCB1/PSMA6/CD40/CD40LG/PYCARD/PRKD2/MTPN/NOD1/TRIM14/CSF3/IL5/WNT5A/PARK7/CLU/TRIM25/CAT/IL1B/RBCK1/BMP2/EDA2R/TRIM5/TRIM22/FLOT2/BEX1/CD36/IL6/IL10/TLR4/TNFRSF11A/APP/EPHA5/PPRC1/ARID5B/IL18/NODAL/KIT/TLR3/SHH/ADCY1/NOD2/TRIM68/CX3CR1/LGALS9/ALK/TRIM8/RELA/FZD4/DDIT3/FOSL1/NPM1/IRAK1/CIB1/ROR1/RNF220/CARD9/IL1RAP/PPIA/TFDP1/NTRK1/TNF/TRIM13/TNF/CHUK/TNF/TNF/TNF/TNF/TNF/TNF/TRIM26/IKBKG/SMARCB1/LRP6/PTEN | 87 |
| GO:0035308 | negative regulation of protein dephosphorylation | 20/3662 | 34/15509 | 1.13549e-05 | 9.82929e-05 | 5.91116e-05 | ROCK1/GSK3B/PPP1R15A/FKBP1A/PPP1R16B/PTPA/MASTL/CRY2/STYXL1/ENSA/BOD1/TNF/PPP1R11/TNF/TNF/TNF/TNF/TNF/TNF/TNF | 20 |
| GO:0034116 | positive regulation of heterotypic cell-cell adhesion | 15/3662 | 22/15509 | 1.1594e-05 | 0.000100108 | 6.02034e-05 | CD44/CEACAM6/BMP7/IL1B/IL10/FGG/FGA/TNF/TNF/TNF/TNF/TNF/TNF/TNF/TNF | 15 |
| GO:0000018 | regulation of DNA recombination | 49/3662 | 118/15509 | 1.16131e-05 | 0.000100108 | 6.02034e-05 | KDM1A/PARP3/FOXP3/RAD51/TBX21/ACTB/MLH1/SIRT6/PTPRC/FUS/MSH2/CD40/RBBP8/ERCC2/IL27RA/TGFB1/EXOSC3/RECQL5/NSD2/IL4/RAD50/BCL6/KPNA1/SHLD2/MORF4L2/H1-3/YEATS4/NDFIP1/EPC2/IL10/ACTR2/SLC15A4/PARP1/RADX/PPP4C/MRNIP/TNFSF13/H1-4/KAT5/RMI2/MAGEF1/CD28/SETD2/H1-2/H1-0/ARID2/TRRAP/RTEL1/PTPRC | 49 |
| GO:0051101 | regulation of DNA binding | 49/3662 | 118/15509 | 1.16131e-05 | 0.000100108 | 6.02034e-05 | KDM1A/IGF1/HIPK2/SP100/SIRT2/ZMPSTE24/NFKBIA/MMP9/GATA1/ERCC2/DOT1L/TGFB1/EDF1/GATA3/MAPK8/IFNG/HES1/PARK7/ID1/LIF/PER2/NGF/IRF4/EGF/RB1/PARP1/CALM2/HMGA2/POU4F2/POU4F1/SKI/CALM3/NSD1/DDIT3/JUN/CTNNBIP1/SUMO3/PRKN/RNF220/H1-0/HMGB1/CSNK2B/TMSB4X/CPNE1/CSNK2B/CSNK2B/CSNK2B/CSNK2B/NME1 | 49 |
| GO:0006879 | cellular iron ion homeostasis | 30/3662 | 61/15509 | 1.17968e-05 | 0.00010127 | 6.09019e-05 | HFE/SLC11A1/ATP6AP1/SLC46A1/FTL/SLC22A17/NUBP1/SLC39A14/HAMP/TFR2/HPX/SLC11A2/IFNG/ATP6V1A/NDFIP1/ISCU/IREB2/ATP6V1G1/SMAD4/SOD1/LCN2/BMP6/STEAP2/ALAS2/CYB561A3/FXN/FTH1/ERFE/TMPRSS6/TMEM199 | 30 |
| GO:0042093 | T-helper cell differentiation | 30/3662 | 61/15509 | 1.17968e-05 | 0.00010127 | 6.09019e-05 | TMEM98/FOXP3/TBX21/IL4R/IL12RB1/SMAD7/JAK3/GATA3/IL12B/IL4/BCL6/CD86/MYB/CD80/RARA/IL6/HLX/IRF4/IL21/IL18/IL6R/CCL19/HMGB1/ENTPD7/MTOR/HLA-DRA/HLA-DRA/HLA-DRA/HLA-DRA/HLA-DRA | 30 |
| GO:0051310 | metaphase plate congression | 30/3662 | 61/15509 | 1.17968e-05 | 0.00010127 | 6.09019e-05 | CENPQ/MLH1/SPAG5/NDC80/PIBF1/SEH1L/CHMP5/ZW10/BIRC5/NUDC/CHMP4B/RAB11A/KAT2B/TTL/BECN1/CHMP1A/CCNB1/PSRC1/CDCA8/NUMA1/CENPE/KIF2C/CENPC/BOD1/GEM/KAT5/CHMP6/AURKB/KIFC1/SPICE1 | 30 |
| GO:2001238 | positive regulation of extrinsic apoptotic signaling pathway | 26/3662 | 50/15509 | 1.25556e-05 | 0.000107527 | 6.46648e-05 | HYAL2/PTPRC/SRPX/PYCARD/SFRP1/TNFSF10/INHBA/RBCK1/ITM2C/THBS1/PMAIP1/PEA15/ATF3/GPER1/FADD/PAK2/TNF/TNF/TNF/TNF/TNF/TNF/TNF/TNF/PTPRC/PTEN | 26 |
| GO:0030888 | regulation of B cell proliferation | 31/3662 | 64/15509 | 1.25604e-05 | 0.000107527 | 6.46648e-05 | CD38/BTK/TYROBP/CD22/CD74/FCGR2B/PTPRC/CD40/NFATC2/IL7/AHR/CD81/IL4/IL5/BCL6/PKN1/CDKN1A/EPHB2/IL10/TLR4/IL21/TNFRSF21/TNFRSF13C/CTLA4/CASP3/INPP5D/TNFRSF13B/PTPRC/MIF/INPP5D/PTEN | 31 |
| GO:0043281 | regulation of cysteine-type endopeptidase activity involved in apoptotic process | 71/3662 | 190/15509 | 1.34799e-05 | 0.000115239 | 6.93029e-05 | BAD/CASP10/HGF/BIRC3/FAS/CD44/BAK1/NGFR/RHOA/TP63/BAX/BIRC5/MMP9/BIRC7/PYCARD/PDCD5/GPI/DNAJB6/NOD1/CASP2/CRYAB/HSPE1/PARK7/FASLG/TNFSF10/NR4A1/MICAL1/ANP32B/MTCH1/THBS1/BCL2L10/ARRB2/PMAIP1/CCN1/ARL6IP5/GSN/BCL2L11/NODAL/FABP1/GPER1/INTS1/SYK/VCP/RAG1/LGALS9/MGMT/SERPINB9/TRIAP1/EIF2AK3/PAK2/F2R/CARD9/HMGB1/DAPK1/SRC/MAP3K5/TNF/TNF/FIS1/MAGEA3/TNF/TNF/TNF/TNF/TNF/TNF/NAIP/PDCD6/NAIP/NAIP/GPI | 71 |
| GO:0016055 | Wnt signaling pathway | 135/3662 | 413/15509 | 1.35001e-05 | 0.000115253 | 6.93112e-05 | WNT16/ITGA3/PAF1/SNAI2/PTPRU/CDH3/FGFR2/RHOA/VPS35/CSNK2A2/CDC42/MARK2/FBXW11/GPC4/GSK3B/ABL1/GSKIP/CHD8/FERMT1/AXIN1/TSC2/SFRP1/TLE5/CCNE1/TGFB1/GSK3A/HBP1/SFRP4/SPIN1/DVL1/GATA3/FBXW4/DKK1/RNF43/WNT3/CCND1/FOLR1/MDK/WNT5B/FZD10/MAPK14/PPP2CA/ARL6/NPHP3/AMOTL2/KPNA1/WNT5A/IGFBP2/SDC1/BCL9/HDAC1/TNFAIP3/FOXO3/PKD2/SFRP5/EGR1/RECK/PFDN5/LRP1/SOX4/BMP2/PIN1/APOE/PRKAA1/LRP4/APC/MDFIC/EDNRB/PPM1B/FGF2/EGF/SKIC8/CSNK1D/APP/CELSR2/RBMS3/TPBG/EGFR/NOTCH1/TCF7L2/FOXO1/HHEX/NR4A2/GNAQ/WIF1/SKI/DVL3/WNT4/VANGL2/DISC1/FRZB/PYGO2/TERT/SHH/VCP/AMER2/NDRG2/BRD7/BTRC/NXN/RBPJ/ZEB2/CTNND2/CDH2/RARG/RNF213/FZD4/DDIT3/FOXL1/CTNNBIP1/NKX2-5/NOG/ZNF703/NOTUM/PRKN/ROR1/BCL9L/RNF220/MAGI2/WNT7B/FZD9/SRC/GRK6/NRARP/GRK5/CSNK2B/CSNK2B/CSNK2B/CSNK2B/CSNK2B/CD24/WNT3/WNT3/LRP6/PTEN | 135 |
| GO:0050810 | regulation of steroid biosynthetic process | 33/3662 | 70/15509 | 1.37444e-05 | 0.000117177 | 7.04682e-05 | MBTPS2/SNAI2/H6PD/DDX20/APOB/ASAH1/CYP27B1/IFNG/PDE8B/IL1A/EGR1/BMP2/NR1D1/APOE/PRKAA1/IGF1R/ARMC5/SOD1/ERLIN2/BMP6/WNT4/GFI1/ATP1A1/LEP/AKR1C3/TNF/TNF/TNF/TNF/TNF/TNF/TNF/TNF | 33 |
| GO:0045834 | positive regulation of lipid metabolic process | 56/3662 | 141/15509 | 1.40943e-05 | 0.000119995 | 7.21628e-05 | CD74/FGFR3/CDC42/EPHA8/PDGFB/EEF1A2/FLT1/TGFB1/CD81/IFNG/PPARD/PDGFRB/IL1A/NR4A3/TEK/PTK2B/FLT3/RAB38/ACSL3/IL1B/CCR7/NR1D1/ATG14/APOE/PRKAA1/PDGFRA/CCL21/FGF2/IGF1R/CCN1/BMP6/KIT/LDLRAP1/WNT4/CAPN2/FABP1/PRKCD/NOD2/PTK2/PRKCE/CCL19/KAT5/CD19/F2/ADIPOQ/KLHL25/SRC/MTOR/TNF/TNF/TNF/TNF/TNF/TNF/TNF/TNF | 56 |
| GO:0032732 | positive regulation of interleukin-1 production | 34/3662 | 73/15509 | 1.4166e-05 | 0.00012044 | 7.24305e-05 | TYROBP/P2RX7/TLR8/MEFV/PYCARD/NOD1/HSPB1/IFNG/IL17A/WNT5A/EGR1/CD36/IL6/TLR4/APP/GBP5/NOD2/LGALS9/IL16/CCL19/LPL/HMGB1/TNF/TNF/TNF/TNF/TNF/TNF/ORM1/TNF/TNF/NAIP/NAIP/NAIP | 34 |
| GO:0009755 | hormone-mediated signaling pathway | 70/3662 | 187/15509 | 1.44437e-05 | 0.000122263 | 7.35267e-05 | KDM1A/ADIPOR2/CRY1/RNF14/UFL1/PLPP1/RHOA/TP63/PIAS2/PGR/ESR1/RBFOX2/BMP7/SFRP1/ZMIZ1/DDX5/GTF2H1/PPARD/KDM3A/PARK7/HDAC1/NR5A2/PADI2/ARID1A/NR4A3/CRHR1/CRY2/PKN1/CNOT1/THRA/NR1D1/YWHAH/RARA/WBP2/CARM1/PARP1/REN/CNOT9/THRB/POU4F2/NODAL/APPL1/ADIPOR1/PRMT2/HEYL/GPER1/TRIM68/PAQR8/TADA3/CYP7B1/RARG/ESRRA/TAF7/CALR/PTPN11/SSTR2/SRC/KANK2/RXRB/CSNK2B/DAXX/DAXX/CSNK2B/CSNK2B/DAXX/CSNK2B/DAXX/DAXX/CSNK2B/PAGR1 | 70 |
| GO:0042362 | fat-soluble vitamin biosynthetic process | 14/3662 | 20/15509 | 1.44462e-05 | 0.000122263 | 7.35267e-05 | SNAI2/CYP27B1/IFNG/UBIAD1/CYP3A4/GFI1/TNF/TNF/TNF/TNF/TNF/TNF/TNF/TNF | 14 |
| GO:0031589 | cell-substrate adhesion | 111/3662 | 328/15509 | 1.44585e-05 | 0.000122263 | 7.35267e-05 | ITGAL/ITGA3/ITGA2B/CD44/EPHA3/PKP2/ATXN3/RHOA/ROCK1/CDC42/ST6GAL1/ACTN2/FBLN1/ITGA8/GSK3B/CEACAM6/NID2/PXN/ANGPT2/ABL1/PDGFB/FERMT1/OLFM4/MSLN/SFRP1/SERPINE1/ATRNL1/C1QBP/LPXN/MDK/VWF/CORO1C/NEDD9/PPARD/BVES/BCL6/ITGA4/FN1/TEK/PTK2B/ID1/CCR7/RRAS/KDR/RAC2/HOXD3/AJUBA/LAMA5/PPFIA1/TIMM10B/MEN1/CD36/LAMC1/CCL21/TMEM8B/THBS1/ITGA11/SMAD6/ITGAV/ITGAX/TBCD/CCN1/PIK3R1/NOTCH1/ITGB1/BCL2L11/MERTK/CD96/ABI3BP/MMP14/DMTN/ITGB2/ADAMTS13/COL26A1/ALOX15/WNT4/VCAM1/SNED1/DISC1/MELTF/EDIL3/EGFLAM/CDK5/ADAM9/EFNA1/PTK2/PLEKHA2/ANTXR1/LIMS1/ITGAM/SEMA3E/PRKCE/FGG/FGA/LAMB2/DAG1/FZD4/RCC2/CALR/EPHB3/CSF1/CIB1/NF2/BCAM/SPRY4/SRC/COL13A1/PARVA/ITGB3/ADAMTS13/PTEN | 111 |
| GO:0071230 | cellular response to amino acid stimulus | 35/3662 | 76/15509 | 1.4479e-05 | 0.000122263 | 7.35267e-05 | RRAGD/CYBA/IPO5/MMP2/XBP1/LAMTOR3/DNMT3A/BCL2L2/ASS1/SESN2/DNMT1/PDGFRA/PDGFC/EGFR/NTRK2/ZEB1/SESN3/CAPN2/CYBB/NSMF/BCL2L1/CEBPB/SLC38A9/SOCS1/LAMTOR4/COL4A6/MTOR/TNF/TNF/TNF/TNF/TNF/TNF/TNF/TNF | 35 |
| GO:1900182 | positive regulation of protein localization to nucleus | 35/3662 | 76/15509 | 1.4479e-05 | 0.000122263 | 7.35267e-05 | CDH1/NGFR/IPO5/HYAL2/MAVS/HSP90AB1/TGFB1/ZPR1/IFNG/MAPK14/PARK7/TARDBP/LIF/SESN2/DKC1/CCT7/PARP1/PIK3R1/BAG3/PRKCD/TERT/SHH/CCT2/CHP2/NMD3/CDK1/TRIM8/ORMDL3/EIF2AK3/LEP/LARP7/F2/NPM1/CACNB4/SRC | 35 |
| GO:0019932 | second-messenger-mediated signaling | 101/3662 | 293/15509 | 1.46378e-05 | 0.000123436 | 7.42321e-05 | SELE/CD4/BTK/PTBP1/CD22/IGF1/ATP2B4/ERBB3/INPP5A/PRKACA/PTPRC/GSK3B/P2RX5/ZMPSTE24/LAT2/P2RX7/RASD2/NFATC2/ADNP/MGRN1/NFAT5/AHR/PPP3CB/CAP2/PDE4D/PPP2CA/CCL20/ZAP70/FHL2/NR5A2/RCAN3/PTK2B/CXCR4/CCR7/DYRK2/KDR/TNNI3/APOE/CAP1/PRKAA1/CD36/EDNRB/THBS1/PLCE1/CALM2/EPHA5/ANK2/EGFR/GSTO1/ITPR1/DDAH1/GPR61/SPPL3/DMTN/CALM3/PDE9A/CXCR5/CCR5/VCAM1/CXCR1/ADCY1/NOS3/SYK/CHP2/CX3CR1/CXCL8/HINT1/PDE7B/KSR2/EIF2AK3/RCAN2/PDE3A/CCR9/SELP/ATP2A2/GRIN1/CXCR2/MAFA/SLC8A1/CCR4/CIB1/CXCR3/P2RX2/MTOR/TNF/TNF/STIMATE/FIS1/TNF/TNF/TNF/TNF/TNF/TNF/P2RY11/PTPRC/LOC102724560/CCL4/CCL4/CCL4/PRKACA | 101 |
| GO:0048708 | astrocyte differentiation | 36/3662 | 79/15509 | 1.46895e-05 | 0.000123703 | 7.43928e-05 | GRN/KDM4A/ABL1/IFNG/HES1/ID2/LRP1/IL1B/NKX2-2/BMP2/NR1D1/LIF/KRAS/TSPAN2/SERPINE2/IL6/TLR4/APP/NOTCH1/CUL4B/SHH/LAMB2/PTPN11/F2/NOG/CNTN2/POU3F2/ROR1/TNF/TNF/TNF/TNF/TNF/TNF/TNF/TNF | 36 |
| GO:1905898 | positive regulation of response to endoplasmic reticulum stress | 21/3662 | 37/15509 | 1.47883e-05 | 0.000124366 | 7.47918e-05 | BAK1/HERPUD1/ATXN3/FCGR2B/BAX/BAG6/XBP1/SGTA/TMEM33/SERINC3/PMAIP1/PIK3R1/BCL2L11/DDIT3/PTPN2/ERN1/BAG6/BAG6/BAG6/BAG6/BAG6 | 21 |
| GO:2000116 | regulation of cysteine-type endopeptidase activity | 78/3662 | 214/15509 | 1.48741e-05 | 0.000124919 | 7.51239e-05 | BAD/CASP10/LTF/HGF/BIRC3/FAS/CD44/BAK1/CYFIP2/NGFR/RHOA/TP63/BAX/BIRC5/MMP9/BIRC7/MEFV/PYCARD/PDCD5/GPI/DNAJB6/NOD1/CASP2/CRYAB/PERP/HSPE1/PARK7/FASLG/TNFSF10/NR4A1/MICAL1/ANP32B/MTCH1/THBS1/BCL2L10/ARRB2/PMAIP1/CCN1/ARL6IP5/GSN/BCL2L11/CAST/NODAL/FABP1/GPER1/INTS1/SYK/VCP/RAG1/FADD/LGALS9/MGMT/SERPINB9/TRIAP1/EIF2AK3/GRIN1/PAK2/F2R/CARD9/HMGB1/DAPK1/SRC/MAP3K5/TNF/TNF/FIS1/MAGEA3/TNF/TNF/TNF/TNF/TNF/TNF/NAIP/PDCD6/NAIP/NAIP/GPI | 78 |
| GO:0031330 | negative regulation of cellular catabolic process | 75/3662 | 204/15509 | 1.52257e-05 | 0.000127698 | 7.67952e-05 | HFE/SLC11A1/HGF/CLEC16A/PHF23/ATP2B4/HIPK2/CTSA/ELAVL1/KDM4A/ROCK1/SIRT2/CSNK2A2/FUS/HNRNPC/BAG6/HSP90AB1/CIRBP/CHMP4B/USP14/N4BP1/TSC2/SNRNP70/SGTA/GSK3A/PIK3CG/MET/TRDMT1/LARP4B/EIF4G2/MAPK14/PDCL3/PARK7/LEPR/SLIRP/NRDE2/TARDBP/USP9X/BECN1/ZFP36/DKC1/TBC1D14/PTPN22/IL10/SORL1/FURIN/TOB1/TLK2/OGT/EIF3H/TAB3/MAPKAPK2/RYBP/SHH/GOLGA2/PAIP1/ANGEL2/LEP/TMEM39A/WDR6/ANXA2/RBM10/USP7/SECISBP2/SVIP/MTOR/RNF5/BAG6/MAGEA3/BAG6/BAG6/BAG6/BAG6/HP/TAF15 | 75 |
| GO:0000082 | G1/S transition of mitotic cell cycle | 72/3662 | 194/15509 | 1.54345e-05 | 0.000129274 | 7.77434e-05 | KMT2E/DBF4/FHL1/ARID1B/ACTB/PSME1/CDC6/CDC7/BCL7C/SMARCB1/CDKN3/APEX1/RBBP8/CCNE1/CASP2/EZH2/RPS6KB1/SMARCD2/CCL2/ZPR1/CCND1/BCL7A/CCND3/PPP2CA/ID2/ARID1A/PKD2/PPP6C/INHBA/CDKN1A/PSME3/CCNH/APC/RDX/RB1/CUL4A/CYP1A1/CTDSP1/PLK2/EGFR/ITGB1/CACUL1/ADAMTS1/LSM11/APPL1/CUL4B/PRMT2/RPL26/GFI1/TERT/CDK5/BRD7/WEE1/RRM1/RFWD3/TRIAP1/RRM2/KLF11/CTDSP2/CCNE2/CACNB4/PLCB1/CHEK2/CDK10/MUC1/ARID2/KANK2/TFDP1/GIGYF2/PRKDC/SMARCB1/PTEN | 72 |
| GO:0098543 | detection of other organism | 19/3662 | 32/15509 | 1.56437e-05 | 0.00013085 | 7.86907e-05 | NOD1/TLR4/NOD2/HLA-B/HLA-A/HLA-A/HLA-B/HLA-A/HLA-A/HLA-B/HLA-A/HLA-B/HLA-A/HLA-A/HLA-B/HLA-A/NAIP/NAIP/NAIP | 19 |
| GO:0007568 | aging | 58/3662 | 148/15509 | 1.60408e-05 | 0.000133991 | 8.05797e-05 | MPO/GLRX2/TNFRSF1B/BAK1/HYAL2/MBD3/TP63/MMP2/APEX1/ERCC2/HAMP/GSK3A/CASP2/RPS6KB1/CRYAB/CTSC/CALCA/PDGFRB/IGFBP2/ARG1/FOXO3/DNMT3A/GNA13/SERP1/CAT/INHBA/BECN1/CD68/EPO/ASS1/LOXL2/EDNRB/IL10/FGF2/IGF1R/CYP1A1/RNF165/SMAD4/SOD1/CARM1/GNA12/VCAM1/INHBB/TGFBR2/GPX4/FOS/DAG1/CNP/TYMS/GRB2/AURKB/NQO1/IRAK1/FOXO4/PAX5/MME/MBP/NTRK1 | 58 |
| GO:1901215 | negative regulation of neuron death | 74/3662 | 201/15509 | 1.63629e-05 | 0.000136497 | 8.20869e-05 | TNFRSF1B/GRN/HIPK2/ERBB3/MAP2K4/RHOA/ROCK1/INPP5A/VPS35/GSK3B/BAX/SLC23A2/KDM2B/AARS1/MSH2/HSP90AB1/ADNP/CHMP4B/IL27RA/GPI/UNC5B/CSF3/CCL2/ZPR1/CCND1/MDK/PARK7/NENF/NR4A3/PTK2B/CNTFR/KDR/APOE/EPO/KRAS/NGF/IL10/STXBP1/SORL1/MAP3K12/MEAK7/ARRB2/SOD1/NONO/NTRK2/POU4F1/NR4A2/BTG2/TBC1D24/TERT/FOXQ1/CDK5/CX3CR1/SEMA3E/BCL2L1/CEBPB/LIG4/HRAS/BDNF/JUN/F2R/CSF1/PRKN/CLN3/FZD9/SYNGAP1/NTRK1/GPRASP3/NAIP/IKBKG/NAIP/NEFL/NAIP/GPI | 74 |
| GO:0065004 | protein-DNA complex assembly | 79/3662 | 218/15509 | 1.67222e-05 | 0.000139307 | 8.37766e-05 | MED24/MED17/RAD51/MED29/RNF4/SIRT6/ATRX/ESR1/SUPT16H/MED15/SMARCB1/PSMC6/TAF1C/CHRAC1/MED25/MACROH2A1/DR1/HELLS/CENPK/H1-3/H2BC11/THRA/HP1BP3/MED6/ANP32B/TAF8/CENPE/RB1/CENPC/BDP1/SSRP1/SMARCA5/H2BC5/CHAF1B/PADI4/TAF6L/H3-3A/MED30/GTF2A1/CENPN/CHAF1A/H1-4/CENPX/MED16/TAF7/NPM1/H2BC21/BRF1/H1-2/CENPP/H2AX/H1-0/HMGB1/H2BC26/TAF13/BRD2/DAXX/DAXX/DNAJC9/BRD2/DAXX/DAXX/BRD2/DAXX/H2BC15/BRD2/BRD2/H4C15/H4C14/H4C12/H2BC6/H3C6/SMARCB1/H4C5/H4C4/H2BC7/H3C10/PADI4/H3C2 | 79 |
| GO:0001660 | fever generation | 13/3662 | 18/15509 | 1.74776e-05 | 0.000144821 | 8.70926e-05 | IL1A/IL1B/EDNRB/TNFRSF11A/TRPV1/TNF/TNF/TNF/TNF/TNF/TNF/TNF/TNF | 13 |
| GO:0002524 | hypersensitivity | 13/3662 | 18/15509 | 1.74776e-05 | 0.000144821 | 8.70926e-05 | BTK/FCGR2B/GATA3/C3/CCR7/ZP3/HLA-E/HLA-E/HLA-E/HLA-E/HLA-E/HLA-E/HLA-E | 13 |
| GO:0030656 | regulation of vitamin metabolic process | 13/3662 | 18/15509 | 1.74776e-05 | 0.000144821 | 8.70926e-05 | SNAI2/CYP27B1/IFNG/GFI1/AKR1C3/TNF/TNF/TNF/TNF/TNF/TNF/TNF/TNF | 13 |
| GO:0046851 | negative regulation of bone remodeling | 13/3662 | 18/15509 | 1.74776e-05 | 0.000144821 | 8.70926e-05 | CD38/P2RX7/CSK/SFRP1/HAMP/CALCA/TNFAIP3/IAPP/IL6/TNFRSF11B/INPP5D/GPR137/INPP5D | 13 |
| GO:0198738 | cell-cell signaling by wnt | 135/3662 | 415/15509 | 1.76359e-05 | 0.000145937 | 8.77642e-05 | WNT16/ITGA3/PAF1/SNAI2/PTPRU/CDH3/FGFR2/RHOA/VPS35/CSNK2A2/CDC42/MARK2/FBXW11/GPC4/GSK3B/ABL1/GSKIP/CHD8/FERMT1/AXIN1/TSC2/SFRP1/TLE5/CCNE1/TGFB1/GSK3A/HBP1/SFRP4/SPIN1/DVL1/GATA3/FBXW4/DKK1/RNF43/WNT3/CCND1/FOLR1/MDK/WNT5B/FZD10/MAPK14/PPP2CA/ARL6/NPHP3/AMOTL2/KPNA1/WNT5A/IGFBP2/SDC1/BCL9/HDAC1/TNFAIP3/FOXO3/PKD2/SFRP5/EGR1/RECK/PFDN5/LRP1/SOX4/BMP2/PIN1/APOE/PRKAA1/LRP4/APC/MDFIC/EDNRB/PPM1B/FGF2/EGF/SKIC8/CSNK1D/APP/CELSR2/RBMS3/TPBG/EGFR/NOTCH1/TCF7L2/FOXO1/HHEX/NR4A2/GNAQ/WIF1/SKI/DVL3/WNT4/VANGL2/DISC1/FRZB/PYGO2/TERT/SHH/VCP/AMER2/NDRG2/BRD7/BTRC/NXN/RBPJ/ZEB2/CTNND2/CDH2/RARG/RNF213/FZD4/DDIT3/FOXL1/CTNNBIP1/NKX2-5/NOG/ZNF703/NOTUM/PRKN/ROR1/BCL9L/RNF220/MAGI2/WNT7B/FZD9/SRC/GRK6/NRARP/GRK5/CSNK2B/CSNK2B/CSNK2B/CSNK2B/CSNK2B/CD24/WNT3/WNT3/LRP6/PTEN | 135 |
| GO:0051493 | regulation of cytoskeleton organization | 151/3662 | 473/15509 | 1.7695e-05 | 0.000146072 | 8.78453e-05 | SCIN/PAFAH1B1/SPAST/PARP3/EPHA3/CYFIP2/RNF4/RHOA/NAV3/ROCK1/SPTB/CDC42/WDR1/MARK2/ARHGEF10L/ADD2/SPAG5/ACTN2/GSK3B/CHMP5/ADD1/TPX2/P2RX7/PXN/ABL1/HCK/CHMP4B/COTL1/NUBP1/PYCARD/TJP1/SFRP1/ARHGEF10/SYDE1/MTPN/MET/TGFBR1/CXCL12/CSF3/RANGRF/MDK/ARPC3/FZD10/NEDD9/PDGFRB/DBN1/CEP70/KAT2B/IL1A/CAPZA1/STMN1/TEK/PTK2B/LRP1/EML2/DSTN/ID1/CCR7/CDC42EP1/RAC2/ARPC1B/CHMP1A/PPFIA1/PRKAA1/WASF3/KATNBL1/PSRC1/NOTCH2/PDGFRA/APC/BORA/DBNL/CCL21/ATAT1/NUMA1/RDX/ABI2/SLAIN1/BBS4/ARHGDIA/TBCD/SMAD4/ABL2/RHOB/SLIT2/EPHA5/PIK3R1/IQGAP2/ARHGAP18/C9orf72/GSN/CDC42EP2/BICD1/PLEKHH2/SKA1/DMTN/ARHGAP35/SPTBN4/ALOX15/WNT4/ARPC5/CAPN2/ANKRD23/CDC42EP3/SPTA1/PRKCD/MAP9/ARFIP1/RICTOR/CDK5/SKA3/TTC8/MAPRE2/RHOH/PTK2/SEMA3E/S1PR1/PRKCE/MAP6/CCL11/SPTBN2/HRAS/CHMP6/CDK5R1/FLII/GRB2/PAK2/MAPK15/NPM1/CSF1R/CIB1/INPP5J/CDK10/GAS2L1/PRKN/DRG1/NF2/CLN3/CD47/GMFB/SPTAN1/MTOR/IQANK1/TMSB4X/PDXP/ARPC1A/TWF2/SHANK3/BRK1/ITGB3/TJP1 | 151 |
| GO:0045931 | positive regulation of mitotic cell cycle | 45/3662 | 107/15509 | 1.77003e-05 | 0.000146072 | 8.78453e-05 | CDC27/KMT2E/PAFAH1B1/ASNS/ANAPC5/CDC6/ABL1/CDC7/APEX1/CDC25B/RAB11A/RPS6KB1/CCND1/FBXO5/SMOC2/CCND3/HES1/TTL/HSPA2/CCNB1/RDX/BRCA2/RB1/CUL4A/CYP1A1/APP/DTL/EGFR/PRKCA/ADAMTS1/LSM11/CUL4B/DBF4B/TAL1/TERT/RRM1/CDK1/RRM2/STAT5B/RCC2/PTPN11/PLCB1/CDK10/PBX1/TFDP1 | 45 |
| GO:0010952 | positive regulation of peptidase activity | 67/3662 | 178/15509 | 1.77316e-05 | 0.000146072 | 8.78453e-05 | BAD/CASP10/FAS/BAK1/GRN/CYFIP2/NGFR/RHOA/PSME4/PICALM/FBLN1/BAX/PSME1/MEFV/PYCARD/PDCD5/NOD1/CASP2/PERP/FN1/HSPE1/FASLG/TNFSF10/SEMG1/ADRM1/PSME3/AKIRIN2/TANK/ANP32B/MTCH1/BCL2L10/PMAIP1/APP/CCN1/ARL6IP5/GSN/BCL2L11/NODAL/GPER1/SYK/VCP/FADD/LGALS9/PRELID1/EFNA1/ANTXR1/EIF2AK3/GRIN1/SVBP/F2R/CARD9/HMGB1/DAPK1/MAP3K5/MBP/CR1/TNF/PSENEN/TNF/FIS1/TNF/TNF/TNF/TNF/TNF/TNF/PDCD6 | 67 |
| GO:0001796 | regulation of type IIa hypersensitivity | 9/3662 | 10/15509 | 1.78407e-05 | 0.000146072 | 8.78453e-05 | FCGR2B/C3/HLA-E/HLA-E/HLA-E/HLA-E/HLA-E/HLA-E/HLA-E | 9 |
| GO:0002419 | T cell mediated cytotoxicity directed against tumor cell target | 9/3662 | 10/15509 | 1.78407e-05 | 0.000146072 | 8.78453e-05 | MR1/HLA-A/HLA-A/HLA-A/HLA-A/HLA-A/HLA-A/HLA-A/HLA-A | 9 |
| GO:0002481 | antigen processing and presentation of exogenous protein antigen via MHC class Ib, TAP-dependent | 9/3662 | 10/15509 | 1.78407e-05 | 0.000146072 | 8.78453e-05 | TAP2/TAP2/TAP2/TAP2/TAP2/TAP2/TAP2/TAP2/B2M | 9 |
| GO:0002892 | regulation of type II hypersensitivity | 9/3662 | 10/15509 | 1.78407e-05 | 0.000146072 | 8.78453e-05 | FCGR2B/C3/HLA-E/HLA-E/HLA-E/HLA-E/HLA-E/HLA-E/HLA-E | 9 |
| GO:1904997 | regulation of leukocyte adhesion to arterial endothelial cell | 9/3662 | 10/15509 | 1.78407e-05 | 0.000146072 | 8.78453e-05 | ZDHHC21/TNF/TNF/TNF/TNF/TNF/TNF/TNF/TNF | 9 |
| GO:1902850 | microtubule cytoskeleton organization involved in mitosis | 56/3662 | 142/15509 | 1.79785e-05 | 0.000147007 | 8.84072e-05 | PAFAH1B1/SPAST/PARP3/EML1/RHOA/SMC1A/FBXW11/NDE1/NDC80/PIBF1/CHMP5/ZW10/TPX2/NSFL1C/BIRC5/NUDC/KIF4A/MYBL2/CHMP4B/RAB11A/ARHGEF10/BCCIP/SMC3/CDC20/STMN1/PTPA/SBDS/CHMP1A/CCNB1/PSRC1/CDCA8/BORA/SPRY2/NUMA1/NUSAP1/KIF23/CENPE/PLK2/ITGB1/SPC25/GJA1/PCNT/MAP9/VCP/GOLGA2/KAT5/CHMP6/AURKB/SETD2/CHEK2/DRG1/KIFC1/LSM14A/NDE1/TBCE/SPICE1 | 56 |
| GO:0008608 | attachment of spindle microtubules to kinetochore | 22/3662 | 40/15509 | 1.83064e-05 | 0.000149294 | 8.97826e-05 | SIRT2/CDC42/SPAG5/NDC80/SEH1L/BIRC5/KAT2B/TEX14/BECN1/CCNB1/CDCA8/APC/KNL1/CENPE/RB1/KIF2C/CENPC/BOD1/SPC25/KAT5/AURKB/RCC2 | 22 |
| GO:0050999 | regulation of nitric-oxide synthase activity | 22/3662 | 40/15509 | 1.83064e-05 | 0.000149294 | 8.97826e-05 | ATP2B4/FCER2/NOD1/IL1A/PTK2B/IL1B/APOE/EGFR/DDAH1/CALM3/TERT/LEP/ZDHHC21/CNR2/TNF/TNF/TNF/TNF/TNF/TNF/TNF/TNF | 22 |
| GO:0061564 | axon development | 147/3662 | 459/15509 | 1.89562e-05 | 0.000154389 | 9.28471e-05 | IFRD1/PAFAH1B1/CNTN1/SPAST/GRN/CDH1/EPHA3/LAMA3/NGFR/NTN1/FGFR2/EPHA8/MARK2/PICALM/GLI2/NOTCH3/ACTB/PLXNA2/EPHA6/GSK3B/RAB10/MMP2/DPYSL2/HSP90AB1/ABL1/ADNP/BMP7/LAMA1/SCN1B/PTN/DVL1/GATA3/CXCL12/UNC5B/PPP3CB/WNT3/CNTNAP1/EFNB3/ZPR1/FOLR1/DBN1/WNT5A/TTL/ITGA4/FN1/MTR/STMN1/NRP2/SPP1/EGR2/USP9X/FLRT3/BCL11B/RAC2/CHN1/APOE/LAMA5/EPHB2/TSPAN2/NOTCH2/NGF/LRP4/DBNL/NKX2-1/STXBP1/KIAA0319/TUBB2B/IGF1R/RNF165/SMAD4/APP/EPHA2/CRABP2/SLIT2/EPHA5/TNFRSF21/C9orf72/NTRK2/NOTCH1/PARD3/NCAM1/ITGB1/POU4F2/POU4F1/NR4A2/UCHL1/DPYSL5/B4GALT5/ISL2/ARHGAP35/SPTBN4/BRSK1/TBC1D24/DISC1/SLC25A46/CASP3/SHH/ADCY1/CDK5/TTC8/RHOH/SEMA4C/EFNA1/PTK2/SEMA3E/CDH2/KIF5B/NPTX1/LPAR3/MAP6/LAMB2/BSG/DAG1/CNP/BRSK2/BDNF/CDK5R1/JUN/SVBP/CDH4/PTPN11/PAK2/ADGRB1/RGMA/CSF1R/EPHB3/NOG/CNTN2/SLIT3/POU3F2/DCC/SYNGAP1/SIPA1L1/MBP/NTRK1/GDI1/TCTN1/TMEFF1/EFNA4/TWF2/TUBB3/EPHB6/NEFL/WNT3/WNT3/TBCE/PTEN | 147 |
| GO:0051168 | nuclear export | 55/3662 | 139/15509 | 1.90067e-05 | 0.000154598 | 9.29722e-05 | UPF1/RANBP3/THOC3/SP100/SMG6/PRKACA/SIRT6/GSK3B/XPO1/ALKBH5/RANGAP1/PABPN1/UBE2I/TGFB1/CASC3/HSPA9/PARK7/NRDE2/EGR2/CSE1L/NUP153/NUP85/IL1B/NXT1/XPO4/HNRNPA1/LTV1/NCBP1/ANP32B/EIF4A3/POLR2D/TCF7L2/BAG3/HHEX/RANBP2/NXF1/THOC7/RANBP3L/CDK5/NEMF/AHCYL1/DDX19A/NMD3/CALR/PTPN11/NPM1/SETD2/XPOT/SDAD1/SMG5/SARNP/EIF6/RBM15B/RBM8A/PRKACA | 55 |
| GO:0014823 | response to activity | 32/3662 | 68/15509 | 1.93384e-05 | 0.000156884 | 9.43474e-05 | CRY1/CYBA/OXCT1/MMP2/ANGPT2/PPARD/CRY2/CAT/CXCR4/PRKAA1/IL6/IL10/ALAD/ZEB1/BMP6/FNDC5/SELENON/CDK1/FOS/LEP/ADIPOQ/TNF/TNF/TNF/TNF/TNF/TNF/TNF/TNF/ADSL/MTFP1/ITGB3 | 32 |
| GO:0034103 | regulation of tissue remodeling | 32/3662 | 68/15509 | 1.93384e-05 | 0.000156884 | 9.43474e-05 | CD38/FLT4/ROCK1/P2RX7/CSK/SFRP1/TGFB1/HAMP/MDK/CALCA/IL12B/LEPR/TNFAIP3/SPP1/IAPP/IL6/IL21/DEF8/TNFRSF11A/IL18/PRKCA/RUNX1/TNFRSF11B/SYK/INPP5D/S1PR1/GPR137/LEP/CSF1R/SRC/ITGB3/INPP5D | 32 |
| GO:0007599 | hemostasis | 79/3662 | 219/15509 | 2.01835e-05 | 0.000163526 | 9.83418e-05 | SLC4A1/CD9/F7/LMAN1/ACTB/FBLN1/CD59/APOH/PDGFB/MYH9/CTSG/PROCR/CD40/GATA1/CD40LG/DGKH/PLAT/GPI/TFPI2/PIK3CG/HSPB1/SERPINE1/HGFAC/VWF/SH2B3/MAPK14/FN1/MPL/SERPINC1/GNA13/F13A1/APOE/AP3B1/EPHB2/PDGFRA/CD36/SERPINE2/IL6/STXBP1/TLR4/THBS1/ADAMTS18/GNA12/AK3/MERTK/DGKE/PRKCA/GNAQ/DMTN/ADAMTS13/ZNF385A/PF4/PRKCD/ANXA5/F2RL2/SHH/NOS3/SYK/FUNDC2/HPS6/PRDX2/C1GALT1C1/FGG/FGA/JMJD1C/SELP/F2/F2R/ANXA2/ADRA2C/PLSCR1/BLOC1S3/PPIA/SRC/F5/HBB/ITGB3/ADAMTS13/GPI | 79 |
| GO:0045779 | negative regulation of bone resorption | 12/3662 | 16/15509 | 2.02774e-05 | 0.000163645 | 9.84134e-05 | CD38/P2RX7/CSK/HAMP/CALCA/TNFAIP3/IAPP/IL6/TNFRSF11B/INPP5D/GPR137/INPP5D | 12 |
| GO:0051988 | regulation of attachment of spindle microtubules to kinetochore | 12/3662 | 16/15509 | 2.02774e-05 | 0.000163645 | 9.84134e-05 | SIRT2/CDC42/SPAG5/BIRC5/KAT2B/BECN1/CCNB1/CDCA8/APC/KAT5/AURKB/RCC2 | 12 |
| GO:2000347 | positive regulation of hepatocyte proliferation | 12/3662 | 16/15509 | 2.02774e-05 | 0.000163645 | 9.84134e-05 | XBP1/PTN/MDK/TNFAIP3/TNF/TNF/TNF/TNF/TNF/TNF/TNF/TNF | 12 |
| GO:0043434 | response to peptide hormone | 123/3662 | 373/15509 | 2.04375e-05 | 0.000164723 | 9.90615e-05 | CRY1/CPS1/CYBA/KCNQ1/F7/PKM/ROCK1/ACTN2/OPRK1/GSK3B/RAB10/PXN/NUDC/CDC6/XBP1/RANGAP1/APEX1/PCK2/BMP7/TSC2/CSK/PLAT/SLC39A14/JAK3/GSK3A/CXCL12/RPS6KB1/AREG/MAPK14/CCND3/KAT2B/NCL/STAT1/SRSF4/SLC2A1/ARG1/NR4A3/EIF2B2/CRHR1/EGR1/CRY2/CAT/TNFSF10/INHBA/EGR2/NR4A1/NCOA5/IL1B/MAX/STAT5A/CDO1/GDF15/ASS1/SESN2/PRKAA1/LPIN3/MEN1/APC/EDNRB/IL10/SORL1/KHK/CYP1B1/RB1/IGF1R/MEAK7/TNFRSF11A/RAB13/PKLR/PARP1/CCNA2/PIK3R1/OGT/EIF4EBP2/SESN3/SOGA1/FOXO1/POU4F2/NR4A2/APPL1/ADIPOR1/BTG2/SHC1/JAK1/SCNN1D/INHBB/PRKCD/GPER1/CYBB/ZNF592/SLC27A4/AHCYL1/PTK2/FOS/SLC25A33/BSG/RELA/ESRRA/DAG1/STAT5B/LEP/PTPN2/LPL/GRB2/ERFE/PTPN11/OXTR/ADIPOQ/PLCB1/FOXO4/SOCS1/ZFP36L1/TRPV1/SRC/MTOR/EIF6/PRKDC/ITGB3/GH1/PKLR/PIP4K2B/NEFL/LRP6 | 123 |
| GO:0033273 | response to vitamin | 35/3662 | 77/15509 | 2.05605e-05 | 0.000165498 | 9.95279e-05 | SNAI2/CASR/F7/BMP7/SFRP1/HAMP/CCND1/FOLR1/CYP27B1/VDR/PPARD/IL1A/ARG1/SPP1/DNMT3A/TRIM25/CAT/TRIM24/RUNX2/BECN1/ALDH1A2/EPO/RARA/IGF1R/CYP1A1/ALAD/STC1/AQP3/MN1/MGMT/LEP/TYMS/KANK2/F5/LOC102724560 | 35 |
| GO:0032770 | positive regulation of monooxygenase activity | 20/3662 | 35/15509 | 2.06207e-05 | 0.000165553 | 9.95606e-05 | CDH3/FCER2/NOD1/CYP27B1/VDR/IFNG/PARK7/PTK2B/IL1B/APOE/CALM3/TERT/TNF/TNF/TNF/TNF/TNF/TNF/TNF/TNF | 20 |
| GO:0045191 | regulation of isotype switching | 20/3662 | 35/15509 | 2.06207e-05 | 0.000165553 | 9.95606e-05 | PARP3/FOXP3/TBX21/MLH1/PTPRC/MSH2/CD40/IL27RA/TGFB1/EXOSC3/NSD2/IL4/BCL6/SHLD2/NDFIP1/IL10/SLC15A4/TNFSF13/CD28/PTPRC | 20 |
| GO:0016045 | detection of bacterium | 18/3662 | 30/15509 | 2.14886e-05 | 0.000172075 | 0.000103483 | NOD1/NOD2/HLA-B/HLA-A/HLA-A/HLA-B/HLA-A/HLA-A/HLA-B/HLA-A/HLA-B/HLA-A/HLA-A/HLA-B/HLA-A/NAIP/NAIP/NAIP | 18 |
| GO:1903798 | regulation of miRNA maturation | 18/3662 | 30/15509 | 2.14886e-05 | 0.000172075 | 0.000103483 | ZMPSTE24/ESR1/TGFB1/DDX5/MYCN/IL6/TARBP2/EGFR/TERT/TRUB1/TNF/TNF/TNF/TNF/TNF/TNF/TNF/TNF | 18 |
| GO:0000070 | mitotic sister chromatid segregation | 64/3662 | 169/15509 | 2.16925e-05 | 0.000172786 | 0.00010391 | CDC27/BAZ1B/ARID1B/SMC1A/ACTB/SPAG5/NDC80/PIBF1/ATRX/SEH1L/CHMP5/ZW10/ANAPC5/BIRC5/NUDC/KIF4A/CDC6/BCL7C/SMARCB1/CHMP4B/RAB11A/SMC3/SMARCD2/BCL7A/FBXO5/MACROH2A1/SMC4/KAT2B/CDC20/NSL1/ARID1A/SLF2/TEX14/NAA50/PDS5A/CENPK/BECN1/MAU2/CHMP1A/CCNB1/PSRC1/CDCA8/APC/NUMA1/NUSAP1/KIF23/CENPE/RB1/KIF2C/CENPC/BOD1/NCAPG2/SPC25/SMARCA5/BRD7/BUB1/KAT5/ZWILCH/CHMP6/AURKB/KMT5A/ARID2/KIFC1/SMARCB1 | 64 |
| GO:0019216 | regulation of lipid metabolic process | 104/3662 | 306/15509 | 2.17012e-05 | 0.000172786 | 0.00010391 | MBTPS2/SNAI2/CD74/H6PD/MTMR1/DDX20/PLPP1/PDK3/FGFR3/CDC42/EPHA8/ACADVL/SIRT6/PIBF1/ZMPSTE24/APOB/PIK3IP1/PDGFB/EEF1A2/FLT1/ASAH1/TGFB1/PIK3CG/EDF1/CD81/CYP27B1/IFNG/PPARD/PDE8B/MACROH2A1/PDGFRB/IL1A/ID2/NR4A3/TEK/EGR1/PTK2B/EPHX2/FLT3/ORMDL2/RAB38/ACSL3/IL1B/C3/BMP2/THRA/CCR7/NR1D1/ATG14/BCL11B/APOE/PRKAA1/PDGFRA/CCL21/SORL1/FGF2/IGF1R/BBS4/ARMC5/ASXL3/SOD1/CCN1/ERLIN2/BMP6/KIT/LDLRAP1/ADIPOR1/WNT4/GFI1/CAPN2/ATP1A1/FABP1/PRKCD/GPER1/NOD2/ABCA3/PTK2/ALK/PRKCE/ORMDL3/CCL19/KAT5/ARV1/STAT5B/RNF213/LEP/CD19/ERFE/F2/ADIPOQ/KLHL25/AKR1C3/SRC/MTOR/TNF/TNF/TNF/TNF/TNF/TNF/TNF/TNF/EIF6/PIP4K2B | 104 |
| GO:0009820 | alkaloid metabolic process | 10/3662 | 12/15509 | 2.17614e-05 | 0.000172786 | 0.00010391 | CYP2D6/CYP3A5/CYP1A2/CYP3A4/NNMT/CYP2D6/CYP2D6/CYP2D6/CYP2D6/CYP2D6 | 10 |
| GO:0032829 | regulation of CD4-positive, CD25-positive, alpha-beta regulatory T cell differentiation | 10/3662 | 12/15509 | 2.17614e-05 | 0.000172786 | 0.00010391 | FOXP3/IFNG/IL2RG/LGALS9/KLHL25/HLA-DRA/HLA-DRA/HLA-DRA/HLA-DRA/HLA-DRA | 10 |
| GO:0032831 | positive regulation of CD4-positive, CD25-positive, alpha-beta regulatory T cell differentiation | 10/3662 | 12/15509 | 2.17614e-05 | 0.000172786 | 0.00010391 | FOXP3/IFNG/IL2RG/LGALS9/KLHL25/HLA-DRA/HLA-DRA/HLA-DRA/HLA-DRA/HLA-DRA | 10 |
| GO:0060664 | epithelial cell proliferation involved in salivary gland morphogenesis | 10/3662 | 12/15509 | 2.17614e-05 | 0.000172786 | 0.00010391 | FGFR2/SHH/TNF/TNF/TNF/TNF/TNF/TNF/TNF/TNF | 10 |
| GO:0051898 | negative regulation of protein kinase B signaling | 23/3662 | 43/15509 | 2.17725e-05 | 0.000172786 | 0.00010391 | HYAL2/TSC2/SH2B3/PPP2CA/SFRP5/ARRB2/EPHA2/GPER1/OTUD3/DAG1/DDIT3/CIB1/MAGI2/HLA-G/HLA-G/HLA-G/HLA-G/HLA-G/HLA-G/HLA-G/PDCD6/HLA-G/PTEN | 23 |
| GO:0002036 | regulation of L-glutamate import across plasma membrane | 11/3662 | 14/15509 | 2.20957e-05 | 0.000174903 | 0.000105183 | PER2/ARL6IP5/ITGB1/TNF/TNF/TNF/TNF/TNF/TNF/TNF/TNF | 11 |
| GO:0046645 | positive regulation of gamma-delta T cell activation | 11/3662 | 14/15509 | 2.20957e-05 | 0.000174903 | 0.000105183 | PTPRC/LILRB1/SOX4/SYK/NOD2/STAT5B/PTPRC/LILRB1/LILRB1/LILRB1/LILRB1 | 11 |
| GO:1901987 | regulation of cell cycle phase transition | 122/3662 | 370/15509 | 2.21449e-05 | 0.000175069 | 0.000105283 | CDC27/KMT2E/DBF4/PAF1/CRY1/FHL1/USP28/ARID1B/RAD51/ATP2B4/SIRT2/ACTB/NDC80/ZW10/ANAPC5/BIRC5/PSME1/CDC6/MSH2/CDC7/BCL7C/SMARCB1/APEX1/CDC25B/RBBP8/RAB11A/NBN/ERCC2/DOT1L/CASP2/EZH2/SMARCD2/CCL2/CCND1/BCL7A/FBXO5/MAPK14/CCND3/CCNG1/RAD50/PPP2CA/MACROH2A1/ID2/CDC20/ARID1A/PKD2/TEX14/INHBA/CDKN1A/HSPA2/PSME3/MEN1/CCNB1/CCNH/CDCA8/APC/RDX/CENPE/NABP2/BRCA2/RB1/CUL4A/CYP1A1/APP/DTL/DYRK3/INTS3/CTDSP1/PLK2/EGFR/SPC25/ZFP36L2/ADAMTS1/XPC/EME1/LSM11/APPL1/CUL4B/PRMT2/BRSK1/MRNIP/DBF4B/RPL26/ERCC3/TERT/BRD7/WEE1/RRM1/RFWD3/MN1/BUB1/AVEN/CDK1/TRIAP1/RHNO1/RRM2/NABP1/ZWILCH/CTDSP2/AURKB/RCC2/PTPN11/MAPK15/NPM1/CACNB4/PLCB1/CEP63/CHEK2/FOXO4/CDK10/MUC1/PBX1/ZFP36L1/H2AX/ARID2/KANK2/TFDP1/GIGYF2/PRKDC/SMARCB1/PAGR1/PTEN | 122 |
| GO:0043401 | steroid hormone mediated signaling pathway | 52/3662 | 130/15509 | 2.23141e-05 | 0.000176182 | 0.000105953 | KDM1A/CRY1/RNF14/UFL1/PLPP1/RHOA/TP63/PIAS2/PGR/ESR1/RBFOX2/BMP7/SFRP1/ZMIZ1/DDX5/PPARD/KDM3A/PARK7/HDAC1/PADI2/ARID1A/NR4A3/CRY2/PKN1/CNOT1/NR1D1/YWHAH/WBP2/CARM1/PARP1/CNOT9/POU4F2/NODAL/PRMT2/HEYL/GPER1/TRIM68/PAQR8/TADA3/CYP7B1/ESRRA/TAF7/CALR/SRC/KANK2/RXRB/DAXX/DAXX/DAXX/DAXX/DAXX/PAGR1 | 52 |
| GO:0090092 | regulation of transmembrane receptor protein serine/threonine kinase signaling pathway | 89/3662 | 254/15509 | 2.28663e-05 | 0.000180312 | 0.000108437 | ITGA3/HFE/HSPA5/ARID4B/HIPK2/ITGA8/LRP2/FKBP1A/GLG1/HSP90AB1/ABL1/BMP7/FERMT1/SMAD7/RBBP7/AXIN1/SFRP1/TGFB1/SFRP4/TGFBR1/ENG/BMPR1A/DKK1/FOLR1/ZNF451/WNT5A/HES1/HDAC1/SFRP5/INHBA/LRP1/BMP2/PIN1/KDR/TWSG1/CDKN1C/GDF15/MEN1/NOTCH2/SPRY2/NKX2-1/CCN3/KIAA0319/NUMA1/SORL1/THBS1/SMAD6/TET1/FBN2/TOB1/RNF165/SMAD4/CCN1/PARP1/OGT/NOTCH1/ZEB1/CRIM1/BMP6/NODAL/SKI/RBBP4/INHBB/TGFBR2/SAP30/GDF9/ELAPOR2/SHH/HTRA1/RBPJ/ZEB2/SMAD2/EID2/RGMA/NOG/ZNF703/BCL9L/TMPRSS6/MAGI2/TRIM33/SLC2A10/SPRED2/CSNK2B/CSNK2B/CSNK2B/CSNK2B/CSNK2B/CDKN1C/CRIM1 | 89 |
| GO:0051962 | positive regulation of nervous system development | 93/3662 | 268/15509 | 2.33826e-05 | 0.000184149 | 0.000110744 | KDM1A/PAFAH1B1/UFL1/TNFRSF1B/NTN1/PLXNA2/TP73/XRCC5/LRP2/ADNP/TGFB1/PTN/CXCL12/WNT3/MDK/IFNG/DBN1/HES1/FN1/ID2/HDAC1/CXCR4/EGR2/OBSL1/IL1B/NKX2-2/BMP2/FLRT3/LIF/EPHB2/KRAS/NGF/SERPINE2/IL6/DBNL/ACTR2/FGF2/CLSTN3/ST8SIA2/CRABP2/SLIT2/TPBG/NTRK2/NOTCH1/ITGB1/VEGFC/POU4F2/KIT/FAIM/TBC1D24/DISC1/SHH/GPER1/CX3CR1/RGS14/LPAR3/MAP6/DAG1/LIG4/BDNF/CDH4/OXTR/PLAG1/ADGRB1/EPHB3/SS18L1/THBS2/IL1RAP/MME/NTRK1/MTOR/GPRASP3/TGM2/GDI1/TNF/TNF/LTA/TNF/LTA/TNF/TNF/TNF/TNF/LTA/LTA/TNF/LTA/TWF2/SHANK3/CUX1/NEFL/WNT3/WNT3 | 93 |
| GO:0006470 | protein dephosphorylation | 84/3662 | 237/15509 | 2.38063e-05 | 0.000187248 | 0.000112608 | PTBP1/PPP5C/PHLPP2/PTPRU/ROCK1/FBXW11/PTPRC/DUSP12/GSK3B/PPP1R15A/FKBP1A/HSP90AB1/PPP6R2/CDKN3/CDC25B/PPP1R16B/EYA1/TGFB1/CD33/PPP3CB/PTPMT1/PPM1H/PTP4A1/PPP2R5D/PPP2CA/PDGFRB/PTPA/PPP6C/MASTL/CRY2/PIN1/STYXL1/PTPN22/PPM1B/DUSP5/MTMR6/ENSA/DUSP10/ACP1/CALM2/CTDSP1/BOD1/GNA12/PPP4C/PPP2R5E/SPPL3/DUSP2/PPP1R15B/CALM3/SSU72/PRKCD/DUSP7/NSMF/BTRC/PPP2R3B/PPM1D/PDP2/CTDSP2/PTPN2/ANKLE2/PTPN11/PPP1R2/PTP4A3/MAGI2/PPIA/MTOR/CSNK2B/TNF/PPP1R11/TNF/TNF/CSNK2B/CSNK2B/TNF/TNF/CSNK2B/TNF/TNF/TNF/CSNK2B/PDXP/PGAM5/PTPRC/PTEN | 84 |
| GO:0071559 | response to transforming growth factor beta | 86/3662 | 244/15509 | 2.43084e-05 | 0.000190756 | 0.000114718 | ITGA3/RUNX3/HSPA5/ARID4B/HIPK2/SPI1/FGFR2/ROCK1/HYAL2/ITGA8/FKBP1A/PXN/GLG1/HSP90AB1/ABL1/FERMT1/SMAD7/RBBP7/AXIN1/SFRP1/PDCD5/TGFB1/TGFBR1/ENG/BMPR1A/ZMIZ1/LPXN/FOLR1/ZNF451/IL4/SMAD5/WNT5A/STK16/HDAC1/ARG1/FMOD/USP9X/BMP2/ID1/PIN1/TWSG1/CDKN1C/GDF15/MEN1/SPRY2/NKX2-1/THBS1/SMAD6/TET1/FBN2/IGF1R/FURIN/ARRB2/SMAD4/PARP1/OGT/ZEB1/ZFP36L2/NODAL/APPL1/SKI/RBBP4/WNT4/TGFBR2/SAP30/GDF9/HTRA1/CX3CR1/ADAM9/PTK2/ZEB2/LIMS1/FOS/PDE3A/SMAD2/EID2/JUN/PAK2/ZNF703/ZFP36L1/BCL9L/SRC/TRIM33/SLC2A10/SPRED2/CDKN1C | 86 |
| GO:0048144 | fibroblast proliferation | 44/3662 | 105/15509 | 2.43139e-05 | 0.000190756 | 0.000114718 | IGF1/CD74/NGFR/DAZAP1/FOSL2/SIRT6/ZMPSTE24/BAX/ESR1/CDC6/ABL1/PDGFB/SFRP1/MED25/ZMIZ1/PDGFRB/WNT5A/FN1/PRDX1/CDKN1A/LIF/CCNB1/PDGFRA/CCNA2/PDGFC/EGFR/SKI/TP53INP1/FTH1/CDK1/CKS1B/LIG4/HRAS/JUN/C1QL4/WNT7B/LTA/LTA/LTA/LTA/LTA/BRK1/ITGB3/MIF | 44 |
| GO:0032970 | regulation of actin filament-based process | 119/3662 | 360/15509 | 2.44974e-05 | 0.000191953 | 0.000115437 | SCIN/EPHA3/CYFIP2/PKP2/RHOA/ROCK1/SPTB/CDC42/WDR1/ARHGEF10L/ADD2/ACTN2/ADD1/PXN/DSP/ABL1/MYH9/HCK/COTL1/PYCARD/TJP1/SFRP1/ARHGEF10/MTPN/MET/TGFBR1/CXCL12/ACTA2/CSF3/RANGRF/MDK/ARPC3/FZD10/NEDD9/PDE4D/PDGFRB/DBN1/IL1A/CAPZA1/STMN1/TNNT2/TEK/PTK2B/LRP1/KCNJ2/DSTN/ID1/CCR7/CDC42EP1/RAC2/ARPC1B/PPFIA1/WASF3/NOTCH2/PDGFRA/DBNL/CCL21/RDX/ABI2/BBS4/ARHGDIA/SMAD4/ABL2/RHOB/SLIT2/EPHA5/ANK2/PIK3R1/IQGAP2/ARHGAP18/C9orf72/GSN/CDC42EP2/PLEKHH2/DMTN/STC1/ARHGAP35/SPTBN4/ALOX15/WNT4/ARPC5/ANKRD23/CDC42EP3/SPTA1/PRKCD/ARFIP1/RICTOR/CDK5/TTC8/RHOH/SEMA3E/S1PR1/PRKCE/CCL11/SPTBN2/ATP2A2/HRAS/CDK5R1/FLII/GRB2/PAK2/CSF1R/PDE4B/CDK10/PRKN/NF2/CD47/GMFB/SPTAN1/MTOR/IQANK1/TMSB4X/PDXP/ARPC1A/TWF2/SHANK3/BRK1/ITGB3/TJP1 | 119 |
| GO:0046777 | protein autophosphorylation | 76/3662 | 210/15509 | 2.52594e-05 | 0.000197674 | 0.000118878 | MAP3K9/BTK/MVP/CLK1/FLT4/EIF2AK2/FGFR2/FGFR3/EPHA8/PRKACA/MARK2/FGFR1/MKNK1/PTPRC/STK17B/GSK3B/MAPKAPK5/ABL1/MKNK2/PDGFB/RASSF2/HCK/FLT1/CSK/NBN/PRKD2/ENG/RAD50/PDGFRB/ZAP70/STK16/PASK/TEK/PTK2B/FLT3/TRIM24/KDR/PDGFRA/MAP3K12/IGF1R/ULK3/MAP3K21/CALM2/PDGFC/EGFR/NTRK2/VEGFC/KIT/CALM3/MAPKAPK2/CDK5/SYK/CDK12/PTK2/ALK/EIF2AK3/ATG13/JUN/FAM20C/ERN1/AURKB/PAK2/MAPK15/ADIPOQ/CSF1R/EPHB3/CHEK2/IRAK1/DAPK1/SRC/PIM3/NTRK1/MTOR/GRK5/PTPRC/PRKACA | 76 |
| GO:0045124 | regulation of bone resorption | 21/3662 | 38/15509 | 2.57166e-05 | 0.000200998 | 0.000120877 | CD38/P2RX7/CSK/HAMP/CALCA/TNFAIP3/SPP1/IAPP/IL6/DEF8/TNFRSF11A/PRKCA/TNFRSF11B/SYK/INPP5D/S1PR1/GPR137/CSF1R/SRC/ITGB3/INPP5D | 21 |
| GO:1900221 | regulation of amyloid-beta clearance | 15/3662 | 23/15509 | 2.60366e-05 | 0.000203243 | 0.000122227 | ROCK1/IFNG/IL4/HDAC1/CLU/LRP1/APOE/TNF/TNF/TNF/TNF/TNF/TNF/TNF/TNF | 15 |
| GO:0140694 | non-membrane-bounded organelle assembly | 111/3662 | 332/15509 | 2.62545e-05 | 0.000204686 | 0.000123094 | PUM2/RNF4/RHOA/WDR1/SMC1A/MLH1/SPAG5/ACTN2/XRCC5/NDC80/PIBF1/CHMP5/TPX2/RPL6/BIRC5/KIF4A/CIRBP/MYBL2/HCK/CHMP4B/RAB11A/CEP152/SQLE/ARHGEF10/BCCIP/SMC3/C1QBP/DDX6/NOP2/FBXO5/BRIX1/IL5/PDGFRB/KAT2B/CDC20/TNNT2/CENPK/OBSL1/CNOT1/SBDS/STYXL1/CHMP1A/PRKAA1/ERAL1/MYH11/CDCA8/PDGFRA/LCP1/DBNL/NUMA1/KIF23/HAUS2/CENPE/CSNK1D/SMAD4/GRB7/UBAP2L/CENPC/PLK2/ABT1/MSN/C9orf72/GSN/ITGB1/DHX37/BICD1/ANKRD23/MAP9/CSF2/RPL10L/ZFYVE1/CENPN/MAPRE2/GOLGA2/CENPX/RNF213/CEP135/CHMP6/FLII/PLEC/AURKB/MAPK15/NPM1/CEP63/NKX2-5/CHEK2/DRG1/YTHDF3/RRP7A/TUBB/SRC/RPL23A/CCDC69/TNF/TNF/HAUS3/TNF/TNF/TNF/TNF/TNF/TNF/KIFC1/PISD/PWP2/EIF6/PRKDC/LSM14A/BOP1/MYH11/SPICE1 | 111 |
| GO:0008585 | female gonad development | 41/3662 | 96/15509 | 2.66115e-05 | 0.000207208 | 0.000124611 | HSPA5/MSH4/PGR/BAX/MMP2/ESR1/PCYT1B/SFRP1/CASP2/FOXO3/EIF2B2/INHBA/KDR/PDGFRA/CYP19A1/BRCA2/ARRB2/SMAD4/SOD1/SLIT2/GAS2/ARID5B/ADAMTS1/MMP14/KIT/WNT4/INHBB/CASP3/GDF9/NOS3/ZFPM2/BCL2L1/CEBPB/STAT5B/LEP/FZD4/A2M/SLIT3/ZP3/SRC/FANCG | 41 |
| GO:0061180 | mammary gland epithelium development | 31/3662 | 66/15509 | 2.72142e-05 | 0.000211635 | 0.000127274 | NTN1/FGFR2/PGR/BAX/ESR1/HOXA5/GATA3/WNT3/AREG/CCND1/VDR/WNT5A/ID2/KDM5B/IRF6/FGF2/BRCA2/EPHA2/WNT4/PYGO2/BTRC/MGMT/CCL11/CEBPB/CSF1R/ZNF703/CSF1/WNT7B/SRC/WNT3/WNT3 | 31 |
| GO:0051341 | regulation of oxidoreductase activity | 40/3662 | 93/15509 | 2.72566e-05 | 0.0002117 | 0.000127313 | SLC4A1/CYBA/ATP2B4/CDH3/ABL1/FCER2/NOD1/CYP27B1/VDR/IFNG/IL1A/PARK7/PTK2B/IL1B/ECSIT/APOE/FDX1/COX17/ABL2/EGFR/DDAH1/CALM3/GFI1/TERT/FXN/NOD2/PDP2/LEP/ZDHHC21/PRKN/CNR2/TNF/TNF/TNF/TNF/TNF/TNF/TNF/TNF/HP | 40 |
| GO:1904377 | positive regulation of protein localization to cell periphery | 32/3662 | 69/15509 | 2.79538e-05 | 0.000216843 | 0.000130406 | ITGA3/EPHA3/ATP2B4/RANGRF/IFNG/LRP1/RAB38/ACSL3/EPHB2/NUMA1/EPHA2/STAC/PIK3R1/EGFR/ITGB1/RER1/EPB41/GPER1/KIF5B/PRKCE/CIB1/STAC3/CLN3/TNF/TNF/TNF/TNF/TNF/TNF/TNF/TNF/SQSTM1 | 32 |
| GO:0097300 | programmed necrotic cell death | 25/3662 | 49/15509 | 2.81299e-05 | 0.000217936 | 0.000131063 | BIRC3/FAS/BAX/DNM1L/ASAH1/PPIF/FASLG/RBCK1/IRF3/MUTYH/PARP1/OGT/TLR3/FADD/FZD9/MAP3K5/TNF/TNF/TNF/TNF/TNF/TNF/TNF/TNF/PGAM5 | 25 |
| GO:0007409 | axonogenesis | 134/3662 | 415/15509 | 2.82735e-05 | 0.000218776 | 0.000131568 | IFRD1/PAFAH1B1/CNTN1/SPAST/CDH1/EPHA3/LAMA3/NGFR/NTN1/FGFR2/EPHA8/MARK2/PICALM/GLI2/NOTCH3/ACTB/PLXNA2/EPHA6/GSK3B/RAB10/DPYSL2/HSP90AB1/ABL1/ADNP/BMP7/LAMA1/SCN1B/DVL1/GATA3/CXCL12/UNC5B/PPP3CB/WNT3/CNTNAP1/EFNB3/DBN1/WNT5A/TTL/ITGA4/FN1/STMN1/NRP2/SPP1/EGR2/USP9X/FLRT3/BCL11B/RAC2/CHN1/APOE/LAMA5/EPHB2/NOTCH2/NGF/LRP4/DBNL/NKX2-1/STXBP1/KIAA0319/TUBB2B/IGF1R/RNF165/SMAD4/APP/EPHA2/CRABP2/SLIT2/EPHA5/C9orf72/NTRK2/NOTCH1/PARD3/NCAM1/ITGB1/POU4F2/POU4F1/NR4A2/UCHL1/DPYSL5/B4GALT5/ISL2/ARHGAP35/SPTBN4/BRSK1/DISC1/SLC25A46/SHH/ADCY1/CDK5/TTC8/RHOH/SEMA4C/EFNA1/PTK2/SEMA3E/CDH2/KIF5B/NPTX1/LPAR3/MAP6/LAMB2/BSG/DAG1/CNP/BRSK2/BDNF/CDK5R1/CDH4/PTPN11/PAK2/ADGRB1/CSF1R/EPHB3/NOG/CNTN2/SLIT3/POU3F2/DCC/SYNGAP1/SIPA1L1/MBP/NTRK1/GDI1/TCTN1/TMEFF1/EFNA4/TWF2/TUBB3/EPHB6/NEFL/WNT3/WNT3/TBCE/PTEN | 134 |
| GO:0071560 | cellular response to transforming growth factor beta stimulus | 84/3662 | 238/15509 | 2.83847e-05 | 0.000219362 | 0.00013192 | ITGA3/HSPA5/ARID4B/HIPK2/SPI1/FGFR2/HYAL2/ITGA8/FKBP1A/PXN/GLG1/HSP90AB1/ABL1/FERMT1/SMAD7/RBBP7/AXIN1/SFRP1/PDCD5/TGFB1/TGFBR1/ENG/BMPR1A/ZMIZ1/LPXN/FOLR1/ZNF451/IL4/SMAD5/WNT5A/STK16/HDAC1/ARG1/FMOD/USP9X/BMP2/ID1/PIN1/TWSG1/CDKN1C/GDF15/MEN1/SPRY2/NKX2-1/THBS1/SMAD6/TET1/FBN2/IGF1R/FURIN/ARRB2/SMAD4/PARP1/OGT/ZEB1/ZFP36L2/NODAL/APPL1/SKI/RBBP4/WNT4/TGFBR2/SAP30/GDF9/HTRA1/CX3CR1/ADAM9/PTK2/ZEB2/LIMS1/FOS/PDE3A/SMAD2/EID2/JUN/PAK2/ZNF703/ZFP36L1/BCL9L/SRC/TRIM33/SLC2A10/SPRED2/CDKN1C | 84 |
| GO:0045577 | regulation of B cell differentiation | 19/3662 | 33/15509 | 2.87195e-05 | 0.000221673 | 0.00013331 | BAD/BTK/HMGB3/XBP1/SFRP1/IL7/BCL6/ID2/INHBA/IL10/IL2RG/ZFP36L2/MMP14/SYK/INPP5D/STAT5B/ZFP36L1/CR1/INPP5D | 19 |
| GO:0043484 | regulation of RNA splicing | 56/3662 | 144/15509 | 2.88651e-05 | 0.00022252 | 0.00013382 | PTBP1/CLK1/DAZAP1/FAM50A/MBNL3/ATXN7L3/FUS/CIRBP/RBFOX2/ESRP1/SNRNP70/C1QBP/DDX5/ZPR1/HSPA8/SRSF9/FAM172A/KAT2B/NCL/SRSF7/SRSF4/PTBP2/PRDX6/PTBP3/SMU1/AHNAK/RBM42/HNRNPH2/GRSF1/SRPK2/HNRNPA1/TAF5L/SRSF1/NCBP1/TMBIM6/SF3B4/PIK3R1/WTAP/RBMX/MBNL1/TAF6L/RBM15/CCNL1/FASTK/CDK12/HNRNPH1/TADA3/LARP7/ERN1/NPM1/RBM10/TRRAP/CCNL2/RBM15B/RBM8A/SRSF1 | 56 |
| GO:0045930 | negative regulation of mitotic cell cycle | 76/3662 | 211/15509 | 3.04682e-05 | 0.000234295 | 0.000140901 | FHL1/YTHDC2/NDC80/ZW10/BIRC5/CDC6/MSH2/ABL1/BMP7/RBBP8/NBN/CASP2/EZH2/CCL2/CCND1/FBXO5/CCNG1/RAD50/BCL6/CDC20/PKD2/TEX14/INHBA/CDKN1A/CDKN1C/BTG1/CCNB1/CDCA8/APC/IL10/NABP2/RB1/DTL/INTS3/CTDSP1/PLK2/SPC25/ZFP36L2/XPC/EME1/BTG2/PRMT2/BRSK1/MRNIP/RPL26/BRD7/WEE1/RFWD3/BUB1/AVEN/CDK1/TRIAP1/NABP1/ZWILCH/ANGEL2/CTDSP2/AURKAIP1/AURKB/CACNB4/CHEK2/FOXO4/MUC1/ZFP36L1/KANK2/GIGYF2/TNF/TNF/TNF/TNF/TNF/TNF/TNF/TNF/PRKDC/CDKN1C/PTEN | 76 |
| GO:1903050 | regulation of proteolysis involved in protein catabolic process | 76/3662 | 211/15509 | 3.04682e-05 | 0.000234295 | 0.000140901 | OSBPL7/RHBDF1/HFE/PSMC4/RNF14/UFL1/HERPUD1/HIPK2/ATXN3/SIRT2/CSNK2A2/PRKACA/MKRN2/SIRT6/UBE2K/GSK3B/XPO1/PSMC5/PSME1/HECTD1/BAG6/HSP90AB1/PSMC6/USP14/SMAD7/N4BP1/AXIN1/SGTA/GSK3A/DVL1/CTSC/USP5/PDCL3/PARK7/CDC20/RAD23B/CLU/PTK2B/USP9X/CBFA2T3/APOE/PSME3/HSPBP1/EGF/CSNK1D/GNA12/TLK2/OGT/EIF3H/ALAD/RNF144A/USP25/PSMC2/DISC1/RYBP/RCHY1/SHH/VCP/PSMC3/BTRC/EFNA1/PTK2/GLMN/MAGEF1/PRKN/USP7/SVIP/BAG6/BAG6/BAG6/BAG6/BAG6/CEBPA/PTEN/PRKACA/F8A1 | 76 |
| GO:0031668 | cellular response to extracellular stimulus | 83/3662 | 235/15509 | 3.06699e-05 | 0.000235554 | 0.000141658 | SNAI2/GLRX2/RRAGD/FAS/CASR/CLEC16A/HSPA5/EIF2AK2/ASNS/PTPRC/SEH1L/P2RX7/GCN1/COMT/SH3GLB1/XBP1/ADNP/NPRL3/SFRP1/TLE5/USF2/MAPK8/RNF167/HSPA8/FOLR1/CYP27B1/VDR/ITGA4/ELAPOR1/SLC2A1/FOXO3/TRIM24/CDKN1A/MAX/BECN1/ATG14/CD68/SESN2/PRKAA1/MYBBP1A/HNRNPA1/GLUL/TTC5/GABARAPL1/IGF1R/TNFRSF11A/PMAIP1/SESN3/FOXO1/NR4A2/KLF10/WIPI2/ARHGAP35/BRSK1/WNT4/VCAM1/ATF3/INHBB/ALB/RICTOR/AQP3/ZFYVE1/MN1/FOS/PPM1D/EIF2AK3/KAT5/BRSK2/LEP/LPL/FOSL1/PLEC/DCTPP1/GAS2L1/PRR5/AKR1C3/KANK2/MAP3K5/ATG7/MTOR/SIPA1/PTPRC/LOC102724560 | 83 |
| GO:0042770 | signal transduction in response to DNA damage | 62/3662 | 164/15509 | 3.07441e-05 | 0.000235832 | 0.000141825 | KDM1A/CRY1/SNAI2/CD74/CD44/USP28/RAD51/HIPK2/SP100/RPS6KA6/ZMPSTE24/ATRX/MSH2/ABL1/NBN/DOT1L/YJU2/CASP2/ZNHIT1/DDX5/CCND1/FOXM1/MAPK14/CCNG1/GADD45A/FOXO3/CDKN1A/SOX4/EEF1E1/SESN2/BRCA2/CUL4A/PMAIP1/DTL/DYRK3/PLK2/XPC/EME1/BRSK1/MRNIP/ZNF385A/RPL26/RFWD3/CDK1/PPM1D/TRIAP1/RHNO1/KAT5/GRB2/PTPN11/NPM1/CEP63/PTTG1IP/CHEK2/KMT5A/FOXO4/MUC1/H2AX/SPRED2/GIGYF2/PRKDC/MIF | 62 |
| GO:0002269 | leukocyte activation involved in inflammatory response | 26/3662 | 52/15509 | 3.08773e-05 | 0.000235977 | 0.000141913 | TYROBP/GRN/PTPRC/CTSC/IFNG/IL4/CLU/NR1D1/SYT11/IL6/APP/ITGB2/TLR3/CX3CR1/ITGAM/JUN/TRPV1/TNF/TNF/TNF/TNF/TNF/TNF/TNF/TNF/PTPRC | 26 |
| GO:0043551 | regulation of phosphatidylinositol 3-kinase activity | 26/3662 | 52/15509 | 3.08773e-05 | 0.000235977 | 0.000141913 | FGFR3/CDC42/EPHA8/PIK3IP1/PDGFB/FLT1/TGFB1/CCKBR/PDGFRB/CISH/TEK/PTK2B/FLT3/CCR7/ATG14/PDGFRA/CCL21/FGF2/PIK3R1/KIT/NOD2/PTK2/CCL19/CD19/SOCS1/SRC | 26 |
| GO:0070231 | T cell apoptotic process | 26/3662 | 52/15509 | 3.08773e-05 | 0.000235977 | 0.000141913 | ST3GAL1/FAS/BAK1/ARG2/BAX/P2RX7/CLC/PRKD2/KDELR1/JAK3/WNT5A/FASLG/GPAM/BCL11B/IL2RA/BCL2L11/TSC22D3/RAG1/FADD/LGALS9/PRELID1/EFNA1/PTCRA/CHEK2/CCL5/CCL5 | 26 |
| GO:0051656 | establishment of organelle localization | 126/3662 | 387/15509 | 3.17263e-05 | 0.000242167 | 0.000145635 | PAFAH1B1/TRAPPC6A/STARD3NL/BTK/SPAST/CENPQ/GAB2/C12orf4/SYNE2/ATP9A/CDH3/AP3D1/NTN1/AP3M2/CDC42/FBXW11/NDE1/LLGL2/PICALM/MLH1/SPAG5/STXBP2/IL4R/PCM1/NDC80/XPO1/PIBF1/SEH1L/CHMP5/TMED2/LAT2/ZW10/NSFL1C/BIRC5/NUDC/SNAP29/MYH9/CHMP4B/GATA1/RAB11A/KXD1/PIK3CG/YKT6/LIN7A/IFNG/IL4/ARL6/KAT2B/SNX4/TTL/ITGA4/SDC1/TRAK2/VAMP8/PPP6C/NR4A3/WDR11/BECN1/UXT/RAC2/NECTIN2/CHMP1A/SYT11/AP3B1/CCNB1/PSRC1/CDCA8/BICDL1/LTV1/SPRY2/STXBP1/KIF13A/NUMA1/NUSAP1/CENPE/BBS4/CSNK1D/KIF2C/SNAPIN/CENPC/BOD1/CPLX2/PARD3/ITGB1/BICD1/GJA1/UCHL1/KIT/COPG2/TRAPPC10/LMNA/FYCO1/CDK5/GEM/SYK/CCDC186/BORCS7/LGALS9/NMD3/TRAPPC1/PDCD6IP/KIF5B/CFL1/KAT5/CHMP6/SYNE3/AURKB/MAPK15/NPM1/EXOC7/TRAK1/AP3M1/PRKN/HGS/CLN3/BLOC1S3/SDAD1/KIFC1/EIF6/PDCD6/TRAPPC2B/IKBKG/NDE1/NEFL/SPICE1/F8A1 | 126 |
| GO:0030168 | platelet activation | 50/3662 | 125/15509 | 3.18018e-05 | 0.000242445 | 0.000145802 | CD9/ACTB/PDGFB/MYH9/CTSG/CD40/GATA1/CD40LG/DGKH/PIK3CG/HSPB1/VWF/SH2B3/MAPK14/FN1/MPL/GNA13/APOE/PDGFRA/SERPINE2/IL6/STXBP1/TLR4/ADAMTS18/MERTK/DGKE/PRKCA/GNAQ/DMTN/ADAMTS13/PF4/PRKCD/F2RL2/NOS3/SYK/FUNDC2/C1GALT1C1/FGG/FGA/SELP/F2/F2R/ADRA2C/PLSCR1/BLOC1S3/PPIA/SRC/HBB/ITGB3/ADAMTS13 | 50 |
| GO:0048771 | tissue remodeling | 58/3662 | 151/15509 | 3.20519e-05 | 0.000244051 | 0.000146768 | WNT16/CD38/BAK1/FLT4/TIE1/ROCK1/NOX4/BAX/MMP2/P2RX7/RASSF2/ACP5/CSK/SFRP1/IL7/TGFB1/HAMP/PTN/MDK/CALCA/VDR/IL12B/IL1A/EPAS1/LEPR/TNFAIP3/ARG1/SPP1/PTK2B/IAPP/LIF/NOTCH2/IL6/IL21/DEF8/TNFRSF11A/EPHA2/IL18/GJA1/PRKCA/MMP14/RUNX1/TNFRSF11B/NOS3/SYK/RBPJ/INPP5D/ADRB2/S1PR1/GPR137/CSPG4/LEP/F2R/CSF1R/SRC/ITGB3/LOC102724560/INPP5D | 58 |
| GO:0006766 | vitamin metabolic process | 44/3662 | 106/15509 | 3.21572e-05 | 0.000244552 | 0.00014707 | NPC1L1/SNAI2/SLC2A3/SLC46A1/MCCC1/LRP2/SLC23A2/ABCC1/PNPO/FOLR1/CYP27B1/IFNG/PPARD/MTR/SLC2A1/SLC19A2/UBIAD1/ALDH1A2/CBLIF/MMAB/CYP1A1/GSTO1/CYP3A4/GFI1/AMN/NNMT/MMADHC/SLC19A1/SHMT1/NQO1/TCN2/SLC52A2/AKR1C3/TNF/TNF/TNF/TNF/TNF/TNF/TNF/TNF/PDXP/THTPA/ABCC1 | 44 |
| GO:1903076 | regulation of protein localization to plasma membrane | 43/3662 | 103/15509 | 3.33735e-05 | 0.000253491 | 0.000152445 | ITGA3/EPHA3/ATP2B4/PICALM/ACTB/HECTD1/CSK/TGFB1/RANGRF/IFNG/TMEM59/VAMP8/LRP1/ACSL3/PPFIA1/EPHB2/EPHA2/STAC/PIK3R1/EGFR/ITGB1/MMP14/APPL1/RER1/LDLRAP1/AP2M1/GPER1/CDK5/KIF5B/PRKCE/BCL2L1/CIB1/STAC3/CLN3/TNF/TNF/TNF/TNF/TNF/TNF/TNF/TNF/SQSTM1 | 43 |
| GO:0036035 | osteoclast development | 14/3662 | 21/15509 | 3.38899e-05 | 0.000257098 | 0.000154614 | PAFAH1B1/TYROBP/LTF/ATP6AP1/LILRB1/NOTCH2/SLC9B2/FAM20C/ANXA2/SRC/LILRB1/LILRB1/LILRB1/LILRB1 | 14 |
| GO:0050817 | coagulation | 77/3662 | 215/15509 | 3.39761e-05 | 0.000257438 | 0.000154819 | SLC4A1/CD9/F7/LMAN1/ACTB/FBLN1/CD59/APOH/PDGFB/MYH9/CTSG/PROCR/CD40/GATA1/CD40LG/DGKH/PLAT/TFPI2/PIK3CG/HSPB1/SERPINE1/HGFAC/VWF/SH2B3/MAPK14/FN1/MPL/SERPINC1/GNA13/SEMG1/F13A1/APOE/AP3B1/EPHB2/PDGFRA/CD36/SERPINE2/IL6/STXBP1/TLR4/THBS1/ADAMTS18/GNA12/AK3/MERTK/DGKE/PRKCA/GNAQ/DMTN/ADAMTS13/PF4/PRKCD/ANXA5/F2RL2/SHH/NOS3/SYK/FUNDC2/HPS6/PRDX2/C1GALT1C1/FGG/FGA/JMJD1C/SELP/F2/F2R/ANXA2/ADRA2C/PLSCR1/BLOC1S3/PPIA/SRC/F5/HBB/ITGB3/ADAMTS13 | 77 |
| GO:0021915 | neural tube development | 57/3662 | 148/15509 | 3.41387e-05 | 0.000258354 | 0.000155369 | PRKACA/GLI2/PLXNA2/TULP3/LRP2/TMED2/KDM2B/HECTD1/ABL1/CECR2/MTHFD1/BMP7/TSC2/RPGRIP1L/SFRP1/TGFB1/DVL1/FOLR1/NPHP3/WNT5A/HES1/PKD2/MTHFD1L/GORAB/SOX4/ALDH1A2/RARA/CPLANE2/BBS4/EPHA2/NOTCH1/NODAL/SKI/ARHGAP35/DVL3/VANGL2/CASP3/SHH/SEMA4C/ARL13B/RARG/KAT5/GLMN/SETD2/RGMA/NOG/ZFP36L1/RNF220/ZNF358/BRD2/TCTN1/BRD2/BRD2/BRD2/BRD2/MARCKS/PRKACA | 57 |
| GO:0002688 | regulation of leukocyte chemotaxis | 48/3662 | 119/15509 | 3.51819e-05 | 0.000265924 | 0.000159922 | CD74/F7/SPI1/DNM1L/PTN/SERPINE1/CREB3/CXCL12/C1QBP/CCL2/MDK/NEDD9/IL4/WNT5A/PADI2/PGF/PTK2B/CCR7/RAC2/MTUS1/IL6/CCN3/CCL21/THBS1/CYP19A1/SLIT2/VEGFC/CXCL13/IL6R/NOD2/CX3CR1/LGALS9/PTK2/CXCL8/CCL19/CALR/CXCR2/CSF1R/CSF1/HMGB1/DPP4/ZNF580/CCL5/CCL5/CCL4/CCL4/MIF/CCL4 | 48 |
| GO:0034605 | cellular response to heat | 28/3662 | 58/15509 | 3.53198e-05 | 0.000266641 | 0.000160353 | ATXN3/PRKACA/GSK3B/HSP90AB1/RBBP7/DNAJB6/CHORDC1/IL1A/THBS1/POLR2D/STAC/BAG3/CLPB/IER5/MAPKAPK2/VCP/IRAK1/TRPV1/MTOR/DAXX/DAXX/HSBP1L1/DAXX/DAXX/DAXX/PDCD6/CHORDC1/PRKACA | 28 |
| GO:0022602 | ovulation cycle process | 23/3662 | 44/15509 | 3.54622e-05 | 0.00026739 | 0.000160804 | HSPA5/PGR/MMP2/ESR1/CASP2/MAP2K6/FOXO3/INHBA/PDGFRA/ARRB2/SLIT2/GAS2/ADAMTS1/CASP3/GDF9/NOS3/STAT5B/LEP/FZD4/A2M/SLIT3/ZP3/SRC | 23 |
| GO:0018393 | internal peptidyl-lysine acetylation | 63/3662 | 168/15509 | 3.55193e-05 | 0.000267496 | 0.000160867 | NFYA/KMT2E/MED24/BAZ1B/SNAI2/FOXP3/NFYC/SPI1/MBD3/ACTB/ZMPSTE24/ATXN7L3/BRPF3/BAG6/SMARCB1/JADE3/GATA3/NAA40/ZNF451/KAT2B/SF3B1/PARK7/DR1/NAA50/MORF4L2/DEK/YEATS4/LIF/MYBBP1A/WBP2/TAF5L/EPC2/IRF4/ATAT1/BRCA2/SMAD4/OGT/KAT14/MBIP/SMARCA5/BRPF1/CTBP1/TAF6L/PYGO2/BRD7/SETD5/TADA3/HCFC1/KAT5/MSL2/TAF7/MUC1/NOC2L/WDR5/TRRAP/BAG6/BAG6/BAG6/BAG6/BAG6/SMARCB1/TADA2A/PCGF2 | 63 |
| GO:0007435 | salivary gland morphogenesis | 20/3662 | 36/15509 | 3.61189e-05 | 0.000271681 | 0.000163384 | SNAI2/HGF/FGFR2/BMP7/LAMA1/TGFB1/TWSG1/LAMA5/EGFR/SHH/DAG1/TGM2/TNF/TNF/TNF/TNF/TNF/TNF/TNF/TNF | 20 |
| GO:0070228 | regulation of lymphocyte apoptotic process | 29/3662 | 61/15509 | 3.69922e-05 | 0.000277576 | 0.000166929 | ST3GAL1/BTK/CD74/ARG2/BAX/P2RX7/BIRC7/PRKD2/JAK3/BCL6/WNT5A/GPAM/BCL11B/IL10/BCL2L11/TSC22D3/RAG1/FADD/LGALS9/PRELID1/EFNA1/PTCRA/ORMDL3/AURKB/NOC2L/CCL5/CCL5/MIF/PTEN | 29 |
| GO:2000379 | positive regulation of reactive oxygen species metabolic process | 29/3662 | 61/15509 | 3.69922e-05 | 0.000277576 | 0.000166929 | TYROBP/CYBA/PDGFB/TGFB1/MAPK14/PDGFRB/PARK7/GADD45A/FOXO3/PTK2B/CDKN1A/CD36/TLR4/THBS1/CYP1B1/SOD1/ITGB2/TGFBR2/PRKCD/SYK/ITGAM/LEP/GRIN1/GRB2/F2/ADGRB1/AKR1C3/SLC5A3/CD177 | 29 |
| GO:0051235 | maintenance of location | 103/3662 | 306/15509 | 3.70997e-05 | 0.000278046 | 0.000167212 | CIAPIN1/SCIN/PAFAH1B1/CRY1/CD4/CPS1/HSPA5/HEXB/CYBA/SOAT1/AP3D1/SP100/PRKACA/LMAN1/PTPRC/APOB/FTL/BAX/FKBP1A/P2RX7/ABL1/RANGAP1/NFKBIA/SQLE/FCER2/KDELR1/PPARD/PDE4D/SKP1/DBN1/SLC30A3/PARK7/FASLG/PKD2/PTK2B/CRY2/SRGN/IL1B/SLC25A23/C3/CCR7/APOE/SYNE1/CD36/IL6/IL10/CCL21/TAF8/SORL1/ITGAV/COX17/FGF2/FBN2/BBS4/CALM2/OSBPL11/ANK2/GSN/LCN2/GSTO1/ITPR1/RER1/CALM3/CCR5/SELENON/SLC30A7/ALB/GPER1/CDK5/ZFYVE1/FTH1/LETM1/PRKCE/CCL19/STAT5B/RNF213/LEP/DDIT3/PTPN2/LPL/CD19/CALR/F2/F2R/SLC8A1/TRPV1/GM2A/SPOUT1/TNF/TMSB4X/TNF/TNF/TNF/TNF/TNF/TNF/TNF/PISD/TWF2/ITGB3/PTPRC/RASA3/PRKACA | 103 |
| GO:0043414 | macromolecule methylation | 101/3662 | 299/15509 | 3.74586e-05 | 0.000280397 | 0.000168626 | NFYA/KDM1A/KMT2E/PAF1/AASS/ARID4B/PRDM1/KDM4A/NFYC/SPI1/BUD23/MBD3/ZMPSTE24/ATRX/MECOM/DNMT3B/SMARCB1/SNRPD3/PCIF1/SETD6/DOT1L/FBL/GSK3A/EZH2/GATA3/TRDMT1/EZH1/NSD2/NOP2/HCFC2/MACROH2A1/KDM3A/ASH1L/NSUN4/MYB/PHF19/DNMT3A/HELLS/EEF1AKMT3/H1-3/PRMT1/ASH2L/PRDM12/DNMT1/PRMT7/MEN1/CMTR1/ALKBH8/THUMPD2/TET1/SNRPF/SKIC8/CYP1A1/SMAD4/CARM1/METTL25B/PARP1/SNRPG/BOD1/WTAP/OGT/NSD3/SMARCA5/RNF20/BTG2/PRMT2/LMNA/GFI1/RBM15/PYGO2/NSD1/NNMT/SNRPD1/GATAD2A/SETD5/H1-4/FOS/MGMT/PPM1D/COPRS/HCFC1/TRMT112/TDRD12/LARP7/WDR6/SUZ12/SETD2/SETD3/KMT5A/TET3/H1-2/TRMT2B/PAX5/WDR5/WDR5B/NCOA6/PCMTD2/RBM15B/SMARCB1/PAGR1/EMG1 | 101 |
| GO:0010586 | miRNA metabolic process | 39/3662 | 91/15509 | 3.76881e-05 | 0.000281177 | 0.000169095 | NGFR/SPI1/TUT7/PDGFB/TGFB1/GATA3/BMPR1A/DDX5/PPARD/MYB/FOXO3/EGR1/BMP2/RARA/IL10/SMAD6/FGF2/SMAD4/TERT/FOS/RELA/HRAS/FOSL1/JUN/LILRB4/TEAD1/MRTFA/TNF/TNF/TNF/TNF/TNF/TNF/TNF/TNF/GAS5/LILRB4/LILRB4/LILRB4 | 39 |
| GO:0048145 | regulation of fibroblast proliferation | 39/3662 | 91/15509 | 3.76881e-05 | 0.000281177 | 0.000169095 | IGF1/CD74/NGFR/FOSL2/SIRT6/ZMPSTE24/BAX/ESR1/CDC6/ABL1/PDGFB/SFRP1/MED25/ZMIZ1/PDGFRB/WNT5A/FN1/CDKN1A/LIF/CCNB1/PDGFRA/CCNA2/PDGFC/EGFR/SKI/TP53INP1/FTH1/LIG4/HRAS/JUN/C1QL4/LTA/LTA/LTA/LTA/LTA/BRK1/ITGB3/MIF | 39 |
| GO:0042886 | amide transport | 99/3662 | 292/15509 | 3.77438e-05 | 0.000281177 | 0.000169095 | BAD/CD38/HFE/CD74/CASR/NNAT/SLC46A1/SIRT6/LRP2/OXCT1/ABCB1/RAPGEF4/PCK2/VAPA/ABCC1/SFRP1/PLEKHA8/TFR2/PPP3CB/FOLR1/PSMD9/IFNG/PPARD/PASK/PARK7/SLC19A2/ABCG2/CRHR1/SNX19/SERP1/SOX4/ABCC4/IL1B/NR1D1/PER2/HNF1A/GLUL/IL6/IL1RN/CCN3/SLC15A4/GLTP/SLC47A1/ENSA/EPHA5/SLC16A2/CAMK2G/GLUD1/TCF7L2/FOXO1/GJA1/SLC13A3/INHBB/AIMP1/SLC9B2/GPER1/AQP3/CCDC186/TAP1/PRKCE/FGG/FGA/SLC19A1/BRSK2/LEP/SMAD2/PTPN11/MAFA/PRKN/KCNJ11/TRPV1/PIM3/SELENOT/TAP2/TNF/TAP2/TAP1/TAP2/TNF/TAP2/TNF/TAP1/TAP2/TAP1/TAP1/TNF/TAP2/TNF/TNF/TNF/TAP1/TAPBP/TAP2/TNF/TAP2/RASL10B/CCL5/CCL5/ABCC1 | 99 |
| GO:0044843 | cell cycle G1/S phase transition | 78/3662 | 219/15509 | 3.77444e-05 | 0.000281177 | 0.000169095 | KMT2E/DBF4/PAF1/FHL1/ARID1B/ATP2B4/ACTB/PSME1/CDC6/CDC7/BCL7C/SMARCB1/CDKN3/APEX1/RBBP8/CCNE1/CASP2/EZH2/RPS6KB1/SMARCD2/CCL2/ZPR1/CCND1/BCL7A/CCND3/PPP2CA/ID2/ARID1A/PKD2/PPP6C/INHBA/CDKN1A/PSME3/MEN1/CCNH/APC/RDX/RB1/CUL4A/CYP1A1/CTDSP1/CCNA2/PLK2/EGFR/ITGB1/CACUL1/ADAMTS1/LSM11/APPL1/CUL4B/PRMT2/RPL26/GFI1/TERT/CDK5/BRD7/WEE1/RRM1/RFWD3/MN1/TRIAP1/RRM2/KLF11/CTDSP2/CCNE2/CACNB4/PLCB1/CHEK2/CDK10/MUC1/ARID2/KANK2/TFDP1/GIGYF2/PRKDC/SMARCB1/PAGR1/PTEN | 78 |
| GO:0048608 | reproductive structure development | 93/3662 | 271/15509 | 3.80848e-05 | 0.000283373 | 0.000170415 | HOXA11/BAK1/HSPA5/ARID4B/MSH4/FGFR2/TP63/HOXA9/LRP2/PGR/ATRX/BAX/MMP2/ESR1/MSH2/BMP7/GATA1/PCYT1B/SFRP1/CASP2/TGFBR1/GATA3/CCND1/PDGFRB/WNT5A/IL1A/SDC1/ASH1L/KDM5B/FOXO3/EIF2B2/TNFSF10/INHBA/MEA1/C3/EIF2S2/KDR/SOX15/BCL2L2/RARA/HSD17B4/PDGFRA/SERPINE2/NKX2-1/CYP19A1/CYP1B1/BRCA2/GREB1L/ARRB2/SMAD4/SOD1/RAB13/REN/SLIT2/NOTCH1/GAS2/ARID5B/DHX37/BCL2L11/BMP6/MERTK/ADAMTS1/MMP14/KIT/WNT4/H3-3A/INHBB/CASP3/TLR3/GDF9/SHH/NOS3/FRS2/ZFPM2/BCL2L1/CEBPB/CYP7B1/RARG/STAT5B/LEP/FZD4/A2M/PTPN11/PLAG1/NOG/SLIT3/ZP3/AKR1C3/SRC/NTRK1/FANCG/HOXA10/PTEN | 93 |
| GO:0050792 | regulation of viral process | 55/3662 | 142/15509 | 3.86504e-05 | 0.000287236 | 0.000172739 | CD4/LTF/CD74/EIF2AK2/MID2/MAVS/N4BP1/TRIM14/AICDA/STAT1/NR5A2/TRIM25/CXCR4/STAU1/ZFP36/NECTIN2/TOP2A/TRIM5/TRIM22/SRPK2/MDFIC/TARBP2/FURIN/GSN/NOTCH1/HMGA2/MBL2/TRIM68/LGALS9/CXCL8/TRIM8/LARP7/PDE12/BANF1/TMEM39A/CD28/CIITA/IFITM1/HEXIM1/PLSCR1/HMGB1/PPIA/TNF/TRIM13/TNF/TNF/TNF/TNF/TNF/TNF/TNF/TRIM26/TMEM250/CCL5/CCL5 | 55 |
| GO:0002562 | somatic diversification of immune receptors via germline recombination within a single locus | 31/3662 | 67/15509 | 3.92734e-05 | 0.000291168 | 0.000175103 | PARP3/FOXP3/TCF3/TBX21/MLH1/PTPRC/MSH2/CD40/CD40LG/NBN/IL27RA/TGFB1/EXOSC3/NSD2/AICDA/IL4/BCL6/SHLD2/BCL11B/NDFIP1/IL10/SLC15A4/DCAF1/TNFSF13/RAG1/LIG4/RAG2/CD28/HMGB1/PRKDC/PTPRC | 31 |
| GO:0016444 | somatic cell DNA recombination | 31/3662 | 67/15509 | 3.92734e-05 | 0.000291168 | 0.000175103 | PARP3/FOXP3/TCF3/TBX21/MLH1/PTPRC/MSH2/CD40/CD40LG/NBN/IL27RA/TGFB1/EXOSC3/NSD2/AICDA/IL4/BCL6/SHLD2/BCL11B/NDFIP1/IL10/SLC15A4/DCAF1/TNFSF13/RAG1/LIG4/RAG2/CD28/HMGB1/PRKDC/PTPRC | 31 |
| GO:0050848 | regulation of calcium-mediated signaling | 36/3662 | 82/15509 | 3.98143e-05 | 0.000292814 | 0.000176093 | CD4/PTBP1/CD22/IGF1/ATP2B4/ERBB3/GSK3B/P2RX5/NFAT5/PPP3CB/ZAP70/FHL2/PTK2B/DYRK2/CALM2/ITPR1/SPPL3/CALM3/SYK/CHP2/HINT1/CIB1/P2RX2/MTOR/TNF/TNF/STIMATE/TNF/TNF/TNF/TNF/TNF/TNF/CCL4/CCL4/CCL4 | 36 |
| GO:0031294 | lymphocyte costimulation | 24/3662 | 47/15509 | 3.98184e-05 | 0.000292814 | 0.000176093 | CD40LG/CSK/MAP3K8/EFNB3/CD5/CD81/IL4/CD86/CD160/CD80/CCR7/CCL21/TNFRSF13C/CCL19/CD28/PTPN11/LILRB4/SRC/DPP4/PDCD1LG2/CD24/LILRB4/LILRB4/LILRB4 | 24 |
| GO:0033628 | regulation of cell adhesion mediated by integrin | 24/3662 | 47/15509 | 3.98184e-05 | 0.000292814 | 0.000176093 | SNAI2/EPHA8/FERMT1/PIEZO1/PIK3CG/SERPINE1/LPXN/LIF/PODXL/CCL21/CYP1B1/EPHA2/CXCL13/SYK/ADAM9/EFNA1/PTK2/PTPN11/CIB1/MUC1/DPP4/ITGB3/CCL5/CCL5 | 24 |
| GO:0002292 | T cell differentiation involved in immune response | 32/3662 | 70/15509 | 3.99196e-05 | 0.000292814 | 0.000176093 | TMEM98/FOXP3/TBX21/IL4R/IL12RB1/SMAD7/JAK3/GATA3/IFNG/IL12B/IL4/BCL6/CD86/MYB/CD80/RARA/IL6/HLX/IRF4/IL21/IL18/IL6R/LGALS9/CCL19/HMGB1/ENTPD7/MTOR/HLA-DRA/HLA-DRA/HLA-DRA/HLA-DRA/HLA-DRA | 32 |
| GO:0002438 | acute inflammatory response to antigenic stimulus | 18/3662 | 31/15509 | 3.99408e-05 | 0.000292814 | 0.000176093 | BTK/FCGR2B/GATA3/PARK7/C3/CCR7/A2M/CXCR2/ZP3/ELANE/HLA-E/HLA-E/HLA-E/HLA-E/HLA-E/HLA-E/HLA-E/ELANE | 18 |
| GO:0034114 | regulation of heterotypic cell-cell adhesion | 18/3662 | 31/15509 | 3.99408e-05 | 0.000292814 | 0.000176093 | CD44/CEACAM6/BMP7/IL1B/IL10/IL1RN/FGG/FGA/ADIPOQ/MBP/TNF/TNF/TNF/TNF/TNF/TNF/TNF/TNF | 18 |
| GO:0045663 | positive regulation of myoblast differentiation | 18/3662 | 31/15509 | 3.99408e-05 | 0.000292814 | 0.000176093 | ARID1B/ACTB/SMARCB1/SMARCD2/MAPK14/ARID1A/SOX4/BTG1/IGFBP3/XKR8/RANBP3L/HIF1AN/BRD7/KAT5/PLCB1/ARID2/MAP3K5/SMARCB1 | 18 |
| GO:0060055 | angiogenesis involved in wound healing | 18/3662 | 31/15509 | 3.99408e-05 | 0.000292814 | 0.000176093 | ADIPOR2/MCAM/XBP1/SERPINE1/SMOC2/TNFAIP3/CXCR4/KDR/DAG1/TNF/TNF/TNF/TNF/TNF/TNF/TNF/TNF/ITGB3 | 18 |
| GO:0070920 | regulation of production of small RNA involved in gene silencing by RNA | 18/3662 | 31/15509 | 3.99408e-05 | 0.000292814 | 0.000176093 | ZMPSTE24/ESR1/TGFB1/DDX5/MYCN/IL6/TARBP2/EGFR/TERT/TRUB1/TNF/TNF/TNF/TNF/TNF/TNF/TNF/TNF | 18 |
| GO:0070886 | positive regulation of calcineurin-NFAT signaling cascade | 16/3662 | 26/15509 | 4.00623e-05 | 0.000292814 | 0.000176093 | PTBP1/IGF1/ERBB3/PPP3CB/SPPL3/CHP2/CIB1/TNF/TNF/STIMATE/TNF/TNF/TNF/TNF/TNF/TNF | 16 |
| GO:0106058 | positive regulation of calcineurin-mediated signaling | 16/3662 | 26/15509 | 4.00623e-05 | 0.000292814 | 0.000176093 | PTBP1/IGF1/ERBB3/PPP3CB/SPPL3/CHP2/CIB1/TNF/TNF/STIMATE/TNF/TNF/TNF/TNF/TNF/TNF | 16 |
| GO:1902004 | positive regulation of amyloid-beta formation | 16/3662 | 26/15509 | 4.00623e-05 | 0.000292814 | 0.000176093 | PICALM/GSK3A/IFNG/CLU/SLC2A13/CASP3/EFNA1/RELA/TNF/TNF/TNF/TNF/TNF/TNF/TNF/TNF | 16 |
| GO:0050000 | chromosome localization | 35/3662 | 79/15509 | 4.01878e-05 | 0.000293385 | 0.000176437 | IFFO1/CENPQ/NDE1/MLH1/SPAG5/NDC80/PIBF1/SEH1L/CHMP5/ZW10/BIRC5/NUDC/CHMP4B/RAB11A/KAT2B/TTL/BECN1/CHMP1A/CCNB1/PSRC1/CDCA8/NUMA1/ACTR2/CENPE/KIF2C/CENPC/BOD1/LMNA/GEM/KAT5/CHMP6/AURKB/KIFC1/NDE1/SPICE1 | 35 |
| GO:0030518 | intracellular steroid hormone receptor signaling pathway | 45/3662 | 110/15509 | 4.04707e-05 | 0.000295103 | 0.00017747 | KDM1A/CRY1/RNF14/UFL1/PLPP1/RHOA/TP63/PIAS2/PGR/ESR1/RBFOX2/SFRP1/ZMIZ1/DDX5/KDM3A/PARK7/HDAC1/PADI2/ARID1A/CRY2/PKN1/CNOT1/YWHAH/WBP2/CARM1/PARP1/CNOT9/POU4F2/NODAL/PRMT2/HEYL/GPER1/TRIM68/TADA3/CYP7B1/TAF7/CALR/SRC/KANK2/DAXX/DAXX/DAXX/DAXX/DAXX/PAGR1 | 45 |
| GO:0032956 | regulation of actin cytoskeleton organization | 107/3662 | 321/15509 | 4.18564e-05 | 0.000304848 | 0.00018333 | SCIN/EPHA3/CYFIP2/RHOA/ROCK1/SPTB/CDC42/WDR1/ARHGEF10L/ADD2/ACTN2/ADD1/PXN/ABL1/HCK/COTL1/PYCARD/TJP1/SFRP1/ARHGEF10/MTPN/MET/TGFBR1/CXCL12/CSF3/MDK/ARPC3/FZD10/NEDD9/PDGFRB/DBN1/IL1A/CAPZA1/STMN1/TEK/PTK2B/LRP1/DSTN/ID1/CCR7/CDC42EP1/RAC2/ARPC1B/PPFIA1/WASF3/NOTCH2/PDGFRA/DBNL/CCL21/RDX/ABI2/BBS4/ARHGDIA/SMAD4/ABL2/RHOB/SLIT2/EPHA5/PIK3R1/IQGAP2/ARHGAP18/C9orf72/GSN/CDC42EP2/PLEKHH2/DMTN/ARHGAP35/SPTBN4/ALOX15/WNT4/ARPC5/ANKRD23/CDC42EP3/SPTA1/PRKCD/ARFIP1/RICTOR/CDK5/TTC8/RHOH/SEMA3E/S1PR1/PRKCE/CCL11/SPTBN2/HRAS/CDK5R1/FLII/GRB2/PAK2/CSF1R/CDK10/PRKN/NF2/CD47/GMFB/SPTAN1/MTOR/IQANK1/TMSB4X/PDXP/ARPC1A/TWF2/SHANK3/BRK1/ITGB3/TJP1 | 107 |
| GO:2001242 | regulation of intrinsic apoptotic signaling pathway | 57/3662 | 149/15509 | 4.272e-05 | 0.000310773 | 0.000186893 | BAD/KDM1A/NOX1/SNAI2/CD74/CD44/HERPUD1/TMEM161A/BAX/DNM1L/XBP1/MMP9/PYCARD/URI1/GSDME/HSPB1/CREB3/CXCL12/PPIF/SEPTIN4/PTPMT1/PARK7/HDAC1/HELLS/CLU/PLAGL2/BECN1/TRAP1/STYXL1/BCL2L2/EPO/SERINC3/BCL2L10/TMBIM6/PMAIP1/SOD1/PARP1/NONO/BCL2L11/ZNF385A/RPL26/TRIAP1/BCL2L1/EIF2AK3/DDIT3/PTPN2/GRINA/PTTG1IP/PRKN/MUC1/NOC2L/PPIA/SRC/NDUFS3/FIS1/MAGEA3/MIF | 57 |
| GO:1904375 | regulation of protein localization to cell periphery | 49/3662 | 123/15509 | 4.30188e-05 | 0.00031258 | 0.00018798 | ITGA3/EPHA3/ATP2B4/PICALM/ACTB/GPC4/HECTD1/CSK/TGFB1/RANGRF/IFNG/TMEM59/VAMP8/LRP1/RAB38/ACSL3/PPFIA1/EPHB2/NUMA1/EPHA2/STAC/PIK3R1/EGFR/ITGB1/MMP14/APPL1/RER1/LDLRAP1/EPB41/AP2M1/GPER1/CDK5/KIF5B/PRKCE/BCL2L1/DAG1/HRAS/CIB1/STAC3/CLN3/TNF/TNF/TNF/TNF/TNF/TNF/TNF/TNF/SQSTM1 | 49 |
| GO:0002577 | regulation of antigen processing and presentation | 13/3662 | 19/15509 | 4.33327e-05 | 0.000314124 | 0.000188909 | HFE/SLC11A1/CD74/FCGR2B/PYCARD/NOD1/CCR7/CD68/CCL21/THBS1/NOD2/CCL19/HLA-DOA | 13 |
| GO:0090201 | negative regulation of release of cytochrome c from mitochondria | 13/3662 | 19/15509 | 4.33327e-05 | 0.000314124 | 0.000188909 | IGF1/HGF/BAK1/PPIF/CLU/BCL2L2/ARRB2/LMNA/FXN/PRELID1/TRIAP1/BCL2L1/PRKN | 13 |
| GO:0007596 | blood coagulation | 76/3662 | 213/15509 | 4.39846e-05 | 0.000318409 | 0.000191486 | SLC4A1/CD9/F7/LMAN1/ACTB/FBLN1/CD59/APOH/PDGFB/MYH9/CTSG/PROCR/CD40/GATA1/CD40LG/DGKH/PLAT/TFPI2/PIK3CG/HSPB1/SERPINE1/HGFAC/VWF/SH2B3/MAPK14/FN1/MPL/SERPINC1/GNA13/F13A1/APOE/AP3B1/EPHB2/PDGFRA/CD36/SERPINE2/IL6/STXBP1/TLR4/THBS1/ADAMTS18/GNA12/AK3/MERTK/DGKE/PRKCA/GNAQ/DMTN/ADAMTS13/PF4/PRKCD/ANXA5/F2RL2/SHH/NOS3/SYK/FUNDC2/HPS6/PRDX2/C1GALT1C1/FGG/FGA/JMJD1C/SELP/F2/F2R/ANXA2/ADRA2C/PLSCR1/BLOC1S3/PPIA/SRC/F5/HBB/ITGB3/ADAMTS13 | 76 |
| GO:1904029 | regulation of cyclin-dependent protein kinase activity | 43/3662 | 104/15509 | 4.40265e-05 | 0.000318409 | 0.000191486 | IPO5/ACTB/CCNK/CDC6/HSP90AB1/PDGFB/CDKN3/CCNE1/BCCIP/CCND1/GTF2H1/CCND3/CCNG1/KAT2B/CNPPD1/GADD45A/TNFAIP3/PKD2/CCNI/CDKN1A/PKMYT1/CDKN1C/CCNA1/MEN1/CCNB1/PSRC1/CCNH/APC/HERC5/CCNA2/EGFR/HHEX/CCNL1/CASP3/CKS1B/CCNE2/CDK5R1/HEXIM1/SRC/IPO7/CEBPA/CDKN1C/PTEN | 43 |
| GO:0000079 | regulation of cyclin-dependent protein serine/threonine kinase activity | 42/3662 | 101/15509 | 4.57722e-05 | 0.000330264 | 0.000198615 | IPO5/ACTB/CCNK/CDC6/PDGFB/CDKN3/CCNE1/BCCIP/CCND1/GTF2H1/CCND3/CCNG1/KAT2B/CNPPD1/GADD45A/TNFAIP3/PKD2/CCNI/CDKN1A/PKMYT1/CDKN1C/CCNA1/MEN1/CCNB1/PSRC1/CCNH/APC/HERC5/CCNA2/EGFR/HHEX/CCNL1/CASP3/CKS1B/CCNE2/CDK5R1/HEXIM1/SRC/IPO7/CEBPA/CDKN1C/PTEN | 42 |
| GO:0034446 | substrate adhesion-dependent cell spreading | 42/3662 | 101/15509 | 4.57722e-05 | 0.000330264 | 0.000198615 | PKP2/RHOA/CDC42/ST6GAL1/FBLN1/ITGA8/PXN/ABL1/OLFM4/ATRNL1/C1QBP/LPXN/MDK/CORO1C/NEDD9/BVES/ITGA4/FN1/TEK/LAMA5/LAMC1/ITGAV/PIK3R1/MERTK/DMTN/MELTF/EFNA1/PTK2/ANTXR1/LIMS1/FGG/FGA/LAMB2/FZD4/RCC2/CALR/EPHB3/CIB1/SPRY4/SRC/PARVA/ITGB3 | 42 |
| GO:0050764 | regulation of phagocytosis | 41/3662 | 98/15509 | 4.74729e-05 | 0.000342136 | 0.000205755 | BTK/SLC11A1/CYBA/FCGR2B/PTPRC/HCK/PYCARD/CSK/CCL2/IFNG/IL1B/C3/SYT11/SFTPD/CD36/ITGAV/SOD1/IL2RG/MERTK/APPL1/ALOX15/SYK/MBL2/NOD2/CALR/ADIPOQ/PLSCR1/HMGB1/PRTN3/CD47/TGM2/TNF/TNF/TNF/TNF/TNF/TNF/TNF/TNF/PTPRC/PRTN3 | 41 |
| GO:0001889 | liver development | 51/3662 | 130/15509 | 4.90793e-05 | 0.000353303 | 0.00021247 | HGF/CPS1/CSNK2A2/ZMPSTE24/SMARCB1/XBP1/ACO2/PCK2/RPGRIP1L/HAMP/PTN/MET/EZH2/CCND1/MDK/NPHP3/HES1/TNFAIP3/ARG1/PKD2/ELK1/ALDH1A2/ASS1/RARA/NOTCH2/HNF1A/IL6/HLX/IL10/CYP1A1/NOTCH1/ARID5B/NODAL/WNT4/FRZB/CEBPB/RELA/TYMS/JUN/IGF2R/PHF2/TNF/TNF/TNF/TNF/TNF/TNF/TNF/TNF/CEBPA/SMARCB1 | 51 |
| GO:0046660 | female sex differentiation | 46/3662 | 114/15509 | 5.01719e-05 | 0.000360383 | 0.000216728 | BAK1/HSPA5/MSH4/TP63/LRP2/PGR/BAX/MMP2/ESR1/PCYT1B/SFRP1/CASP2/WNT5A/FOXO3/EIF2B2/INHBA/KDR/PDGFRA/CYP19A1/BRCA2/ARRB2/SMAD4/SOD1/SLIT2/GAS2/ARID5B/MERTK/ADAMTS1/MMP14/KIT/WNT4/INHBB/CASP3/GDF9/NOS3/ZFPM2/BCL2L1/CEBPB/STAT5B/LEP/FZD4/A2M/SLIT3/ZP3/SRC/FANCG | 46 |
| GO:0010573 | vascular endothelial growth factor production | 22/3662 | 42/15509 | 5.01792e-05 | 0.000360383 | 0.000216728 | NOX1/SARS1/FLT4/TGFB1/IL1A/IL1B/C3/IL6/CYP1B1/ARNT/NODAL/IL6R/NDRG2/EIF2AK3/TNF/TNF/TNF/TNF/TNF/TNF/TNF/TNF | 22 |
| GO:0032535 | regulation of cellular component size | 110/3662 | 333/15509 | 5.04416e-05 | 0.000361849 | 0.000217609 | KDM1A/USH1C/IFRD1/SCIN/PAFAH1B1/CDH1/CYFIP2/NTN1/RHOA/SPTB/WDR1/PICALM/ADD2/ACTN2/GSK3B/PPP1R15A/ADD1/P2RX7/DPYSL2/HSP90AB1/ABL1/CDHR5/ADNP/HCK/COTL1/PYCARD/RAB11A/KCNN4/KXD1/MTPN/CXCL12/CSF3/WNT3/ARPC3/DBN1/WNT5A/TTL/FN1/CAPZA1/SPP1/PTK2B/DSTN/CCR7/HP1BP3/CDC42EP1/APOE/ARPC1B/NGF/DBNL/CCL21/KIAA0319/RDX/BBS4/CRABP2/SNAPIN/SLIT2/ARHGAP18/SLC12A9/MSN/GSN/CDC42EP2/POU4F2/PLEKHH2/DMTN/ARHGAP35/SPTBN4/AP2M1/ALOX15/ARPC5/DISC1/CDC42EP3/SPTA1/PRKCD/RICTOR/CDK5/BORCS7/SEMA4C/SEMA3E/PRKCE/LPAR3/CCL11/RARG/SPTBN2/BDNF/FLII/GRB2/CDH4/NPM1/CNTN2/DCC/WNT7B/LAMTOR4/CLN3/ABCB8/SPTAN1/MTOR/IQANK1/GDI1/AKT1S1/TMSB4X/PDXP/ARPC1A/TWF2/SHANK3/BRK1/AKT3/NEFL/WNT3/WNT3/PTEN | 110 |
| GO:0030851 | granulocyte differentiation | 19/3662 | 34/15509 | 5.07146e-05 | 0.000363386 | 0.000218534 | SPI1/CEBPE/GATA1/CSF3/IL5/CBFA2T3/RARA/AP3B1/CUL4A/LBR/RUNX1/TAL1/BAP1/CSF2/INPP5D/ADIPOQ/L3MBTL3/CEBPA/INPP5D | 19 |
| GO:0061448 | connective tissue development | 85/3662 | 245/15509 | 5.18482e-05 | 0.00037108 | 0.000223161 | HOXA11/SCIN/SNAI2/RUNX3/CD44/CASR/BARX2/PUM2/SPI1/HYAL2/FGFR3/PITX1/OXCT1/ZMPSTE24/GLG1/XBP1/PDGFB/BMP7/SMAD7/SLC39A14/TGFB1/HOXA5/TGFBR1/BMPR1A/ACTA2/ZBTB16/MDK/WNT5B/PPARD/MAPK14/SMAD5/PDGFRB/WNT5A/PRRX1/SNX19/EGR1/RUNX2/BMP2/THRA/HOXD3/TWSG1/COL5A1/RARA/CHI3L1/LOXL2/ADAMTS7/CCN3/SORL1/FGF2/COL2A1/RB1/BBS4/CCN1/NOTCH1/ZEB1/SERPINH1/HMGA2/ARID5B/POU4F2/BMP6/STC1/RUNX1/IL6R/FRZB/TGFBR2/BMP1/EIF2AK3/RARG/ESRRA/LEP/HRAS/PLAAT3/TYMS/MAF/PTPN11/CREB3L2/RFLNB/NOG/CSF1/WNT7B/COL27A1/COL11A2/EBF2/ITGB3/LOC102724560 | 85 |
| GO:0045598 | regulation of fat cell differentiation | 50/3662 | 127/15509 | 5.19817e-05 | 0.000371606 | 0.000223477 | SNAI2/TFE3/SIRT2/SIRT6/RUNX1T1/MMP11/XBP1/BMP7/AXIN1/SFRP1/TGFB1/GATA3/ZBTB16/PPARD/MAPK14/WNT5A/HES1/ID2/BMP2/NR1D1/ZFP36/IL6/ATAT1/TAF8/CARM1/DUSP10/FOXO1/ZFP36L2/WIF1/FNDC5/ZNF385A/FRZB/GPER1/ZFPM2/CEBPB/LEP/DDIT3/LPL/ADIPOQ/ZFP36L1/C1QL4/TNF/TNF/TNF/TNF/TNF/TNF/TNF/TNF/CEBPA | 50 |
| GO:0035065 | regulation of histone acetylation | 28/3662 | 59/15509 | 5.21724e-05 | 0.00037254 | 0.000224039 | NFYA/KMT2E/BAZ1B/SNAI2/FOXP3/NFYC/SPI1/ZMPSTE24/SMARCB1/GATA3/ZNF451/SF3B1/PARK7/DEK/LIF/MYBBP1A/WBP2/SMAD4/SMARCA5/CTBP1/PYGO2/BRD7/SETD5/TAF7/MUC1/NOC2L/SMARCB1/TADA2A | 28 |
| GO:0006354 | DNA-templated transcription elongation | 76/3662 | 214/15509 | 5.26453e-05 | 0.000375484 | 0.00022581 | PAF1/MED24/MED17/MED29/SIRT6/PIAS2/DDX1/PIR/KDM2B/PXN/FUS/CCNK/SUPT16H/MED15/SMARCB1/CBX7/AXIN1/ERCC2/MED25/POLR2I/ELL/EZH2/RECQL5/INTS2/SMARCD2/LPXN/POU2AF1/KAT2B/KDM3A/FHL2/ARID3A/KDM3B/MED13L/RALY/UXT/ADRM1/ZC3H4/PIAS3/BTG1/MED6/ELP2/AKIRIN2/NCBP1/HMGA1/INTS14/TDG/SKIC8/INTS3/PPRC1/HMGA2/ERCC3/RYBP/SAP30/SHH/MED30/INTS1/NSD1/CDK12/SETD5/JMJD1C/KAT5/KDM2A/LARP7/MED16/SETD2/EWSR1/MUC1/HEXIM1/TCEA1/NELFB/TRRAP/PHF2/ZXDA/ZBED1/SMARCB1/TAF15 | 76 |
| GO:0006475 | internal protein amino acid acetylation | 63/3662 | 170/15509 | 5.36716e-05 | 0.000381586 | 0.000229479 | NFYA/KMT2E/MED24/BAZ1B/SNAI2/FOXP3/NFYC/SPI1/MBD3/ACTB/ZMPSTE24/ATXN7L3/BRPF3/BAG6/SMARCB1/JADE3/GATA3/NAA40/ZNF451/KAT2B/SF3B1/PARK7/DR1/NAA50/MORF4L2/DEK/YEATS4/LIF/MYBBP1A/WBP2/TAF5L/EPC2/IRF4/ATAT1/BRCA2/SMAD4/OGT/KAT14/MBIP/SMARCA5/BRPF1/CTBP1/TAF6L/PYGO2/BRD7/SETD5/TADA3/HCFC1/KAT5/MSL2/TAF7/MUC1/NOC2L/WDR5/TRRAP/BAG6/BAG6/BAG6/BAG6/BAG6/SMARCB1/TADA2A/PCGF2 | 63 |
| GO:1903078 | positive regulation of protein localization to plasma membrane | 29/3662 | 62/15509 | 5.39265e-05 | 0.000381586 | 0.000229479 | ITGA3/EPHA3/ATP2B4/RANGRF/IFNG/LRP1/ACSL3/EPHB2/EPHA2/STAC/PIK3R1/EGFR/ITGB1/RER1/GPER1/KIF5B/PRKCE/CIB1/STAC3/CLN3/TNF/TNF/TNF/TNF/TNF/TNF/TNF/TNF/SQSTM1 | 29 |
| GO:0002249 | lymphocyte anergy | 12/3662 | 17/15509 | 5.4055e-05 | 0.000381586 | 0.000229479 | FOXP3/CLC/LILRB4/HLA-B/HLA-B/HLA-B/HLA-B/HLA-B/LILRB4/LILRB4/LILRB4/ITCH | 12 |
| GO:0002667 | regulation of T cell anergy | 12/3662 | 17/15509 | 5.4055e-05 | 0.000381586 | 0.000229479 | FOXP3/CLC/LILRB4/HLA-B/HLA-B/HLA-B/HLA-B/HLA-B/LILRB4/LILRB4/LILRB4/ITCH | 12 |
| GO:0002870 | T cell anergy | 12/3662 | 17/15509 | 5.4055e-05 | 0.000381586 | 0.000229479 | FOXP3/CLC/LILRB4/HLA-B/HLA-B/HLA-B/HLA-B/HLA-B/LILRB4/LILRB4/LILRB4/ITCH | 12 |
| GO:0002911 | regulation of lymphocyte anergy | 12/3662 | 17/15509 | 5.4055e-05 | 0.000381586 | 0.000229479 | FOXP3/CLC/LILRB4/HLA-B/HLA-B/HLA-B/HLA-B/HLA-B/LILRB4/LILRB4/LILRB4/ITCH | 12 |
| GO:0006978 | DNA damage response, signal transduction by p53 class mediator resulting in transcription of p21 class mediator | 12/3662 | 17/15509 | 5.4055e-05 | 0.000381586 | 0.000229479 | HIPK2/SP100/RPS6KA6/ZNHIT1/FOXM1/CDKN1A/BRCA2/ZNF385A/RPL26/KAT5/CHEK2/MUC1 | 12 |
| GO:0032817 | regulation of natural killer cell proliferation | 12/3662 | 17/15509 | 5.4055e-05 | 0.000381586 | 0.000229479 | IL12B/PTPN22/IL18/STAT5B/LEP/HLA-E/HLA-E/HLA-E/HLA-E/HLA-E/HLA-E/HLA-E | 12 |
| GO:1901856 | negative regulation of cellular respiration | 12/3662 | 17/15509 | 5.4055e-05 | 0.000381586 | 0.000229479 | RHOA/PPIF/TRAP1/PDE12/TNF/TNF/TNF/TNF/TNF/TNF/TNF/TNF | 12 |
| GO:0031645 | negative regulation of nervous system process | 15/3662 | 24/15509 | 5.42533e-05 | 0.000382116 | 0.000229798 | TMEM98/CTSC/IL10/CCN3/TNFRSF21/EIF2AK3/TNF/TNF/TNF/TNF/TNF/TNF/TNF/TNF/PTEN | 15 |
| GO:0033598 | mammary gland epithelial cell proliferation | 15/3662 | 24/15509 | 5.42533e-05 | 0.000382116 | 0.000229798 | BAX/ESR1/HOXA5/GATA3/AREG/CCND1/WNT5A/ID2/KDM5B/BRCA2/EPHA2/PYGO2/BTRC/CEBPB/ZNF703 | 15 |
| GO:0007229 | integrin-mediated signaling pathway | 44/3662 | 108/15509 | 5.51694e-05 | 0.000388127 | 0.000233413 | ITGAL/ITGA3/ITGA2B/LAMA3/CDC42/ADAM11/ITGA8/ABL1/MYH9/FERMT1/HCK/LAMA1/CD40LG/PTN/NEDD9/ITGA4/FN1/PTK2B/LAMA5/LAMC1/CCM2/ITGA11/ITGAV/ITGAX/ITGB1/DST/ADAMTS1/DMTN/ITGB2/ADAMTS13/SYK/ADAM9/PTK2/LIMS1/ITGAM/LAMB2/RCC2/PTPN11/CD47/SRC/SLC2A10/CD177/ITGB3/ADAMTS13 | 44 |
| GO:0002828 | regulation of type 2 immune response | 17/3662 | 29/15509 | 5.54445e-05 | 0.00038962 | 0.000234311 | CD74/TBX21/IL4R/ARG2/IL27RA/GATA3/CD81/IL4/BCL6/CD86/ARG1/NDFIP1/RARA/IL6/HLX/IL18/NOD2 | 17 |
| GO:0006809 | nitric oxide biosynthetic process | 31/3662 | 68/15509 | 5.59757e-05 | 0.0003926 | 0.000236103 | ATP2B4/ARG2/HSP90AB1/CYB5R3/ACP5/IFNG/MTARC2/PKD2/CLU/PTK2B/IL1B/ASS1/CD36/IL10/TLR4/CYP1B1/DDAH1/NOS3/CX3CR1/NQO1/TRPV1/CD47/TNF/TNF/TNF/TNF/TNF/TNF/TNF/TNF/HBB | 31 |
| GO:0043154 | negative regulation of cysteine-type endopeptidase activity involved in apoptotic process | 34/3662 | 77/15509 | 5.59953e-05 | 0.0003926 | 0.000236103 | HGF/BIRC3/CD44/BIRC5/MMP9/BIRC7/GPI/DNAJB6/CRYAB/PARK7/NR4A1/MICAL1/THBS1/ARRB2/FABP1/INTS1/RAG1/SERPINB9/TRIAP1/PAK2/SRC/TNF/TNF/MAGEA3/TNF/TNF/TNF/TNF/TNF/TNF/NAIP/NAIP/NAIP/GPI | 34 |
| GO:0050688 | regulation of defense response to virus | 33/3662 | 74/15509 | 5.63391e-05 | 0.000394565 | 0.000237284 | FOXP3/ZMPSTE24/MAVS/IL12RB1/RIOK3/PYCARD/LILRB1/C1QBP/IL12B/IL4/STAT1/TNFAIP3/IL1B/TRAF3/PTPN22/PPM1B/HERC5/TARBP2/NLRX1/HTRA1/TRIM44/PCBP2/MICB/MICB/MICB/MICB/MICB/MICB/LILRB1/LILRB1/LILRB1/LILRB1/ITCH | 33 |
| GO:0046683 | response to organophosphorus | 48/3662 | 121/15509 | 5.8126e-05 | 0.00040662 | 0.000244534 | KDM1A/CPS1/HSPA5/KCNQ1/P2RX5/P2RX7/APEX1/GATA1/PLAT/PIK3CG/AHR/RAPGEF1/AREG/STAT1/SDC1/PKD2/PTK2B/IL1B/FOSB/CDO1/ASS1/NT5E/FDX1/CYP1B1/SOD1/APP/CARM1/PKLR/REN/DMTN/STC1/INHBB/GPD1/PTAFR/FOS/BSG/PDE3A/FOSL1/TYMS/ADIPOQ/SLC8A1/ZFP36L1/KCNJ11/P2RX2/TRPV1/PDXP/P2RY11/PKLR | 48 |
| GO:0010634 | positive regulation of epithelial cell migration | 52/3662 | 134/15509 | 5.8483e-05 | 0.000408656 | 0.000245759 | ITGA3/GRN/FLT4/FGFR1/ABL1/PDGFB/MMP9/CD40/RAB11A/GPI/PRKD2/TGFB1/PIK3CG/MET/HSPB1/GATA3/IFNG/SMOC2/HBEGF/WNT5A/NRP2/TEK/PTK2B/RRAS/STAT5A/KDR/THBS1/FGF2/EGF/RHOB/PLK2/VEGFC/PRKCA/EMC10/TGFBR2/NOS3/MAPRE2/ADAM9/PTK2/PRKCE/JUN/CALR/CIB1/HMGB1/SRC/MTOR/TMSB4X/ZNF580/PDCD6/ITGB3/AKT3/GPI | 52 |
| GO:0007178 | transmembrane receptor protein serine/threonine kinase signaling pathway | 113/3662 | 345/15509 | 6.00155e-05 | 0.000418892 | 0.000251914 | ITGA3/HFE/HSPA5/ARID4B/HIPK2/SPI1/ITGA8/LRP2/FKBP1A/PXN/GLG1/HSP90AB1/ABL1/BMP7/FERMT1/SMAD7/RBBP7/AXIN1/SFRP1/TGFB1/SFRP4/TGFBR1/ENG/BMPR1A/DKK1/ZMIZ1/DDX5/LPXN/FOLR1/MAPK14/ZNF451/SMAD5/WNT5A/HES1/HDAC1/TGIF2/SFRP5/EGR1/FMOD/INHBA/LRP1/USP9X/RUNX2/BMP2/ID1/PIN1/KDR/TWSG1/CDKN1C/GDF15/MEN1/NOTCH2/SPRY2/NKX2-1/CCN3/KIAA0319/NUMA1/SORL1/THBS1/SMAD6/TET1/FBN2/FURIN/TOB1/ARRB2/RNF165/SMAD4/CCN1/PARP1/OGT/NOTCH1/ZEB1/CRIM1/BMP6/NODAL/APPL1/SKI/RBBP4/INHBB/TGFBR2/SAP30/GDF9/ELAPOR2/SHH/HTRA1/RBPJ/ADAM9/PTK2/ZEB2/FOS/RGMB/SMAD2/EID2/JUN/RGMA/NOG/ZNF703/BCL9L/TMPRSS6/MAGI2/FAM83G/SRC/TRIM33/SLC2A10/SPRED2/CSNK2B/CSNK2B/CSNK2B/CSNK2B/CSNK2B/CDKN1C/CRIM1/ZNF8 | 113 |
| GO:0007431 | salivary gland development | 20/3662 | 37/15509 | 6.12138e-05 | 0.000426775 | 0.000256655 | SNAI2/HGF/FGFR2/BMP7/LAMA1/TGFB1/TWSG1/LAMA5/EGFR/SHH/DAG1/TGM2/TNF/TNF/TNF/TNF/TNF/TNF/TNF/TNF | 20 |
| GO:0019079 | viral genome replication | 47/3662 | 118/15509 | 6.13579e-05 | 0.000427299 | 0.00025697 | LTF/YTHDC2/EIF2AK2/ATG16L1/MAVS/CCNK/SMARCB1/VAPA/N4BP1/CCL2/HSPA8/AICDA/NR5A2/STAU1/DEK/TOP2A/SRPK2/TARBP2/NOTCH1/HMGA2/EEF1A1/CTBP1/VCP/ATG16L2/CXCL8/PDE12/CTBP2/BANF1/TMEM39A/CD28/PRKN/IFITM1/PLSCR1/PPIA/PCBP2/TNF/TNF/ZBED1/TNF/TNF/TNF/TNF/TNF/TNF/CCL5/CCL5/SMARCB1 | 47 |
| GO:0007565 | female pregnancy | 61/3662 | 164/15509 | 6.1829e-05 | 0.000430097 | 0.000258653 | CD38/ITGA3/PRDM1/VMP1/EPN1/DAZAP1/FBLN1/PGR/OVGP1/TMED2/MMP2/ESR1/ANGPT2/MMP9/SYDE1/KLF1/PTN/AMBP/C1QBP/CALCA/CYP27B1/VDR/PPARD/IGFBP2/ASH1L/SLC2A1/ARG1/SPP1/PGF/CRHR1/RECK/IL1B/FOSB/LIF/EPO/RARA/MEN1/SOD1/PARP1/CORIN/GJA1/NODAL/STC1/WNT4/CAPN2/H3-3A/TGFBR2/LGALS9/FOS/BSG/SLC19A1/STAT5B/LEP/FOSL1/CALR/OXTR/PAPPA/YTHDF3/EPOR/ITGB3/LOC102724560 | 61 |
| GO:0046545 | development of primary female sexual characteristics | 41/3662 | 99/15509 | 6.27247e-05 | 0.00043535 | 0.000261812 | HSPA5/MSH4/PGR/BAX/MMP2/ESR1/PCYT1B/SFRP1/CASP2/FOXO3/EIF2B2/INHBA/KDR/PDGFRA/CYP19A1/BRCA2/ARRB2/SMAD4/SOD1/SLIT2/GAS2/ARID5B/ADAMTS1/MMP14/KIT/WNT4/INHBB/CASP3/GDF9/NOS3/ZFPM2/BCL2L1/CEBPB/STAT5B/LEP/FZD4/A2M/SLIT3/ZP3/SRC/FANCG | 41 |
| GO:0071347 | cellular response to interleukin-1 | 41/3662 | 99/15509 | 6.27247e-05 | 0.00043535 | 0.000261812 | UPF1/HYAL2/MMP2/CD40/CCL22/CCL17/PYCARD/SFRP1/CCL2/IL17A/HES1/CCL20/EGR1/IL1B/NR1D1/AKAP12/IL6/ADAMTS7/TANK/IL1RN/CCL21/RBMX/INHBB/TNIP2/CXCL8/FGG/CCL11/CEBPB/CCL19/RELA/PLCB1/IRAK1/CD47/CCL5/CCL5/CCL4/CCL18/CCL4/CCL4/CCL18/CCL18 | 41 |
| GO:0031099 | regeneration | 66/3662 | 181/15509 | 6.41946e-05 | 0.000445054 | 0.000267648 | IFRD1/CD9/IGF1/HGF/BAK1/GRN/F7/PTPRU/CSNK2A2/MMP2/ANGPT2/PRPS2/GATA1/HAMP/MTPN/PTN/EZH2/CXCL12/CCND1/FOLR1/MDK/CD81/PPARD/KPNA1/BCL9/PRRX1/MTR/SPP1/NR4A3/PGF/FLT3/CDKN1A/SOX15/LCP1/IL6/IL10/CCN3/KIAA0319/TARBP2/IGF1R/DUSP10/CCNA2/NOTCH1/RUNX1/SELENON/TGFBR2/NNMT/CDK1/LAMB2/CEBPB/DAG1/TYMS/JUN/RGMA/FZD9/IGF2R/TNF/TNF/TNF/TNF/TNF/TNF/TNF/TNF/NEFL/PTEN | 66 |
| GO:0043244 | regulation of protein-containing complex disassembly | 46/3662 | 115/15509 | 6.46862e-05 | 0.000447961 | 0.000269396 | UPF1/SCIN/SPAST/CLEC16A/PHF23/NAV3/TBC1D25/SPTB/WDR1/ADD2/ACTN2/ZMPSTE24/ADD1/TPX2/MTPN/CAPZA1/MTRF1/DSTN/APC/RDX/IGF1R/GSN/PLEKHH2/SCAF4/DMTN/SPTBN4/SPTA1/FYCO1/ADRB2/SPTBN2/TMEM39A/FLII/CIB1/CLN3/SPTAN1/IQANK1/TNF/TNF/TNF/TNF/TNF/TNF/TNF/TNF/PDXP/TWF2 | 46 |
| GO:0045579 | positive regulation of B cell differentiation | 11/3662 | 15/15509 | 6.50695e-05 | 0.000449611 | 0.000270388 | BAD/BTK/XBP1/IL7/IL10/IL2RG/MMP14/SYK/INPP5D/STAT5B/INPP5D | 11 |
| GO:0090324 | negative regulation of oxidative phosphorylation | 11/3662 | 15/15509 | 6.50695e-05 | 0.000449611 | 0.000270388 | RHOA/PPIF/PDE12/TNF/TNF/TNF/TNF/TNF/TNF/TNF/TNF | 11 |
| GO:0043087 | regulation of GTPase activity | 110/3662 | 335/15509 | 6.65808e-05 | 0.000459541 | 0.00027636 | PAFAH1B1/TRAPPC6A/RABGAP1/EPHA3/TBC1D22A/RASGRF1/ZC3H15/TBC1D25/RASGRP2/PICALM/PLXNA2/RAP1GAP/GSK3B/TMED2/GMIP/RAPGEF4/RANGAP1/CD40/CCL22/CCL17/TSC2/PYCARD/SFRP1/ARHGEF10/SYDE1/MET/EZH2/RAPGEF1/CCL2/CORO1C/FZD10/NEDD9/BVES/BCL6/WNT5A/CCL20/SIPA1L2/STMN1/PTK2B/TBC1D15/CCR7/PIN1/CHN1/AJUBA/FOXJ1/DOCK6/TBC1D14/TBC1D8B/SPRY2/CCL21/RDX/BBS4/ARRB2/SOD1/EPHA2/PKP4/EPHA5/IQGAP2/MMUT/C9orf72/NTRK2/ITGB1/ASAP2/CXCL13/AGAP1/ARHGAP27/ABR/ARHGAP35/DVL3/WNT4/RICTOR/GAPVD1/ARHGAP12/TTC8/MAPRE2/SLC27A4/TBC1D2B/RGS14/PTK2/LIMS1/S1PR1/CCL11/CCL19/HRAS/ALS2CL/RCC2/ARHGAP45/F2R/RGMA/EPHB3/PRTN3/TBC1D9B/SYNGAP1/SIPA1L1/NTRK1/MTOR/TGM2/SIPA1/CCPG1/CCL5/CCL5/TBC1D3/CCL4/CCL18/CCL4/PRTN3/CCL4/CCL18/CCL18/RASA3 | 110 |
| GO:0006334 | nucleosome assembly | 45/3662 | 112/15509 | 6.81005e-05 | 0.000468985 | 0.00028204 | ATRX/SUPT16H/CHRAC1/MACROH2A1/H1-3/H2BC11/HP1BP3/ANP32B/SSRP1/SMARCA5/H2BC5/CHAF1B/PADI4/H3-3A/CHAF1A/H1-4/NPM1/H2BC21/H1-2/H2AX/H1-0/H2BC26/BRD2/DAXX/DAXX/DNAJC9/BRD2/DAXX/DAXX/BRD2/DAXX/H2BC15/BRD2/BRD2/H4C15/H4C14/H4C12/H2BC6/H3C6/H4C5/H4C4/H2BC7/H3C10/PADI4/H3C2 | 45 |
| GO:0030278 | regulation of ossification | 45/3662 | 112/15509 | 6.81005e-05 | 0.000468985 | 0.00028204 | LTF/ZMPSTE24/TXLNG/P2RX7/BMP7/SMAD7/GATA1/SFRP1/TGFB1/PTN/BMPR1A/DKK1/ZBTB16/MDK/CALCA/CYP27B1/VDR/MAPK14/WNT5A/PTK2B/SRGN/EGR2/RUNX2/BMP2/LRP4/TFAP2A/SMAD6/FBN2/CCN1/NOTCH1/BMP6/WNT4/RBPJ/ADRB2/S1PR1/ESRRA/FAM20C/PTPN11/SLC8A1/RFLNB/CSF1/NOTUM/PBX1/FZD9/RXRB | 45 |
| GO:0030879 | mammary gland development | 49/3662 | 125/15509 | 6.99544e-05 | 0.000481218 | 0.000289396 | NTN1/FGFR2/GLI2/HOXA9/PGR/BAX/ESR1/XBP1/USF2/HOXA5/GATA3/WNT3/AREG/CCND1/VDR/SLC29A1/WNT5A/ID2/KDM5B/IRF6/ARG1/STAT5A/HOXD9/CDO1/CYP19A1/FGF2/EGF/BRCA2/TNFRSF11A/EPHA2/BCL2L11/ARHGAP35/WNT4/PYGO2/TGFBR2/BTRC/MGMT/CCL11/CEBPB/STAT5B/OXTR/CSF1R/ZNF703/CSF1/WNT7B/SRC/NME1/WNT3/WNT3 | 49 |
| GO:0048146 | positive regulation of fibroblast proliferation | 26/3662 | 54/15509 | 7.05086e-05 | 0.000484492 | 0.000291365 | IGF1/CD74/NGFR/FOSL2/SIRT6/ESR1/CDC6/ABL1/PDGFB/ZMIZ1/PDGFRB/WNT5A/FN1/CDKN1A/LIF/CCNB1/PDGFRA/CCNA2/PDGFC/EGFR/LIG4/HRAS/JUN/BRK1/ITGB3/MIF | 26 |
| GO:0006606 | protein import into nucleus | 56/3662 | 148/15509 | 7.06938e-05 | 0.000485227 | 0.000291807 | POLA2/CDH1/TNPO3/IPO5/ELAVL1/HYAL2/SIRT6/TNPO1/IPO11/MAVS/NUP50/HSP90AB1/NFKBIA/FERMT1/NXT2/KPNA3/TSC2/TGFB1/TNPO2/RANGRF/ZPR1/IFNG/MAPK14/KPNA1/TARDBP/CRY2/CSE1L/CDKN1A/NUP153/NUP85/NXT1/IPO8/CD36/MDFIC/AKIRIN2/PIK3R1/NOTCH1/BAG3/RANBP2/HEATR3/APPL1/LMNA/PRKCD/SHH/SYK/CHP2/PKIG/CDK1/LEP/PTTG1IP/IPO4/IPO9/IPO7/TXNIP/SQSTM1/IPO4 | 56 |
| GO:0061458 | reproductive system development | 93/3662 | 275/15509 | 7.10824e-05 | 0.000487169 | 0.000292975 | HOXA11/BAK1/HSPA5/ARID4B/MSH4/FGFR2/TP63/HOXA9/LRP2/PGR/ATRX/BAX/MMP2/ESR1/MSH2/BMP7/GATA1/PCYT1B/SFRP1/CASP2/TGFBR1/GATA3/CCND1/PDGFRB/WNT5A/IL1A/SDC1/ASH1L/KDM5B/FOXO3/EIF2B2/TNFSF10/INHBA/MEA1/C3/EIF2S2/KDR/SOX15/BCL2L2/RARA/HSD17B4/PDGFRA/SERPINE2/NKX2-1/CYP19A1/CYP1B1/BRCA2/GREB1L/ARRB2/SMAD4/SOD1/RAB13/REN/SLIT2/NOTCH1/GAS2/ARID5B/DHX37/BCL2L11/BMP6/MERTK/ADAMTS1/MMP14/KIT/WNT4/H3-3A/INHBB/CASP3/TLR3/GDF9/SHH/NOS3/FRS2/ZFPM2/BCL2L1/CEBPB/CYP7B1/RARG/STAT5B/LEP/FZD4/A2M/PTPN11/PLAG1/NOG/SLIT3/ZP3/AKR1C3/SRC/NTRK1/FANCG/HOXA10/PTEN | 93 |
| GO:0010950 | positive regulation of endopeptidase activity | 59/3662 | 158/15509 | 7.11338e-05 | 0.000487169 | 0.000292975 | BAD/CASP10/FAS/BAK1/CYFIP2/NGFR/RHOA/PICALM/BAX/PSME1/MEFV/PYCARD/PDCD5/NOD1/CASP2/PERP/HSPE1/FASLG/TNFSF10/SEMG1/ADRM1/PSME3/AKIRIN2/ANP32B/MTCH1/BCL2L10/PMAIP1/CCN1/ARL6IP5/GSN/BCL2L11/NODAL/GPER1/SYK/VCP/FADD/LGALS9/PRELID1/EFNA1/EIF2AK3/GRIN1/F2R/CARD9/HMGB1/DAPK1/MAP3K5/MBP/CR1/TNF/PSENEN/TNF/FIS1/TNF/TNF/TNF/TNF/TNF/TNF/PDCD6 | 59 |
| GO:0002532 | production of molecular mediator involved in inflammatory response | 37/3662 | 87/15509 | 7.19264e-05 | 0.000492053 | 0.000295912 | BTK/GRN/IL4R/MEFV/PYCARD/SERPINE1/EZH2/MAPK14/IL17A/SNX4/VAMP8/EPHB2/CD36/IL6/TLR4/DUSP10/GBP5/APPL1/BAP1/SYK/NOD2/PRDX2/LEP/F2/LILRB4/CARD9/TNF/TNF/TNF/TNF/TNF/TNF/TNF/TNF/LILRB4/LILRB4/LILRB4 | 37 |
| GO:0031649 | heat generation | 14/3662 | 22/15509 | 7.29077e-05 | 0.000496028 | 0.000298303 | IL1A/IL1B/EDNRB/TNFRSF11A/ADRB2/TRPV1/TNF/TNF/TNF/TNF/TNF/TNF/TNF/TNF | 14 |
| GO:0036005 | response to macrophage colony-stimulating factor | 14/3662 | 22/15509 | 7.29077e-05 | 0.000496028 | 0.000298303 | DOK1/SPP1/TLR4/PTPN2/CSF1R/CSF1/TNF/TNF/TNF/TNF/TNF/TNF/TNF/TNF | 14 |
| GO:0046639 | negative regulation of alpha-beta T cell differentiation | 14/3662 | 22/15509 | 7.29077e-05 | 0.000496028 | 0.000298303 | RUNX3/FOXP3/CBFB/TBX21/IL4R/SMAD7/JAK3/IL4/BCL6/HLX/RUNX1/SHH/SOCS1/HMGB1 | 14 |
| GO:0072567 | chemokine (C-X-C motif) ligand 2 production | 14/3662 | 22/15509 | 7.29077e-05 | 0.000496028 | 0.000298303 | CD74/TLR4/LPL/HMGB1/MBP/TNF/TNF/TNF/TNF/TNF/TNF/TNF/TNF/MIF | 14 |
| GO:2000341 | regulation of chemokine (C-X-C motif) ligand 2 production | 14/3662 | 22/15509 | 7.29077e-05 | 0.000496028 | 0.000298303 | CD74/TLR4/LPL/HMGB1/MBP/TNF/TNF/TNF/TNF/TNF/TNF/TNF/TNF/MIF | 14 |
| GO:0032715 | negative regulation of interleukin-6 production | 27/3662 | 57/15509 | 7.3607e-05 | 0.000500237 | 0.000300834 | HGF/FOXP3/CSK/IL27RA/TNFAIP3/FOXJ1/SYT11/PTPN22/IL10/TLR4/ARRB2/NLRX1/INPP5D/LILRB4/TNF/TNF/TNF/TNF/TNF/TNF/ORM1/TNF/TNF/LILRB4/LILRB4/LILRB4/INPP5D | 27 |
| GO:0051591 | response to cAMP | 36/3662 | 84/15509 | 7.38509e-05 | 0.000501345 | 0.0003015 | KDM1A/CPS1/HSPA5/KCNQ1/APEX1/GATA1/PLAT/PIK3CG/AHR/RAPGEF1/AREG/STAT1/SDC1/PKD2/PTK2B/FOSB/CDO1/ASS1/FDX1/CYP1B1/APP/CARM1/PKLR/REN/DMTN/STC1/INHBB/GPD1/PTAFR/FOS/BSG/FOSL1/ADIPOQ/SLC8A1/ZFP36L1/PKLR | 36 |
| GO:0045727 | positive regulation of translation | 48/3662 | 122/15509 | 7.41176e-05 | 0.000502003 | 0.000301896 | ELAVL1/PKM/RHOA/PPP1R15A/GCN1/CIRBP/PCIF1/LARP4B/RPS6KB1/C1QBP/PASK/SERP1/PTK2B/SOX4/NIBAN1/IL6/THBS1/CYP1B1/LARP1B/TARBP2/TOB1/EIF4A3/POLR2D/CDC123/GUF1/RMND1/USP16/RPL26/RPUSD4/PTAFR/PAIP1/CD28/NPM1/EIF3C/YTHDF3/MTOR/TNF/TNF/TNF/TNF/TNF/TNF/TNF/TNF/EIF6/PRKDC/CCL5/CCL5 | 48 |
| GO:0060693 | regulation of branching involved in salivary gland morphogenesis | 10/3662 | 13/15509 | 7.41908e-05 | 0.000502003 | 0.000301896 | SNAI2/HGF/TNF/TNF/TNF/TNF/TNF/TNF/TNF/TNF | 10 |
| GO:2000669 | negative regulation of dendritic cell apoptotic process | 10/3662 | 13/15509 | 7.41908e-05 | 0.000502003 | 0.000301896 | LILRB1/CXCL12/CCR7/CCL21/BCL2L1/CCL19/LILRB1/LILRB1/LILRB1/LILRB1 | 10 |
| GO:0042116 | macrophage activation | 43/3662 | 106/15509 | 7.5131e-05 | 0.000507257 | 0.000305055 | TYROBP/SLC11A1/CD74/GRN/KARS1/FCGR2B/IL4R/PTPRC/HAMP/CTSC/IFNG/IL4/WNT5A/CLU/NR1D1/SYT11/IL6/IL10/TLR4/THBS1/APP/ITGB2/TLR3/CSF2/SYK/CX3CR1/TNIP2/ITGAM/PRKCE/JUN/TRPV1/SHPK/TNF/TNF/TNF/TNF/TNF/TNF/TNF/TNF/CEBPA/PTPRC/MIF | 43 |
| GO:0051983 | regulation of chromosome segregation | 43/3662 | 106/15509 | 7.5131e-05 | 0.000507257 | 0.000305055 | CDC27/ARID1B/PUM2/SIRT2/CSNK2A2/ACTB/NDC80/ZW10/ANAPC5/BIRC5/CDC6/BCL7C/SMARCB1/SMARCD2/BCL7A/FBXO5/SMC4/KAT2B/CDC20/ARID1A/TEX14/BECN1/CCNB1/CDCA8/APC/NUMA1/CENPE/RB1/KIF2C/NCAPG2/MKI67/SPC25/BRD7/BUB1/KAT5/ZWILCH/RMI2/AURKB/RCC2/MAPK15/PLSCR1/ARID2/SMARCB1 | 43 |
| GO:0051353 | positive regulation of oxidoreductase activity | 28/3662 | 60/15509 | 7.5936e-05 | 0.000512134 | 0.000307988 | CYBA/CDH3/ABL1/FCER2/NOD1/CYP27B1/VDR/IFNG/PARK7/PTK2B/IL1B/APOE/FDX1/COX17/ABL2/CALM3/TERT/FXN/NOD2/PDP2/TNF/TNF/TNF/TNF/TNF/TNF/TNF/TNF | 28 |
| GO:0001701 | in utero embryonic development | 115/3662 | 354/15509 | 7.64605e-05 | 0.000515055 | 0.000309745 | PSMC4/IGF1/RCN1/PRDM1/EPN1/TIE1/FGFR2/MBD3/APOB/TMED2/HECTD1/MSH2/SMARCB1/PDGFB/MYH9/CCNB1IP1/CHD8/GINS1/BMP7/RBBP8/GATA1/AXIN1/RPGRIP1L/NBN/ERCC2/GPI/ELL/SMG9/DNAJB6/TGFBR1/GATA3/BMPR1A/SH3PXD2A/ZMIZ1/ZPR1/DBN1/HES1/EPAS1/MFN2/PKD2/GNA13/CNOT1/BMP2/EIF2S2/PRMT1/SBDS/LIF/SOX15/CCNB1/NOTCH2/PDGFRA/CCM2/NMT1/IL10/TAF8/TET1/CIR1/BRCA2/CUL4A/FURIN/ARMC5/CMTM3/SMAD4/FKBP10/ZFP14/CCN1/ARNT/RPL7L1/GNA12/EGFR/NCAPG2/NOTCH1/ITGB1/SEC24D/MBNL1/BCL2L11/GABPA/PHF6/NODAL/PLCD3/CAPN2/TGFBR2/BAP1/CSF2/NOS3/INTS1/RPL13/NXN/RBPJ/ZFPM2/BCL2L1/RRM2/CEBPB/ARNT2/LIG4/SMAD2/FOSL1/GRB2/SETD2/PHLDA2/NOG/ZFP36L1/WNT7B/ZP3/RRP7A/SLC35E2B/MAFG/ZNF568/TCTN1/CEBPA/BRK1/SMARCB1/PCGF2/GPI/EMG1 | 115 |
| GO:0071480 | cellular response to gamma radiation | 16/3662 | 27/15509 | 7.67866e-05 | 0.000515055 | 0.000309745 | KDM1A/HSPA5/RAD51/CYBA/XRCC5/ZMPSTE24/CRYAB/EGR1/CDKN1A/ELK1/TLK2/RPL26/BCL2L1/HRAS/CHEK2/H2AX | 16 |
| GO:0001794 | type IIa hypersensitivity | 9/3662 | 11/15509 | 7.73663e-05 | 0.000515055 | 0.000309745 | FCGR2B/C3/HLA-E/HLA-E/HLA-E/HLA-E/HLA-E/HLA-E/HLA-E | 9 |
| GO:0002445 | type II hypersensitivity | 9/3662 | 11/15509 | 7.73663e-05 | 0.000515055 | 0.000309745 | FCGR2B/C3/HLA-E/HLA-E/HLA-E/HLA-E/HLA-E/HLA-E/HLA-E | 9 |
| GO:0002465 | peripheral tolerance induction | 9/3662 | 11/15509 | 7.73663e-05 | 0.000515055 | 0.000309745 | FOXP3/HLA-G/HLA-G/HLA-G/HLA-G/HLA-G/HLA-G/HLA-G/HLA-G | 9 |
| GO:0002725 | negative regulation of T cell cytokine production | 9/3662 | 11/15509 | 7.73663e-05 | 0.000515055 | 0.000309745 | HFE/FOXP3/TBX21/SMAD7/ARG1/LILRB4/LILRB4/LILRB4/LILRB4 | 9 |
| GO:0046136 | positive regulation of vitamin metabolic process | 9/3662 | 11/15509 | 7.73663e-05 | 0.000515055 | 0.000309745 | IFNG/TNF/TNF/TNF/TNF/TNF/TNF/TNF/TNF | 9 |
| GO:0061044 | negative regulation of vascular wound healing | 9/3662 | 11/15509 | 7.73663e-05 | 0.000515055 | 0.000309745 | SERPINE1/TNF/TNF/TNF/TNF/TNF/TNF/TNF/TNF | 9 |
| GO:0061757 | leukocyte adhesion to arterial endothelial cell | 9/3662 | 11/15509 | 7.73663e-05 | 0.000515055 | 0.000309745 | ZDHHC21/TNF/TNF/TNF/TNF/TNF/TNF/TNF/TNF | 9 |
| GO:0090235 | regulation of metaphase plate congression | 9/3662 | 11/15509 | 7.73663e-05 | 0.000515055 | 0.000309745 | SPAG5/BIRC5/KAT2B/TTL/BECN1/CDCA8/NUMA1/KAT5/AURKB | 9 |
| GO:1901671 | positive regulation of superoxide dismutase activity | 9/3662 | 11/15509 | 7.73663e-05 | 0.000515055 | 0.000309745 | PARK7/TNF/TNF/TNF/TNF/TNF/TNF/TNF/TNF | 9 |
| GO:1903347 | negative regulation of bicellular tight junction assembly | 9/3662 | 11/15509 | 7.73663e-05 | 0.000515055 | 0.000309745 | ROCK1/TNF/TNF/TNF/TNF/TNF/TNF/TNF/TNF | 9 |
| GO:0002548 | monocyte chemotaxis | 29/3662 | 63/15509 | 7.75439e-05 | 0.000515131 | 0.000309791 | PDGFB/CTSG/FLT1/CCL22/CCL17/SERPINE1/CREB3/CXCL12/CCL2/CALCA/CCL20/IL6/CCN3/CCL21/TNFRSF11A/SLIT2/IL6R/CX3CR1/CCL11/CCL19/HMGB1/CCL5/CCL5/CCL4/CCL18/CCL4/CCL4/CCL18/CCL18 | 29 |
| GO:0051568 | histone H3-K4 methylation | 29/3662 | 63/15509 | 7.75439e-05 | 0.000515131 | 0.000309791 | NFYA/KDM1A/KMT2E/NFYC/DNMT3B/GATA3/HCFC2/MACROH2A1/ASH1L/MYB/H1-3/ASH2L/DNMT1/MEN1/SKIC8/SMAD4/BOD1/OGT/GFI1/PYGO2/NNMT/H1-4/HCFC1/TET3/H1-2/WDR5/WDR5B/NCOA6/PAGR1 | 29 |
| GO:0061008 | hepaticobiliary system development | 51/3662 | 132/15509 | 7.82934e-05 | 0.000519553 | 0.00031245 | HGF/CPS1/CSNK2A2/ZMPSTE24/SMARCB1/XBP1/ACO2/PCK2/RPGRIP1L/HAMP/PTN/MET/EZH2/CCND1/MDK/NPHP3/HES1/TNFAIP3/ARG1/PKD2/ELK1/ALDH1A2/ASS1/RARA/NOTCH2/HNF1A/IL6/HLX/IL10/CYP1A1/NOTCH1/ARID5B/NODAL/WNT4/FRZB/CEBPB/RELA/TYMS/JUN/IGF2R/PHF2/TNF/TNF/TNF/TNF/TNF/TNF/TNF/TNF/CEBPA/SMARCB1 | 51 |
| GO:0071479 | cellular response to ionizing radiation | 30/3662 | 66/15509 | 7.84891e-05 | 0.000520295 | 0.000312896 | KDM1A/SNAI2/HSPA5/RAD51/CYBA/XRCC5/ZMPSTE24/SFRP1/EEF1D/HAMP/GATA3/CRYAB/MAPK14/GADD45A/EGR1/CDKN1A/ELK1/TANK/BRCA2/RHOB/TLK2/RPL26/MGMT/BCL2L1/RHNO1/LIG4/HRAS/GRB2/CHEK2/H2AX | 30 |
| GO:0071901 | negative regulation of protein serine/threonine kinase activity | 42/3662 | 103/15509 | 7.87108e-05 | 0.000521207 | 0.000313445 | IPO5/HYAL2/ABL1/BMP7/PYCARD/SFRP1/CHORDC1/SH2B3/MACROH2A1/KAT2B/PRKAR2A/GADD45A/TNFAIP3/CDKN1A/IL1B/BMP2/CDKN1C/APOE/MEN1/PTPN22/APC/SPRY2/SORL1/RB1/DUSP10/HHEX/UCHL1/PRKCD/DUSP7/CASP3/PKIG/RGS14/ADIPOQ/SLC8A1/HEXIM1/SPRY4/IPO7/CEBPA/CDKN1C/LRP6/PTEN/CHORDC1 | 42 |
| GO:0071260 | cellular response to mechanical stimulus | 31/3662 | 69/15509 | 7.88356e-05 | 0.000521476 | 0.000313607 | BAD/MAP3K14/FAS/BAK1/CYBA/MAP2K4/CD40/TLR8/PIEZO1/MTPN/CASP2/ENG/MAPK8/GADD45A/SLC2A1/TNFRSF10B/TNFRSF8/KCNJ2/IL1B/TLR4/FGF2/IGF1R/BAG3/BMP6/TLR3/FADD/MAP3K2/DAG1/PLEC/TLR7/ITGB3 | 31 |
| GO:0051170 | import into nucleus | 57/3662 | 152/15509 | 8.17204e-05 | 0.000539982 | 0.000324735 | POLA2/CDH1/TNPO3/IPO5/ELAVL1/HYAL2/SIRT6/TNPO1/IPO11/MAVS/NUP50/HSP90AB1/NFKBIA/FERMT1/NXT2/KPNA3/TSC2/TGFB1/TNPO2/RANGRF/ZPR1/IFNG/MAPK14/KPNA1/TARDBP/CRY2/CSE1L/CDKN1A/NUP153/NUP85/NXT1/IPO8/CD36/MDFIC/AKIRIN2/HNRNPA1/PIK3R1/NOTCH1/BAG3/RANBP2/HEATR3/APPL1/LMNA/PRKCD/SHH/SYK/CHP2/PKIG/CDK1/LEP/PTTG1IP/IPO4/IPO9/IPO7/TXNIP/SQSTM1/IPO4 | 57 |
| GO:0007005 | mitochondrion organization | 148/3662 | 475/15509 | 8.19265e-05 | 0.000540767 | 0.000325208 | BAD/AGK/GGCT/TTC19/DCN/IGF1/HGF/ZDHHC6/TOMM34/BAK1/AIFM2/PUM2/VPS35/CSNK2A2/MARK2/LMAN1/GSK3B/BAX/DNM1L/P2RX7/TMEM14A/SH3GLB1/TIMM13/SAMM50/GZMB/TIMM9/MMP9/TSC2/PYCARD/PDCD5/MYH14/GSK3A/MAPK8/TFAM/PPIF/CNTNAP1/NDUFC1/GRPEL1/FOXRED1/HSPA9/SLC25A36/TRAK2/EPAS1/PARK7/MFN2/HMGCL/RAB32/NDUFA8/SLIRP/IFIT2/CLU/IAPP/TNFSF10/ATPAF1/RAB38/SIRT5/MGME1/BECN1/ATG14/KDR/RAC2/BCL2L2/ECSIT/NECTIN2/SESN2/TIMM10B/IMMT/PRKAA1/CLUH/AP3B1/HRK/NMT1/COX17/GABARAPL1/PIF1/ARRB2/PMAIP1/SAE1/PARP1/OGT/NDUFB9/IMMP1L/TIMM8B/NDUFC2/NUBPL/BAG3/BCL2L11/WIPI2/NDUFS2/THEM4/CALM3/LMNA/SELENON/OMA1/BAP1/SLC25A46/TERT/GPER1/NOS3/CDK5/FXN/FUNDC2/RRM1/NDUFS5/LETM1/MFF/PRELID1/TRIAP1/NPTX1/BCL2L1/SLC25A33/TOMM20/CNP/ATG13/TOMM5/MTX3/MIEF2/ACAD9/PLEC/HIGD1A/COA4/TRAK1/PRKN/UBE2L3/FZD9/ATG7/ATAD3A/UBL5/ND6/COX20/HSPA1L/RIMOC1/HSPA1L/NDUFS3/FIS1/FANCG/HSPA1L/HSPA1L/HSPA1L/PISD/MTFP1/CEBPA/PGAM5/TIMM23/AKT3/MARCKS/SQSTM1/TOP3A | 148 |
| GO:0045444 | fat cell differentiation | 77/3662 | 220/15509 | 8.22249e-05 | 0.000542159 | 0.000326045 | SNAI2/TFE3/SIRT2/SIRT6/RUNX1T1/MMP11/XBP1/BMP7/AXIN1/SFRP1/TGFB1/GATA3/ZBTB16/CCND1/WNT5B/PPARD/MAPK14/WNT5A/HES1/ID2/NR4A3/EGR2/NR4A1/BMP2/NR1D1/ZFP36/PER2/PDGFRA/IL6/ATAT1/TAF8/SMAD6/BBS4/NUDT7/CARM1/DUSP10/OSBPL11/TCF7L2/HMGA2/ARID5B/FOXO1/ZFP36L2/NR4A2/WIF1/CTBP1/FNDC5/ZNF385A/FRZB/INHBB/GPER1/TTC8/ADRB2/ZFPM2/CEBPB/LEP/CTBP2/DDIT3/LPL/ADIPOQ/PLCB1/CNTN2/SOCS1/ZFP36L1/C1QL4/GRK5/MAFB/TNF/TNF/EBF2/CEBPD/TNF/TNF/TNF/TNF/TNF/TNF/CEBPA | 77 |
| GO:0018394 | peptidyl-lysine acetylation | 65/3662 | 179/15509 | 8.37998e-05 | 0.000551956 | 0.000331937 | NFYA/KMT2E/MED24/BAZ1B/SNAI2/FOXP3/NFYC/SPI1/MBD3/ACTB/ZMPSTE24/ATXN7L3/BRPF3/BAG6/SMARCB1/JADE3/GATA3/NAA40/ZNF451/KAT2B/SF3B1/PARK7/DR1/NAA50/MORF4L2/SOX4/DEK/YEATS4/LIF/PRKAA1/MYBBP1A/WBP2/TAF5L/EPC2/IRF4/ATAT1/BRCA2/SMAD4/OGT/KAT14/MBIP/SMARCA5/BRPF1/CTBP1/TAF6L/PYGO2/BRD7/SETD5/TADA3/HCFC1/KAT5/MSL2/TAF7/MUC1/NOC2L/WDR5/TRRAP/BAG6/BAG6/BAG6/BAG6/BAG6/SMARCB1/TADA2A/PCGF2 | 65 |
| GO:0015833 | peptide transport | 87/3662 | 255/15509 | 8.43161e-05 | 0.000554768 | 0.000333628 | BAD/CD38/HFE/CD74/CASR/NNAT/SIRT6/OXCT1/RAPGEF4/PCK2/ABCC1/SFRP1/TFR2/PPP3CB/PSMD9/IFNG/PPARD/PASK/PARK7/CRHR1/SNX19/SERP1/SOX4/ABCC4/IL1B/NR1D1/PER2/HNF1A/GLUL/IL6/IL1RN/CCN3/SLC15A4/ENSA/EPHA5/SLC16A2/CAMK2G/GLUD1/TCF7L2/FOXO1/GJA1/SLC13A3/INHBB/AIMP1/SLC9B2/GPER1/CCDC186/TAP1/PRKCE/FGG/FGA/BRSK2/LEP/SMAD2/PTPN11/MAFA/PRKN/KCNJ11/TRPV1/PIM3/SELENOT/TAP2/TNF/TAP2/TAP1/TAP2/TNF/TAP2/TNF/TAP1/TAP2/TAP1/TAP1/TNF/TAP2/TNF/TNF/TNF/TAP1/TAPBP/TAP2/TNF/TAP2/RASL10B/CCL5/CCL5/ABCC1 | 87 |
| GO:0062012 | regulation of small molecule metabolic process | 98/3662 | 294/15509 | 8.62192e-05 | 0.000566688 | 0.000340796 | BAD/SLC4A1/CRY1/MBTPS2/IGF1/SNAI2/CD74/H6PD/ATP2B4/PDK3/ACADVL/SIRT6/DUSP12/PIBF1/ZMPSTE24/APOB/DNM1L/P2RX7/GSK3A/CYP27B1/IFNG/PPARD/IL4/KAT2B/PARK7/LEPR/NR4A3/EGR1/PTK2B/EPHX2/CD244/SIRT5/IL1B/BMP2/NR1D1/DYRK2/CBFA2T3/APOE/SESN2/PRKAA1/PMAIP1/SOD1/APP/ARNT/PARP1/IGFBP3/OGT/ERLIN2/SOGA1/FOXO1/NDUFC2/BMP6/RANBP2/KIT/LDLRAP1/ADIPOR1/SLC2A6/AK4/WNT4/GFI1/FABP1/GPER1/NOS3/VCP/NNMT/SLC27A4/GPD1/DDIT4/PTAFR/PRKCE/PGAM1/ARV1/MST1/LEP/PTPN2/DNAJC30/ERFE/LACC1/ADIPOQ/KLHL25/PRKN/USP7/CLN3/AKR1C3/WDR5/SRC/MTOR/TNF/TMSB4X/TNF/FIS1/TNF/TNF/TNF/TNF/TNF/TNF/EIF6 | 98 |
| GO:0002418 | immune response to tumor cell | 19/3662 | 35/15509 | 8.64512e-05 | 0.00056701 | 0.00034099 | AHR/IL12B/CD160/NECTIN2/MR1/PRF1/MICA/HMGB1/HLA-A/HLA-A/HLA-A/HLA-A/HLA-A/HLA-A/MICA/HLA-A/MICA/MICA/HLA-A | 19 |
| GO:1901889 | negative regulation of cell junction assembly | 19/3662 | 35/15509 | 8.64512e-05 | 0.00056701 | 0.00034099 | ROCK1/DKK1/CORO1C/WNT5A/IL1B/THBS1/MMP14/DMTN/RCC2/SRC/TNF/TNF/TNF/TNF/TNF/TNF/TNF/TNF/PTEN | 19 |
| GO:0016311 | dephosphorylation | 105/3662 | 319/15509 | 8.66256e-05 | 0.000567553 | 0.000341317 | PTBP1/PPP5C/PHLPP2/PTPRU/MTMR1/PLPP1/ROCK1/INPP5A/SMG6/FBXW11/SYNJ2/PTPRC/DUSP12/GSK3B/PPP1R15A/FKBP1A/HSP90AB1/PPP6R2/CDKN3/CDC25B/PPP1R16B/ACP5/EYA1/URI1/TGFB1/CD33/PPP3CB/LHPP/PTPMT1/PPM1H/IFNG/PTP4A1/PPP2R5D/PPP2CA/PDGFRB/PTPA/PPP6C/MASTL/EPHX2/CRY2/BMP2/PIN1/STYXL1/PTPN22/PPM1B/DUSP5/MTMR6/IMPA2/ENSA/DUSP10/ACP1/CALM2/CTDSP1/BOD1/GNA12/PLPP5/PPP4C/PPP2R5E/SPPL3/DUSP2/PPP1R15B/CALM3/SSU72/PRKCD/DUSP7/NSMF/BTRC/CHP2/PPP2R3B/INPP5D/PPM1D/PDP2/CTDSP2/PTPN2/ANKLE2/PTPN11/PPP1R2/PTP4A3/INPP5J/MAGI2/PPIA/SRC/MTOR/SMG5/CSNK2B/TNF/PPP1R11/TNF/SACM1L/TNF/CSNK2B/CSNK2B/TNF/TNF/CSNK2B/TNF/TNF/TNF/CSNK2B/PDXP/PGAM5/THTPA/PTPRC/INPP5D/PTEN | 105 |
| GO:0031295 | T cell costimulation | 23/3662 | 46/15509 | 8.77229e-05 | 0.00057353 | 0.000344911 | CD40LG/CSK/MAP3K8/EFNB3/CD5/CD81/CD86/CD160/CD80/CCR7/CCL21/TNFRSF13C/CCL19/CD28/PTPN11/LILRB4/SRC/DPP4/PDCD1LG2/CD24/LILRB4/LILRB4/LILRB4 | 23 |
| GO:0043537 | negative regulation of blood vessel endothelial cell migration | 23/3662 | 46/15509 | 8.77229e-05 | 0.00057353 | 0.000344911 | ATP2B4/RHOA/ANGPT2/TGFB1/GADD45A/APOE/THBS1/FGF2/NOTCH1/HMGB1/CSNK2B/TNF/TNF/TNF/CSNK2B/CSNK2B/TNF/TNF/CSNK2B/TNF/TNF/TNF/CSNK2B | 23 |
| GO:0002690 | positive regulation of leukocyte chemotaxis | 39/3662 | 94/15509 | 8.94062e-05 | 0.000582691 | 0.00035042 | CD74/F7/SPI1/DNM1L/PTN/SERPINE1/CREB3/CXCL12/C1QBP/MDK/NEDD9/IL4/WNT5A/PGF/PTK2B/CCR7/RAC2/IL6/CCL21/THBS1/VEGFC/CXCL13/IL6R/CX3CR1/LGALS9/PTK2/CXCL8/CCL19/CALR/CXCR2/CSF1R/CSF1/HMGB1/ZNF580/CCL5/CCL5/CCL4/CCL4/CCL4 | 39 |
| GO:0008637 | apoptotic mitochondrial changes | 39/3662 | 94/15509 | 8.94062e-05 | 0.000582691 | 0.00035042 | BAD/GGCT/IGF1/HGF/BAK1/AIFM2/VPS35/GSK3B/BAX/DNM1L/TMEM14A/GZMB/MMP9/PYCARD/PDCD5/GSK3A/MAPK8/PPIF/IFIT2/CLU/TNFSF10/BCL2L2/HRK/NMT1/ARRB2/PMAIP1/BCL2L11/THEM4/LMNA/GPER1/FXN/MFF/PRELID1/TRIAP1/NPTX1/BCL2L1/PRKN/FZD9/FIS1 | 39 |
| GO:0019218 | regulation of steroid metabolic process | 39/3662 | 94/15509 | 8.94062e-05 | 0.000582691 | 0.00035042 | MBTPS2/SNAI2/H6PD/DDX20/ACADVL/APOB/ASAH1/CYP27B1/IFNG/PDE8B/IL1A/EGR1/EPHX2/BMP2/NR1D1/APOE/PRKAA1/IGF1R/ARMC5/SOD1/ERLIN2/BMP6/KIT/LDLRAP1/WNT4/GFI1/ATP1A1/ARV1/STAT5B/LEP/AKR1C3/TNF/TNF/TNF/TNF/TNF/TNF/TNF/TNF | 39 |
| GO:0048568 | embryonic organ development | 135/3662 | 428/15509 | 8.97917e-05 | 0.000584589 | 0.000351562 | WNT16/HOXA11/USH1C/ALX4/KCNQ1/PRDM1/EPN1/HIPK2/NTN1/FGFR2/NDST1/CDC42/MBD3/GLI2/ITGA8/TULP3/HOXA9/TMED2/KDM2B/HECTD1/PDGFB/MTHFD1/BMP7/GATA1/NDRG4/EYA1/TGFB1/DNAJB6/HOXA5/TGFBR1/ENG/DVL1/GATA3/CDH23/BMPR1A/HOXB6/FOLR1/SH2B3/SOBP/NPHP3/WNT5A/HES1/ID2/EPAS1/PRRX1/PKD2/MTHFD1L/RUNX2/KDR/LIF/HOXD3/HOXD9/ALDH1A2/SOX15/RARA/EPHB2/NOTCH2/PDGFRA/AHI1/SPRY2/HLX/IL10/TFAP2A/TUBB2B/FBN2/COL2A1/BBS4/EIF4A3/SOD1/EPHA2/CCN1/ARNT/LRIG1/PDGFC/EGFR/NOTCH1/ZEB1/NODAL/MMP14/KIT/PLCD3/TAL1/VANGL2/FRZB/ERCC3/TGFBR2/PITX2/IL3/CSF2/SHH/FRS2/RBPJ/EFNA1/ARL13B/CXCL8/ZFPM2/HOXD4/CEBPB/RARG/HOXB2/SMAD2/A2M/GRB2/SETD2/PHLDA2/NKX2-5/NOG/PBX1/ZFP36L1/TEAD1/WNT7B/ARID2/PAX5/COL13A1/HOXA4/LHFPL5/ZNF568/MAFB/PBX2/TNF/PBX2/TNF/TNF/PBX2/PBX2/TNF/TNF/TNF/TNF/TNF/PBX2/PBX2/CEBPA/PCGF2/TPO | 135 |
| GO:0016236 | macroautophagy | 90/3662 | 266/15509 | 9.03943e-05 | 0.000587895 | 0.00035355 | DCN/UFL1/IFT88/ATP6V0A1/CLEC16A/PHF23/VMP1/TBC1D25/VPS35/PRKACA/ATG16L1/CHMP5/NSFL1C/SH3GLB1/SNAP29/CHMP4B/TSC2/NOD1/MAPK8/IL4/SNX4/ATP6V1A/ELAPOR1/MFN2/ATP6V0B/VAMP8/STBD1/CAPNS1/BECN1/ATG14/KDR/SESN2/CHMP1A/VPS25/TBC1D14/ARL8B/SNX14/VPS36/ATP6V1G1/GABARAPL1/ULK3/RETREG3/SNAPIN/KLHL3/OGT/ATP6V1B2/C9orf72/SESN3/EI24/VTI1A/BAG3/HSPB8/UCHL1/ATP6V1C1/WIPI2/FYCO1/CASP3/CDK5/TP53INP1/VCP/ZFYVE1/NOD2/UBXN6/ATG16L2/ADRB2/SNX32/RNF213/ATP2A2/ATG13/CHMP6/TMEM39A/CDK5R1/ERN1/YOD1/EXOC7/PRKN/HGS/CLN3/SRC/ATG7/MTOR/RNF5/TRIM13/RIMOC1/PGAM5/IKBKG/LIX1L/PIP4K2B/SQSTM1/PRKACA | 90 |
| GO:0090100 | positive regulation of transmembrane receptor protein serine/threonine kinase signaling pathway | 44/3662 | 110/15509 | 9.23321e-05 | 0.000599868 | 0.00036075 | HFE/HIPK2/ITGA8/HSP90AB1/BMP7/FERMT1/AXIN1/TGFB1/TGFBR1/ENG/BMPR1A/HES1/INHBA/BMP2/KDR/TWSG1/CDKN1C/GDF15/MEN1/NOTCH2/KIAA0319/NUMA1/THBS1/RNF165/SMAD4/CCN1/PARP1/NOTCH1/BMP6/NODAL/INHBB/TGFBR2/GDF9/ELAPOR2/RBPJ/ZEB2/SMAD2/SLC2A10/CSNK2B/CSNK2B/CSNK2B/CSNK2B/CSNK2B/CDKN1C | 44 |
| GO:0009749 | response to glucose | 61/3662 | 166/15509 | 9.25644e-05 | 0.000600748 | 0.000361279 | BAD/CASR/CYBA/RHOA/PDK3/PRKACA/OPRK1/OXCT1/NOX4/ICAM1/ANGPT2/SMARCB1/XBP1/PCK2/SLC39A14/PPP3CB/RPS6KB1/PPARD/SLC29A1/FOXO3/EIF2B2/GPAM/EGR1/PTK2B/SOX4/NKX2-2/NR1D1/SESN2/PRKAA1/MEN1/GLUL/THBS1/KHK/IGF1R/SMAD4/COL6A2/PKLR/EPHA5/TCF7L2/TGFBR2/SLC9B2/CASP3/GPER1/CCDC186/PRKCE/NPTX1/KAT5/BRSK2/SMAD2/LPL/ERN1/RMI1/ADIPOQ/MAFA/SLC8A1/PIM3/SELENOT/PKLR/TXNIP/SMARCB1/PRKACA | 61 |
| GO:0044703 | multi-organism reproductive process | 66/3662 | 183/15509 | 9.39682e-05 | 0.000607019 | 0.000365051 | CD38/ITGA3/TAC1/PRDM1/VMP1/EPN1/DAZAP1/FBLN1/PGR/OVGP1/TMED2/MMP2/ESR1/ANGPT2/MMP9/SYDE1/KLF1/PTN/AMBP/C1QBP/CALCA/CYP27B1/VDR/PPARD/IGFBP2/ASH1L/SLC2A1/ARG1/SPP1/PGF/CRHR1/RECK/SEMG1/IL1B/FOSB/LIF/EPO/RARA/MEN1/SERPINE2/CYP1A1/SOD1/PARP1/CORIN/GJA1/NODAL/STC1/WNT4/CAPN2/H3-3A/TGFBR2/LGALS9/PTAFR/FOS/BSG/SLC19A1/STAT5B/LEP/FOSL1/CALR/OXTR/PAPPA/YTHDF3/EPOR/ITGB3/LOC102724560 | 66 |
| GO:0051701 | biological process involved in interaction with host | 66/3662 | 183/15509 | 9.39682e-05 | 0.000607019 | 0.000365051 | CD4/LTF/CD74/THOC3/HYAL2/MID2/CHMP5/ICAM1/HSP90AB1/CHMP4B/VAPA/KPNA3/SLC1A5/TRIM14/EFNB3/CD81/CD86/VAMP8/TRIM25/CD80/CXCR4/NUP153/NECTIN2/CHMP1A/TRIM5/TRIM22/SFTPD/ARL8B/ITGAV/SLC7A1/FURIN/EPHA2/EGFR/GSN/NCAM1/ITGB1/CCR5/INHBB/THOC7/ANPEP/TRIM68/SLC3A2/LGALS9/CXCL8/GYPA/CDK1/TRIM8/BCL2L1/BSG/DAG1/CHMP6/CIITA/EXOC7/SLC52A2/IFITM1/PLSCR1/HMGB1/PPIA/CD55/SRC/DPP4/WWP2/CR1/TRIM26/ITGB3/ITCH | 66 |
| GO:0043534 | blood vessel endothelial cell migration | 48/3662 | 123/15509 | 9.40208e-05 | 0.000607019 | 0.000365051 | ATP2B4/RHOA/FGFR1/ANGPT2/ABL1/PDGFB/MYH9/CD40/PRKD2/TGFB1/HSPB1/GADD45A/PTK2B/NR4A1/ID1/STAT5A/KDR/APOE/THBS1/CYP1B1/FGF2/EPHA2/SLIT2/PLK2/NOTCH1/ITGB1/VEGFC/PRKCA/NOS3/EFNA1/CIB1/CLN3/HMGB1/CSNK2B/TNF/TMSB4X/TNF/TNF/CSNK2B/CSNK2B/TNF/TNF/CSNK2B/TNF/TNF/TNF/CSNK2B/AKT3 | 48 |
| GO:0045471 | response to ethanol | 48/3662 | 123/15509 | 9.40208e-05 | 0.000607019 | 0.000365051 | BAD/BAK1/FGFR2/RHOA/ST6GAL1/OPRK1/OXCT1/SLC23A2/HAMP/GATA3/CSF3/RPS6KB1/CCND1/DNMT3A/CRHR1/PTK2B/CAT/CDO1/CYP2E1/RARA/PRKAA1/ACTR2/IGF1R/TNFRSF11A/SOD1/ALAD/VCAM1/TP53INP1/CYBB/CDK1/FOS/MGMT/CD14/PRKCE/LEP/GRIN1/TYMS/NQO1/ADIPOQ/RPL10A/TNF/TNF/TNF/TNF/TNF/TNF/TNF/TNF | 48 |
| GO:0097237 | cellular response to toxic substance | 48/3662 | 123/15509 | 9.40208e-05 | 0.000607019 | 0.000365051 | MPO/PTGS1/BMP7/GSR/PARK7/PRDX1/PRDX6/MTARC2/ABCG2/UBIAD1/CAT/APOE/PXDN/SESN2/GSTM1/CD36/SOD1/GSTO1/FANCC/FABP1/ALB/NOS3/TP53INP1/GPX4/NXN/PRDX2/NQO1/PRKN/TXNRD1/SELENOT/TNF/TNF/GPX3/LTC4S/HBE1/HBD/TNF/TNF/TNF/TNF/TNF/TNF/HBB/HP/SRXN1/TPO/GSTT1/LTC4S | 48 |
| GO:0002204 | somatic recombination of immunoglobulin genes involved in immune response | 24/3662 | 49/15509 | 9.43142e-05 | 0.000607019 | 0.000365051 | PARP3/FOXP3/TBX21/MLH1/PTPRC/MSH2/CD40/CD40LG/NBN/IL27RA/TGFB1/EXOSC3/NSD2/AICDA/IL4/BCL6/SHLD2/NDFIP1/IL10/SLC15A4/TNFSF13/LIG4/CD28/PTPRC | 24 |
| GO:0002208 | somatic diversification of immunoglobulins involved in immune response | 24/3662 | 49/15509 | 9.43142e-05 | 0.000607019 | 0.000365051 | PARP3/FOXP3/TBX21/MLH1/PTPRC/MSH2/CD40/CD40LG/NBN/IL27RA/TGFB1/EXOSC3/NSD2/AICDA/IL4/BCL6/SHLD2/NDFIP1/IL10/SLC15A4/TNFSF13/LIG4/CD28/PTPRC | 24 |
| GO:0045190 | isotype switching | 24/3662 | 49/15509 | 9.43142e-05 | 0.000607019 | 0.000365051 | PARP3/FOXP3/TBX21/MLH1/PTPRC/MSH2/CD40/CD40LG/NBN/IL27RA/TGFB1/EXOSC3/NSD2/AICDA/IL4/BCL6/SHLD2/NDFIP1/IL10/SLC15A4/TNFSF13/LIG4/CD28/PTPRC | 24 |
| GO:0008406 | gonad development | 73/3662 | 207/15509 | 9.45425e-05 | 0.000607857 | 0.000365555 | HOXA11/HSPA5/ARID4B/MSH4/HOXA9/LRP2/PGR/ATRX/BAX/MMP2/ESR1/MSH2/GATA1/PCYT1B/SFRP1/CASP2/TGFBR1/GATA3/CCND1/PDGFRB/WNT5A/IL1A/SDC1/FOXO3/EIF2B2/TNFSF10/INHBA/MEA1/EIF2S2/KDR/SOX15/BCL2L2/RARA/HSD17B4/PDGFRA/NKX2-1/CYP19A1/CYP1B1/BRCA2/ARRB2/SMAD4/SOD1/RAB13/REN/SLIT2/GAS2/ARID5B/DHX37/BCL2L11/ADAMTS1/MMP14/KIT/WNT4/H3-3A/INHBB/CASP3/TLR3/GDF9/NOS3/ZFPM2/BCL2L1/CEBPB/STAT5B/LEP/FZD4/A2M/SLIT3/ZP3/AKR1C3/SRC/NTRK1/FANCG/HOXA10 | 73 |
| GO:1902903 | regulation of supramolecular fiber organization | 109/3662 | 334/15509 | 9.46686e-05 | 0.000608038 | 0.000365663 | SCIN/SPAST/CYFIP2/RHOA/NAV3/ROCK1/SPTB/CDC42/WDR1/ARHGEF10L/ADD2/ACTN2/ADD1/TPX2/PXN/ABL1/HCK/COTL1/PYCARD/TJP1/SFRP1/ARHGEF10/MTPN/MET/TGFBR1/CXCL12/CSF3/RANGRF/CRYAB/HSPA8/ARPC3/PFDN1/DBN1/PARK7/CAPZA1/STMN1/CLU/PTK2B/IAPP/PFDN5/EML2/DSTN/ID1/CCR7/CDC42EP1/APOE/COLGALT1/ARPC1B/PPFIA1/WASF3/PSRC1/APC/DBNL/CCL21/NUMA1/RDX/ABI2/RB1/SLAIN1/BBS4/TBCD/SMAD4/APP/SLIT2/PIK3R1/ARHGAP18/C9orf72/GSN/CDC42EP2/PLEKHH2/DMTN/ARHGAP35/SPTBN4/ALOX15/WNT4/ARPC5/ANKRD23/CDC42EP3/SPTA1/PRKCD/ARFIP1/RICTOR/TTC8/S1PR1/PRKCE/CCL11/SPTBN2/CDK5R1/FLII/GRB2/PAK2/CIB1/INPP5J/PRKN/DRG1/NF2/CD47/GMFB/SPTAN1/MTOR/IQANK1/PFDN6/TMSB4X/PDXP/ARPC1A/TWF2/SHANK3/BRK1/TJP1 | 109 |
| GO:0001787 | natural killer cell proliferation | 13/3662 | 20/15509 | 9.69791e-05 | 0.000621589 | 0.000373813 | ELF4/IL12B/PTPN22/IL18/STAT5B/LEP/HLA-E/HLA-E/HLA-E/HLA-E/HLA-E/HLA-E/HLA-E | 13 |
| GO:0002864 | regulation of acute inflammatory response to antigenic stimulus | 13/3662 | 20/15509 | 9.69791e-05 | 0.000621589 | 0.000373813 | BTK/FCGR2B/PARK7/C3/CCR7/ZP3/HLA-E/HLA-E/HLA-E/HLA-E/HLA-E/HLA-E/HLA-E | 13 |
| GO:0014706 | striated muscle tissue development | 77/3662 | 221/15509 | 9.74095e-05 | 0.000623703 | 0.000375084 | IFRD1/IGF1/PKP2/ERBB3/MAP2K4/FGFR2/SIRT2/CDC42/SIRT6/ACTN2/TP73/LRP2/ZMPSTE24/NOX4/FKBP1A/DSP/ABL1/BMP7/SMAD7/NDRG4/NPRL3/EYA1/TGFB1/HAMP/GSK3A/MTPN/TGFBR1/ENG/BMPR1A/DKK1/MAPK14/BVES/SMAD5/PDGFRB/WNT5A/FHL2/ID2/TNNT2/OBSL1/BMP2/PRMT1/ALDH1A2/SOX15/TNNI3/RARA/MYH11/NOTCH2/PDGFRA/FGF2/ARRB2/SMAD4/NOTCH1/ITGB1/POU4F1/GJA1/SKI/TNNI1/RUNX1/LMNA/MAML1/PDLIM5/TGFBR2/SHH/FRS2/RBPJ/ZFPM2/CDK1/S1PR1/PLEC/CALR/SLC8A1/NKX2-5/NOG/ARID2/MTOR/MYH11/PTEN | 77 |
| GO:0061136 | regulation of proteasomal protein catabolic process | 65/3662 | 180/15509 | 0.000101313 | 0.000648029 | 0.000389714 | OSBPL7/RHBDF1/HFE/PSMC4/RNF14/UFL1/HERPUD1/ATXN3/SIRT2/PRKACA/MKRN2/SIRT6/UBE2K/GSK3B/XPO1/PSMC5/PSME1/HECTD1/BAG6/HSP90AB1/PSMC6/USP14/SMAD7/N4BP1/AXIN1/SGTA/GSK3A/DVL1/USP5/PARK7/CDC20/RAD23B/CLU/USP9X/CBFA2T3/APOE/PSME3/HSPBP1/CSNK1D/GNA12/TLK2/OGT/EIF3H/ALAD/RNF144A/USP25/PSMC2/RYBP/RCHY1/SHH/VCP/PSMC3/BTRC/GLMN/PRKN/USP7/SVIP/BAG6/BAG6/BAG6/BAG6/BAG6/CEBPA/PRKACA/F8A1 | 65 |
| GO:0014812 | muscle cell migration | 35/3662 | 82/15509 | 0.000102143 | 0.000652659 | 0.000392498 | IGF1/RHOA/ROCK1/PDGFB/APEX1/NDRG4/PLAT/SERPINE1/BMPR1A/RPS6KB1/MDK/PPARD/PDGFRB/NR4A3/GNA13/LRP1/TLR4/CCN3/SORL1/CYP1B1/SLIT2/GNA12/IGFBP3/ADAMTS1/ARPC5/S100A11/TERT/DDIT3/ADIPOQ/FOXO4/SRC/PARVA/ITGB3/CCL5/CCL5 | 35 |
| GO:0032526 | response to retinoic acid | 46/3662 | 117/15509 | 0.000105735 | 0.000673987 | 0.000405324 | CD38/EPHA3/TMEM161A/TIE1/FGFR2/GSK3B/MMP2/DKK1/WNT3/WNT5B/FZD10/PDGFRB/WNT5A/IGFBP2/PTK2B/ALDH1A2/RARA/ABL2/BMP6/AQP3/ZNF35/RARG/LEP/FZD4/WNT7B/GDAP2/IGF2R/RXRB/TNF/TNF/MICB/TNF/MICB/MICB/TNF/TNF/TNF/TNF/MICB/MICB/TNF/MICB/TWF2/OVCA2/WNT3/WNT3 | 46 |
| GO:0010888 | negative regulation of lipid storage | 15/3662 | 25/15509 | 0.000106024 | 0.000673987 | 0.000405324 | NFKBIA/PPARD/IL6/ITGAV/LEP/PTPN2/TNF/TNF/TNF/TNF/TNF/TNF/TNF/TNF/ITGB3 | 15 |
| GO:0042359 | vitamin D metabolic process | 15/3662 | 25/15509 | 0.000106024 | 0.000673987 | 0.000405324 | SNAI2/LRP2/CYP27B1/IFNG/CYP1A1/CYP3A4/GFI1/TNF/TNF/TNF/TNF/TNF/TNF/TNF/TNF | 15 |
| GO:0048143 | astrocyte activation | 15/3662 | 25/15509 | 0.000106024 | 0.000673987 | 0.000405324 | GRN/IFNG/LRP1/IL1B/NR1D1/IL6/APP/TNF/TNF/TNF/TNF/TNF/TNF/TNF/TNF | 15 |
| GO:0051797 | regulation of hair follicle development | 15/3662 | 25/15509 | 0.000106024 | 0.000673987 | 0.000405324 | CDH3/NGFR/FERMT1/WNT5A/NUMA1/SMAD4/MYSM1/TNF/TNF/TNF/TNF/TNF/TNF/TNF/TNF | 15 |
| GO:0051303 | establishment of chromosome localization | 32/3662 | 73/15509 | 0.000108605 | 0.000689687 | 0.000414765 | CENPQ/NDE1/MLH1/SPAG5/NDC80/PIBF1/SEH1L/CHMP5/ZW10/BIRC5/NUDC/CHMP4B/RAB11A/KAT2B/TTL/BECN1/CHMP1A/CCNB1/PSRC1/CDCA8/NUMA1/CENPE/KIF2C/CENPC/BOD1/GEM/KAT5/CHMP6/AURKB/KIFC1/NDE1/SPICE1 | 32 |
| GO:0043535 | regulation of blood vessel endothelial cell migration | 40/3662 | 98/15509 | 0.000112367 | 0.000712844 | 0.000428692 | ATP2B4/RHOA/FGFR1/ANGPT2/ABL1/PDGFB/CD40/PRKD2/TGFB1/HSPB1/GADD45A/STAT5A/KDR/APOE/THBS1/FGF2/EPHA2/PLK2/NOTCH1/VEGFC/PRKCA/NOS3/EFNA1/CIB1/HMGB1/CSNK2B/TNF/TMSB4X/TNF/TNF/CSNK2B/CSNK2B/TNF/TNF/CSNK2B/TNF/TNF/TNF/CSNK2B/AKT3 | 40 |
| GO:0050890 | cognition | 98/3662 | 296/15509 | 0.000114843 | 0.000727812 | 0.000437693 | ITGA3/PAFAH1B1/MAPK8IP2/UBA6/RASGRF1/DGCR2/PICALM/ITGA8/OPRK1/ABL1/ADNP/NDRG4/GPI/PTN/PPP3CB/DKK1/RPS6KB1/B3GAT1/MDK/ASIC1/SLC11A2/NEDD9/SOBP/PDE8B/CHST10/PAIP2/EGR2/THRA/MGAT3/APOE/SYT11/EPHB2/KRAS/NGF/ACTR2/BBS4/EIF4A3/APP/ARL6IP5/PLK2/TPBG/EGFR/VLDLR/NTRK2/EIF4EBP2/ITGB1/KIT/CBR3/BTG2/BRSK1/ZNF385A/CAMK2N1/CASP3/ADCY1/CDK5/TTC8/RAG1/SETD5/CX3CR1/RGS14/FOS/CCL11/CEBPB/FOSL1/BDNF/GRIN1/OXTR/PLCB1/NOG/BTBD9/CNTN2/PRKN/CLN3/FZD9/MME/GM2A/SRC/SYNGAP1/NTRK1/TAFA2/GPRASP3/TNF/HLA-DRA/TNF/TNF/HLA-DRA/TNF/TNF/TNF/HLA-DRA/TNF/TNF/HLA-DRA/SHANK3/B2M/HLA-DRA/GPI/PTEN | 98 |
| GO:0051961 | negative regulation of nervous system development | 55/3662 | 147/15509 | 0.00011577 | 0.000732936 | 0.000440775 | TMEM98/IFRD1/CDH1/NTN1/KDM4A/SIRT2/PCM1/BMP7/PTN/BMPR1A/DKK1/WNT3/EFNB3/WNT5A/HES1/SPP1/IL1B/ID1/NR1D1/YWHAH/EPHB2/LRP4/IL6/KIAA0319/SORL1/RB1/DUSP10/CTDSP1/NOTCH1/DPYSL5/SKI/ELAPOR2/CDK5/SEMA4C/SEMA3E/CCL11/F2/NOG/NF2/DCC/SYNGAP1/MBP/GDI1/TNF/TNF/TNF/TNF/TNF/TNF/TNF/TNF/B2M/WNT3/WNT3/PTEN | 55 |
| GO:0006909 | phagocytosis | 81/3662 | 236/15509 | 0.000116112 | 0.000734348 | 0.000441624 | ITGAL/BTK/TYROBP/SLC11A1/CYBA/CDC42/FCGR2B/PTPRC/P2RX7/CEBPE/ABL1/MYH9/HCK/SRPX/PYCARD/CSK/MET/CCL2/CORO1C/IFNG/LEPR/LRP1/IL1B/C3/BECN1/RAC2/RARA/SYT11/SFTPD/ARL8B/CD36/TLR4/THBS1/ITGAV/IRF8/SOD1/LYST/IL2RG/GSN/ITGB1/MERTK/APPL1/XKR8/ITGB2/ALOX15/PRKCD/SYK/ARHGAP12/MBL2/NOD2/RHOH/PTK2/ITGAM/CD14/PRKCE/LEP/CALR/ADIPOQ/ADGRB1/PLSCR1/CLN3/HMGB1/PRTN3/CD47/SRC/ELANE/TGM2/TNF/TNF/TNF/TNF/TNF/TNF/TNF/TNF/CD302/ITGB3/PECAM1/PTPRC/ELANE/PRTN3 | 81 |
| GO:0051051 | negative regulation of transport | 124/3662 | 390/15509 | 0.000117117 | 0.000739949 | 0.000444992 | RHBDF1/CRY1/CD74/TNFRSF1B/EPHA3/ATP9A/KCNH2/ERBB3/SPI1/SP100/VPS35/FCGR2B/DERL2/PICALM/LMAN1/SIRT6/ACTN2/OPRK1/OSM/RANGAP1/MMP9/FERMT1/NDFIP2/CSK/SFRP1/LILRB1/CD33/HAMP/GSK3A/SFRP4/PPP3CB/PPIF/UNC119/CRYAB/PSMD9/ASIC1/IL12B/HES1/PARK7/VAMP8/PKD2/CRHR1/PTK2B/CRY2/INHBA/SEMG1/NUP153/IL1B/PNKD/LIF/APOE/EPO/NDFIP1/SYT11/EPHB2/CD36/MDFIC/SERPINE2/ISCU/CCN3/THBS1/ITGAV/EGF/TMBIM6/CALM2/ARL6IP5/SNX12/NOTCH1/GSTO1/FOXO1/BAG3/GJA1/APPL1/DMTN/STC1/CALM3/PEA15/INHBB/C4orf3/ARFIP1/SHH/NOS3/CDK5/GEM/SLC43A2/PXK/PKIG/LGALS9/PRKCE/LEP/PTPN11/YOD1/OXTR/ADIPOQ/F2R/ANXA2/ADRA2C/PRKN/KCNJ11/PLSCR1/HMGB1/PRTN3/CD47/SVIP/PIM3/WWP2/UBE2J1/GDI1/TNF/TNF/FIS1/TNF/TNF/TNF/TNF/TNF/TNF/ITGB3/LILRB1/LILRB1/LILRB1/PRTN3/LILRB1/PTEN | 124 |
| GO:0042092 | type 2 immune response | 18/3662 | 33/15509 | 0.000122132 | 0.000770852 | 0.000463577 | CD74/TBX21/IL4R/ARG2/IL27RA/GATA3/CD81/IL4/BCL6/CD86/ARG1/NDFIP1/RARA/IL6/HLX/IL10/IL18/NOD2 | 18 |
| GO:0030010 | establishment of cell polarity | 51/3662 | 134/15509 | 0.000122597 | 0.000772996 | 0.000464866 | PAFAH1B1/SDCCAG8/RHOA/ROCK1/CDC42/MARK2/FBXW11/NDE1/LLGL2/SPAG5/NDC80/GSK3B/RAB10/ZW10/NSFL1C/HSP90AB1/ABL1/MYH9/FERMT1/LAMA1/GATA3/CYTH1/AMOTL2/WNT5A/HES1/PTK2B/CCR7/PLEKHG3/FOXJ1/FLOT2/SPRY2/CCL21/NUMA1/IGF1R/ABL2/SNX27/MSN/GSN/PARD3/ITGB1/GJA1/BRSK1/RICTOR/SHH/TTC8/WEE1/PTK2/CCL19/KAT5/BRSK2/NDE1 | 51 |
| GO:0051100 | negative regulation of binding | 57/3662 | 154/15509 | 0.000123516 | 0.000777998 | 0.000467874 | KDM1A/HFE/SP100/ROCK1/ACTB/RAP1GAP/GSK3B/BAX/TFIP11/CYP2D6/PDGFB/NFKBIA/ADNP/GATA1/TLE5/DVL1/MAPK8/DKK1/ITGA4/PARK7/IFIT2/TEX14/CDKN1A/ID1/PIN1/PER2/IL10/SORL1/TDG/TMBIM6/ARRB2/EIF4A3/C9orf72/HMGA2/PEX19/DISC1/PRKCD/C4orf3/GOLGA2/ADRB2/ATP2A2/DDIT3/JUN/CTNNBIP1/AURKB/ADIPOQ/RGMA/NOG/SUMO3/TMSB4X/CPNE1/CYP2D6/B2M/CYP2D6/CYP2D6/CYP2D6/CYP2D6 | 57 |
| GO:0070884 | regulation of calcineurin-NFAT signaling cascade | 22/3662 | 44/15509 | 0.000124415 | 0.000782868 | 0.000470803 | PTBP1/IGF1/ATP2B4/ERBB3/GSK3B/NFAT5/PPP3CB/FHL2/DYRK2/SPPL3/CHP2/CIB1/MTOR/TNF/TNF/STIMATE/TNF/TNF/TNF/TNF/TNF/TNF | 22 |
| GO:0045927 | positive regulation of growth | 80/3662 | 233/15509 | 0.000125741 | 0.000790366 | 0.000475312 | CD38/PAFAH1B1/IGF1/CYBA/NTN1/FGFR2/RHOA/CDC42/DERL2/SLC23A2/KDM2B/ADNP/SMAD7/SFRP1/IL7/DDX49/HAMP/MTPN/BRAT1/TGFBR1/CXCL12/BMPR1A/WNT3/RPS6KB1/ZPR1/EIF4G2/PPARD/MAPK14/HBEGF/DBN1/FN1/GPAM/SERP1/PTK2B/CXCR4/SOX15/NGF/DBNL/HLX/NCBP1/FGF2/BBS4/CRABP2/SYT2/EGFR/NOTCH1/POU4F2/MMP14/SPTBN4/DISC1/H3-3A/TGFBR2/RICTOR/FXN/RBPJ/CDKN2AIP/ZFPM2/CDK1/LPAR3/SLC25A33/STAT5B/LEP/RAG2/BDNF/CDH4/F2/PLCB1/CSF1/POU3F2/CIB1/PRKN/PRR5/TEAD1/ZP3/MTOR/GDI1/TWF2/GH1/WNT3/WNT3 | 80 |
| GO:0007179 | transforming growth factor beta receptor signaling pathway | 67/3662 | 188/15509 | 0.000125862 | 0.000790366 | 0.000475312 | ITGA3/HSPA5/ARID4B/HIPK2/SPI1/ITGA8/FKBP1A/PXN/GLG1/HSP90AB1/FERMT1/SMAD7/RBBP7/AXIN1/TGFB1/TGFBR1/ENG/BMPR1A/ZMIZ1/LPXN/FOLR1/ZNF451/SMAD5/HDAC1/FMOD/USP9X/BMP2/ID1/PIN1/TWSG1/CDKN1C/GDF15/MEN1/SPRY2/NKX2-1/THBS1/SMAD6/TET1/FBN2/FURIN/ARRB2/SMAD4/PARP1/OGT/ZEB1/NODAL/APPL1/SKI/RBBP4/TGFBR2/SAP30/GDF9/HTRA1/ADAM9/PTK2/ZEB2/FOS/SMAD2/EID2/JUN/ZNF703/BCL9L/SRC/TRIM33/SLC2A10/SPRED2/CDKN1C | 67 |
| GO:0030889 | negative regulation of B cell proliferation | 12/3662 | 18/15509 | 0.00012721 | 0.000795607 | 0.000478464 | BTK/TYROBP/FCGR2B/PKN1/IL10/TNFRSF21/CTLA4/CASP3/INPP5D/TNFRSF13B/INPP5D/PTEN | 12 |
| GO:0042772 | DNA damage response, signal transduction resulting in transcription | 12/3662 | 18/15509 | 0.00012721 | 0.000795607 | 0.000478464 | HIPK2/SP100/RPS6KA6/ZNHIT1/FOXM1/CDKN1A/BRCA2/ZNF385A/RPL26/KAT5/CHEK2/MUC1 | 12 |
| GO:0043371 | negative regulation of CD4-positive, alpha-beta T cell differentiation | 12/3662 | 18/15509 | 0.00012721 | 0.000795607 | 0.000478464 | RUNX3/FOXP3/CBFB/TBX21/IL4R/SMAD7/JAK3/IL4/BCL6/HLX/RUNX1/HMGB1 | 12 |
| GO:0051315 | attachment of mitotic spindle microtubules to kinetochore | 12/3662 | 18/15509 | 0.00012721 | 0.000795607 | 0.000478464 | NDC80/SEH1L/BIRC5/KAT2B/BECN1/CDCA8/CENPE/KIF2C/CENPC/BOD1/KAT5/AURKB | 12 |
| GO:0072006 | nephron development | 50/3662 | 131/15509 | 0.000130926 | 0.000818026 | 0.000491947 | HOXA11/ITGA3/PROM1/SEC61A1/NOTCH3/ANGPT2/PDGFB/BMP7/EYA1/TMEM59L/GATA3/ACTA2/PDGFRB/HES1/STAT1/PKD2/TEK/EGR1/NUP85/BMP2/LIF/PODXL/FOXJ1/LAMA5/NOTCH2/PDGFRA/AHI1/EDNRB/PLCE1/FGF2/ENPEP/GREB1L/SMAD4/ADAMTS16/KLHL3/NOTCH1/IL6R/WNT4/HEYL/SHH/LAMB2/CTNNBIP1/ADIPOQ/NOG/PBX1/MAGI2/WNT7B/ITGB3/PECAM1/CD24 | 50 |
| GO:0008380 | RNA splicing | 121/3662 | 380/15509 | 0.000131353 | 0.000819865 | 0.000493052 | KDM1A/PTBP1/CLK1/ZCCHC8/THOC3/SNRNP40/DDX20/DAZAP1/FAM50A/MBNL3/DDX1/ATXN7L3/RTRAF/SF3B2/FUS/RBM41/HNRNPC/CWF19L1/CIRBP/SNRPD3/TFIP11/SNU13/RBFOX2/ACIN1/PNN/PRPF6/ESRP1/SNRNP70/YJU2/CASC3/C1QBP/DDX5/EFTUD2/ZPR1/HSPA8/SRSF9/FAM172A/PPP2CA/KAT2B/NCL/SF3B1/SRSF7/SRSF4/PRPF3/PTBP2/PRDX6/PTBP3/NRDE2/TARDBP/COIL/SMU1/SNRPC/AHNAK/RNF113A/HNRNPR/RALY/RBM42/PRMT1/SCAF1/HNRNPH2/AAR2/GRSF1/PRMT7/RBM17/SRPK2/HNRNPA1/TAF5L/SRSF1/PRPF4/NCBP1/DBR1/CIR1/SCAF11/SNRPF/TMBIM6/DHX38/EIF4A3/SF3B4/SNRPG/PIK3R1/WTAP/LUC7L2/NONO/RBMX/TRPT1/CWC15/MBNL1/CWC27/TAF6L/RBM15/THOC7/CCNL1/FASTK/RPUSD4/SNRPD1/CDK12/SRRM2/SNRNP48/USP39/HNRNPH1/ZRSR2/HNRNPA3/TADA3/SMN1/CLP1/LARP7/PUS1/ERN1/NPM1/RBM10/RNPC3/TRRAP/UBL5/LSM2/CCNL2/RBM15B/SRSF8/RBM8A/SRSF1/PRPF8/TAF15 | 121 |
| GO:2000117 | negative regulation of cysteine-type endopeptidase activity | 36/3662 | 86/15509 | 0.000132318 | 0.00082506 | 0.000496176 | LTF/HGF/BIRC3/CD44/BIRC5/MMP9/BIRC7/GPI/DNAJB6/CRYAB/PARK7/NR4A1/MICAL1/THBS1/ARRB2/CAST/FABP1/INTS1/RAG1/SERPINB9/TRIAP1/PAK2/SRC/TNF/TNF/MAGEA3/TNF/TNF/TNF/TNF/TNF/TNF/NAIP/NAIP/NAIP/GPI | 36 |
| GO:2000810 | regulation of bicellular tight junction assembly | 16/3662 | 28/15509 | 0.000139957 | 0.000871813 | 0.000524293 | SNAI2/ROCK1/PRKACA/TJP1/IL17A/EPHA2/TNF/TNF/TNF/TNF/TNF/TNF/TNF/TNF/TJP1/PRKACA | 16 |
| GO:0043516 | regulation of DNA damage response, signal transduction by p53 class mediator | 19/3662 | 36/15509 | 0.000142705 | 0.000886257 | 0.00053298 | KDM1A/SNAI2/CD74/CD44/ZMPSTE24/YJU2/ZNHIT1/DDX5/SOX4/EEF1E1/PMAIP1/DYRK3/ZNF385A/RPL26/NPM1/PTTG1IP/KMT5A/SPRED2/MIF | 19 |
| GO:0098581 | detection of external biotic stimulus | 19/3662 | 36/15509 | 0.000142705 | 0.000886257 | 0.00053298 | NOD1/TLR4/NOD2/HLA-B/HLA-A/HLA-A/HLA-B/HLA-A/HLA-A/HLA-B/HLA-A/HLA-B/HLA-A/HLA-A/HLA-B/HLA-A/NAIP/NAIP/NAIP | 19 |
| GO:1903749 | positive regulation of establishment of protein localization to mitochondrion | 19/3662 | 36/15509 | 0.000142705 | 0.000886257 | 0.00053298 | CSNK2A2/SH3GLB1/GZMB/PDCD5/GSK3A/MAPK8/RAC2/PRKAA1/NMT1/SAE1/BAP1/ATG13/UBE2L3/UBL5/HSPA1L/HSPA1L/HSPA1L/HSPA1L/HSPA1L | 19 |
| GO:0042590 | antigen processing and presentation of exogenous peptide antigen via MHC class I | 14/3662 | 23/15509 | 0.000145818 | 0.000904687 | 0.000544063 | TAP1/TAP1/HLA-A/HLA-A/HLA-A/TAP1/HLA-A/TAP1/HLA-A/TAP1/HLA-A/TAP1/HLA-A/HLA-A | 14 |
| GO:0060627 | regulation of vesicle-mediated transport | 149/3662 | 484/15509 | 0.000146563 | 0.0009084 | 0.000546296 | SELE/BTK/HFE/CD22/SLC11A1/GAB2/AP2S1/EPHA3/C12orf4/CYBA/ATP9A/SPI1/ROCK1/CDC42/FCGR2B/PICALM/NSF/STXBP2/IL4R/ACTN2/PTPRC/GSK3B/RAB10/RAPGEF4/ABL1/HCK/GATA1/NDRG4/TSC2/PYCARD/CSK/RAB11A/EHD4/LILRB1/TFR2/SERPINE1/SFRP4/DVL1/PPP3CB/DKK1/SEPTIN4/CCL2/RAB5C/UNC119/IFNG/BVES/IL4/WNT5A/SNX4/SNX17/SDC1/RIMS3/VAMP8/CLU/LRP1/ACSL3/IL1B/C3/RAC2/APOE/PRKAA1/SYT11/CPLANE2/SFTPD/CD36/AHI1/MICAL1/STXBP1/CCL21/SORL1/RDX/PREPL/ITGAV/EGF/ARRB2/SOD1/ABL2/RAB13/SNAPIN/SYT2/CPLX2/MSN/SNX12/IL2RG/NOTCH1/BICD1/MERTK/APPL1/LDLRAP1/CALM3/ITGB2/AP2M1/ALOX15/ARFIP1/ADCY1/CDK5/SYK/TRPV6/MBL2/NOD2/SEPTIN2/LGALS9/PTAFR/ITGAM/PDCD6IP/CD14/FGG/FGA/CCL19/ATP2A2/CDK5R1/CALR/MAPK15/ADIPOQ/CACNB4/ANXA2/BTBD9/PRKN/HGS/MAGI2/USP7/PLSCR1/ZP3/CLN3/HMGB1/PRTN3/CACNA1H/CD47/PGAP1/SRC/TGM2/TNF/CD177/TNF/TNF/TNF/TNF/TNF/TNF/TNF/ITGB3/PTPRC/B2M/LILRB1/LILRB1/TRPV6/LILRB1/PRTN3/LILRB1 | 149 |
| GO:0046209 | nitric oxide metabolic process | 32/3662 | 74/15509 | 0.000148427 | 0.00091903 | 0.000552689 | CPS1/ATP2B4/ARG2/HSP90AB1/CYB5R3/ACP5/IFNG/MTARC2/PKD2/CLU/PTK2B/IL1B/ASS1/CD36/IL10/TLR4/CYP1B1/DDAH1/NOS3/CX3CR1/NQO1/TRPV1/CD47/TNF/TNF/TNF/TNF/TNF/TNF/TNF/TNF/HBB | 32 |
| GO:0044706 | multi-multicellular organism process | 67/3662 | 189/15509 | 0.000150606 | 0.000930194 | 0.000559403 | CD38/ITGA3/TAC1/HEXB/PRDM1/VMP1/EPN1/DAZAP1/FBLN1/PGR/OVGP1/TMED2/MMP2/ESR1/ANGPT2/MMP9/SYDE1/KLF1/PTN/AMBP/C1QBP/CALCA/CYP27B1/VDR/PPARD/IGFBP2/ASH1L/SLC2A1/ARG1/SPP1/PGF/CRHR1/RECK/SEMG1/IL1B/FOSB/LIF/EPO/RARA/MEN1/SERPINE2/CYP1A1/SOD1/PARP1/CORIN/GJA1/NODAL/STC1/WNT4/CAPN2/H3-3A/TGFBR2/LGALS9/PTAFR/FOS/BSG/SLC19A1/STAT5B/LEP/FOSL1/CALR/OXTR/PAPPA/YTHDF3/EPOR/ITGB3/LOC102724560 | 67 |
| GO:0045453 | bone resorption | 26/3662 | 56/15509 | 0.00015068 | 0.000930194 | 0.000559403 | CD38/NOX4/P2RX7/ACP5/CSK/IL7/HAMP/CALCA/TNFAIP3/SPP1/PTK2B/IAPP/IL6/DEF8/TNFRSF11A/PRKCA/TNFRSF11B/SYK/INPP5D/ADRB2/S1PR1/GPR137/CSF1R/SRC/ITGB3/INPP5D | 26 |
| GO:0046824 | positive regulation of nucleocytoplasmic transport | 26/3662 | 56/15509 | 0.00015068 | 0.000930194 | 0.000559403 | CDH1/IPO5/HYAL2/PRKACA/SIRT6/GSK3B/MAVS/HSP90AB1/TGFB1/ZPR1/IFNG/MAPK14/NRDE2/TARDBP/IL1B/XPO4/ANP32B/PIK3R1/TCF7L2/BAG3/PRKCD/SHH/CHP2/CDK1/LEP/PRKACA | 26 |
| GO:0031060 | regulation of histone methylation | 31/3662 | 71/15509 | 0.000151171 | 0.000932296 | 0.000560666 | KDM1A/KMT2E/PAF1/AASS/KDM4A/ATRX/DNMT3B/SMARCB1/GATA3/MACROH2A1/KDM3A/MYB/PHF19/PRDM12/DNMT1/TET1/SKIC8/SMAD4/OGT/NSD3/SMARCA5/RNF20/LMNA/GFI1/PYGO2/NSD1/NNMT/HCFC1/PAX5/WDR5/SMARCB1 | 31 |
| GO:2000756 | regulation of peptidyl-lysine acetylation | 30/3662 | 68/15509 | 0.000153162 | 0.000942318 | 0.000566694 | NFYA/KMT2E/BAZ1B/SNAI2/FOXP3/NFYC/SPI1/ZMPSTE24/SMARCB1/GATA3/ZNF451/SF3B1/PARK7/SOX4/DEK/LIF/PRKAA1/MYBBP1A/WBP2/SMAD4/SMARCA5/CTBP1/PYGO2/BRD7/SETD5/TAF7/MUC1/NOC2L/SMARCB1/TADA2A | 30 |
| GO:0051205 | protein insertion into membrane | 27/3662 | 59/15509 | 0.000153176 | 0.000942318 | 0.000566694 | AGK/SEC61A1/BAX/BAG6/TIMM13/SAMM50/GZMB/TIMM9/UBL4A/SGTA/PDCD5/MAPK8/CCDC47/EMC3/EMC4/TIMM10B/NMT1/EGFR/TIMM8B/EMC10/TOMM20/TOMM5/BAG6/BAG6/BAG6/BAG6/BAG6 | 27 |
| GO:0010595 | positive regulation of endothelial cell migration | 39/3662 | 96/15509 | 0.000153252 | 0.000942318 | 0.000566694 | GRN/FLT4/FGFR1/ABL1/PDGFB/CD40/GPI/PRKD2/TGFB1/PIK3CG/MET/HSPB1/GATA3/SMOC2/WNT5A/NRP2/TEK/PTK2B/RRAS/STAT5A/KDR/THBS1/FGF2/EGF/RHOB/PLK2/VEGFC/PRKCA/EMC10/NOS3/CALR/CIB1/HMGB1/TMSB4X/ZNF580/PDCD6/ITGB3/AKT3/GPI | 39 |
| GO:0014910 | regulation of smooth muscle cell migration | 29/3662 | 65/15509 | 0.00015426 | 0.000946985 | 0.0005695 | IGF1/RHOA/PDGFB/APEX1/NDRG4/SERPINE1/BMPR1A/RPS6KB1/MDK/PPARD/PDGFRB/NR4A3/GNA13/LRP1/TLR4/SORL1/CYP1B1/SLIT2/GNA12/IGFBP3/ADAMTS1/S100A11/TERT/ADIPOQ/FOXO4/SRC/ITGB3/CCL5/CCL5 | 29 |
| GO:0035306 | positive regulation of dephosphorylation | 28/3662 | 62/15509 | 0.000154317 | 0.000946985 | 0.0005695 | PTBP1/ROCK1/PTPRC/PPP1R15A/HSP90AB1/PPP1R16B/TGFB1/CD33/IFNG/PPP2R5D/PDGFRB/PTPA/BMP2/PIN1/CALM2/GNA12/SPPL3/PPP1R15B/CALM3/PRKCD/NSMF/CHP2/ANKLE2/MAGI2/PPIA/SRC/MTOR/PTPRC | 28 |
| GO:0042692 | muscle cell differentiation | 111/3662 | 345/15509 | 0.000155371 | 0.000952509 | 0.000572822 | KDM1A/IFRD1/SPAG9/CD9/PTBP1/IGF1/BARX2/MAP2K4/FGFR2/WDR1/IL4R/SIRT6/ACTN2/ITGA8/ZMPSTE24/NOX4/XBP1/PDGFB/MYH9/NFATC2/LAMA1/PIEZO1/OLFM2/TGFB1/HAMP/GSK3A/MTPN/ZNHIT1/EZH2/ENG/PPP3CB/BMPR1A/DKK1/CNTNAP1/CD81/WNT5B/MAPK14/BVES/IL4/PDGFRB/HES1/FHL2/ID2/SDC1/BCL9/TNNT2/MORF4L2/OBSL1/BMP2/GDF15/DNMT1/SYNE1/RARA/MYH11/KRAS/PDGFRA/AKIRIN2/LAMC1/EDNRB/CCN3/MYOF/TARBP2/RB1/ARRB2/SMAD4/SYPL2/KCNH1/ANK2/NOTCH1/ZEB1/ITGB1/UCHL1/MMP14/KIT/SKI/LMNA/MAML1/SELENON/WNT4/CAPN2/H3-3A/PDLIM5/ANKRD23/CASP3/SHH/GPER1/FRS2/RBPJ/SEMA4C/CDK1/CDH2/LAMB2/ATP2A2/GLMN/BDNF/FLII/PLEC/CALR/ADGRB1/CACNB4/SLC8A1/NKX2-5/SETD3/FOXO4/STAC3/P2RX2/CACNA1H/MRTFA/MTOR/ZBED6/MYH11 | 111 |
| GO:0048871 | multicellular organismal homeostasis | 151/3662 | 492/15509 | 0.000155715 | 0.000953679 | 0.000573526 | CD38/KDM1A/USH1C/ADIPOR2/PROM1/HFE/LTF/SLC11A1/CDH3/HYAL2/TFE3/PRKACA/ACADVL/TP63/ACTB/IL4R/SIRT6/NOX4/ACHE/BAX/P2RX7/LYZ/SCD/CHMP4B/GATA1/ACP5/CSK/TJP1/IL7/HAMP/MET/HSPB1/CDH23/MAP2K6/CALCA/SLC11A2/RHAG/IL17A/IL4/NPHP3/IL1A/KDM3A/PASK/EPAS1/AMPD2/LEPR/MFN2/SLC2A1/PRDX1/STMN1/TNFAIP3/SPP1/NR4A3/EGR1/PTK2B/IAPP/CXCR4/USP45/IL1B/ID1/THRA/NR1D1/KDR/PER2/PRKAA1/SFTPD/KRAS/APC/CD36/LAMC1/EDNRB/IL6/TLR4/IRF4/COL2A1/RB1/IGF1R/BBS4/DEF8/TNFRSF11A/SOD1/FLG/PDGFC/OGT/UGCG/LCN2/NOTCH1/CDHR1/ITGB1/IL18/FOXO1/GJA1/BMP6/PRKCA/DRAM2/CLDN12/ADIPOR1/OMA1/ALB/BAP1/TNFRSF11B/NOS3/SYK/AQP3/NOD2/ABCA3/RBPJ/NKIRAS2/INPP5D/ADRB2/S1PR1/ALK/KSR2/CEBPB/IQCB1/GPR137/LEP/DDIT3/PLEC/PTPN11/BBS10/OXTR/ADIPOQ/F2R/CSF1R/BTBD9/CSF1/TRPV1/SRC/SLC22A5/NKIRAS1/MBP/GIGYF2/TNF/TNF/EBF2/TNF/TNF/TNF/TNF/TNF/TNF/PGAM5/ITGB3/PECAM1/B2M/AKT3/TJP1/INPP5D/SQSTM1/PRKACA | 151 |
| GO:0045137 | development of primary sexual characteristics | 73/3662 | 210/15509 | 0.000157952 | 0.000966421 | 0.000581189 | HOXA11/HSPA5/ARID4B/MSH4/HOXA9/LRP2/PGR/ATRX/BAX/MMP2/ESR1/MSH2/GATA1/PCYT1B/SFRP1/CASP2/TGFBR1/GATA3/CCND1/PDGFRB/WNT5A/IL1A/SDC1/FOXO3/EIF2B2/TNFSF10/INHBA/MEA1/EIF2S2/KDR/SOX15/BCL2L2/RARA/HSD17B4/PDGFRA/NKX2-1/CYP19A1/CYP1B1/BRCA2/ARRB2/SMAD4/SOD1/RAB13/REN/SLIT2/GAS2/ARID5B/DHX37/BCL2L11/ADAMTS1/MMP14/KIT/WNT4/H3-3A/INHBB/CASP3/TLR3/GDF9/NOS3/ZFPM2/BCL2L1/CEBPB/STAT5B/LEP/FZD4/A2M/SLIT3/ZP3/AKR1C3/SRC/NTRK1/FANCG/HOXA10 | 73 |
| GO:0072089 | stem cell proliferation | 43/3662 | 109/15509 | 0.000159862 | 0.000977146 | 0.000587639 | KDM1A/SNAI2/EIF2AK2/TP63/SIRT6/FBLN1/XRCC5/PTPRC/MECOM/ABCB1/FERMT1/ERCC2/CCNE1/RNF43/WNT3/WNT5A/PRRX1/IRF6/RUNX2/KDR/FGF2/ETV6/BRCA2/NOTCH1/HMGA2/VEGFC/GJA1/RUNX1/TGFBR2/TERT/SHH/RBPJ/RARG/LIG4/PBX1/ZFP36L1/NF2/WNT7B/CEBPA/YJEFN3/PTPRC/WNT3/WNT3 | 43 |
| GO:0032435 | negative regulation of proteasomal ubiquitin-dependent protein catabolic process | 20/3662 | 39/15509 | 0.000160968 | 0.000982937 | 0.000591121 | HFE/BAG6/HSP90AB1/USP14/N4BP1/SGTA/PARK7/USP9X/TLK2/OGT/EIF3H/RYBP/SHH/USP7/SVIP/BAG6/BAG6/BAG6/BAG6/BAG6 | 20 |
| GO:0001780 | neutrophil homeostasis | 11/3662 | 16/15509 | 0.000163612 | 0.000990788 | 0.000595843 | BTK/MTHFD1/SH2B3/MPL/IL6/MERTK/XKR8/CXCR2/CSF1/PDE4B/HMGB1 | 11 |
| GO:0002424 | T cell mediated immune response to tumor cell | 11/3662 | 16/15509 | 0.000163612 | 0.000990788 | 0.000595843 | AHR/MR1/HMGB1/HLA-A/HLA-A/HLA-A/HLA-A/HLA-A/HLA-A/HLA-A/HLA-A | 11 |
| GO:0020027 | hemoglobin metabolic process | 11/3662 | 16/15509 | 0.000163612 | 0.000990788 | 0.000595843 | ALAS1/HPX/CAT/INHBA/PRMT1/EPO/ABCB10/SLC25A37/ALAS2/EPB42/AHSP | 11 |
| GO:0031620 | regulation of fever generation | 11/3662 | 16/15509 | 0.000163612 | 0.000990788 | 0.000595843 | IL1B/EDNRB/TNFRSF11A/TNF/TNF/TNF/TNF/TNF/TNF/TNF/TNF | 11 |
| GO:0046643 | regulation of gamma-delta T cell activation | 11/3662 | 16/15509 | 0.000163612 | 0.000990788 | 0.000595843 | PTPRC/LILRB1/SOX4/SYK/NOD2/STAT5B/PTPRC/LILRB1/LILRB1/LILRB1/LILRB1 | 11 |
| GO:0071635 | negative regulation of transforming growth factor beta production | 11/3662 | 16/15509 | 0.000163612 | 0.000990788 | 0.000595843 | TYROBP/CDH3/HSP90AB1/LILRB1/FN1/FURIN/CD24/LILRB1/LILRB1/LILRB1/LILRB1 | 11 |
| GO:0097048 | dendritic cell apoptotic process | 11/3662 | 16/15509 | 0.000163612 | 0.000990788 | 0.000595843 | LILRB1/CXCL12/CCR7/CCL21/LGALS9/BCL2L1/CCL19/LILRB1/LILRB1/LILRB1/LILRB1 | 11 |
| GO:2000668 | regulation of dendritic cell apoptotic process | 11/3662 | 16/15509 | 0.000163612 | 0.000990788 | 0.000595843 | LILRB1/CXCL12/CCR7/CCL21/LGALS9/BCL2L1/CCL19/LILRB1/LILRB1/LILRB1/LILRB1 | 11 |
| GO:0008064 | regulation of actin polymerization or depolymerization | 53/3662 | 142/15509 | 0.000164012 | 0.000990788 | 0.000595843 | SCIN/CYFIP2/RHOA/SPTB/WDR1/ADD2/ACTN2/ADD1/HCK/COTL1/PYCARD/MTPN/CXCL12/CSF3/ARPC3/DBN1/CAPZA1/PTK2B/DSTN/CCR7/CDC42EP1/ARPC1B/DBNL/CCL21/RDX/BBS4/SLIT2/ARHGAP18/GSN/CDC42EP2/PLEKHH2/DMTN/ARHGAP35/SPTBN4/ALOX15/ARPC5/CDC42EP3/SPTA1/PRKCD/RICTOR/PRKCE/CCL11/SPTBN2/FLII/GRB2/SPTAN1/MTOR/IQANK1/TMSB4X/PDXP/ARPC1A/TWF2/BRK1 | 53 |
| GO:0032147 | activation of protein kinase activity | 53/3662 | 142/15509 | 0.000164012 | 0.000990788 | 0.000595843 | IGF1/SLC11A1/MARK2/TRAF4/PIBF1/TPX2/ABL1/PDGFB/ADNP/AXIN1/AREG/CALCA/HBEGF/IL12B/IL4/CD86/WNT5A/MOB1A/PARK7/TNFRSF10B/PTK2B/EPO/CHI3L1/BORA/EGF/PDGFC/EGFR/IL18/IL6R/DBF4B/TGFBR2/PRKCD/TLR3/ADRB2/GPRC5C/MOB3A/LEP/CDK5R1/ADRA2C/IRAK1/SOCS1/PPIA/SRC/MTOR/DAXX/DAXX/DAXX/DAXX/DAXX/ITGB3/GH1/CCL5/CCL5 | 53 |
| GO:0050768 | negative regulation of neurogenesis | 53/3662 | 142/15509 | 0.000164012 | 0.000990788 | 0.000595843 | TMEM98/IFRD1/CDH1/NTN1/KDM4A/SIRT2/PCM1/BMP7/PTN/BMPR1A/WNT3/EFNB3/WNT5A/HES1/SPP1/IL1B/ID1/NR1D1/YWHAH/EPHB2/LRP4/IL6/KIAA0319/SORL1/RB1/DUSP10/CTDSP1/NOTCH1/DPYSL5/SKI/CDK5/SEMA4C/SEMA3E/CCL11/F2/NOG/NF2/DCC/SYNGAP1/MBP/GDI1/TNF/TNF/TNF/TNF/TNF/TNF/TNF/TNF/B2M/WNT3/WNT3/PTEN | 53 |
| GO:0052547 | regulation of peptidase activity | 121/3662 | 382/15509 | 0.00016748 | 0.00101075 | 0.000607849 | BAD/CASP10/LTF/HGF/BIRC3/FAS/CD44/BAK1/GRN/CYFIP2/NGFR/RHOA/ROCK1/PSME4/TP63/PICALM/FBLN1/BAX/PEBP1/BIRC5/PSME1/PSMA3/MMP9/BIRC7/USP14/MEFV/PYCARD/PDCD5/GPI/TFPI2/DNAJB6/NOD1/CASP2/SERPINE1/AMBP/CRYAB/PERP/FN1/HSPE1/PARK7/HDAC1/FASLG/SERPINC1/TNFSF10/RECK/NR4A1/LRP1/SEMG1/C3/SPINK2/ADRM1/PSME3/NGF/AKIRIN2/MICAL1/SERPINE2/TANK/ANP32B/MTCH1/SORL1/THBS1/BCL2L10/FURIN/ARRB2/PMAIP1/APP/CCN1/ARL6IP5/GSN/SERPINH1/CRIM1/BCL2L11/CAST/NODAL/FABP1/GPER1/INTS1/SYK/VCP/RAG1/FADD/LGALS9/PRELID1/EFNA1/ANTXR1/MGMT/SERPINB9/TRIAP1/EIF2AK3/A2M/GRIN1/SVBP/PAK2/F2R/ANXA2/CARD9/HMGB1/SPOCK3/DAPK1/SRC/MAP3K5/SSPOP/MBP/CR1/TNF/PSENEN/TNF/FIS1/MAGEA3/TNF/TNF/TNF/TNF/TNF/TNF/NAIP/PDCD6/NAIP/CRIM1/NAIP/GPI | 121 |
| GO:0090287 | regulation of cellular response to growth factor stimulus | 93/3662 | 281/15509 | 0.000171675 | 0.00103506 | 0.000622467 | ITGA3/DCN/HSPA5/ARID4B/CYFIP2/ATP2B4/NGFR/HIPK2/FGFR1/ITGA8/LRP2/FKBP1A/GLG1/HSP90AB1/ABL1/FERMT1/SMAD7/RBBP7/AXIN1/SFRP1/PRKD2/TGFB1/SFRP4/ENG/GATA3/DKK1/FOLR1/ZNF451/SMOC2/IL12B/IL4/WNT5A/HES1/HDAC1/SFRP5/RUNX2/IL1B/BMP2/PIN1/KDR/TWSG1/CDKN1C/MEN1/NOTCH2/SPRY2/NKX2-1/NUMA1/SORL1/THBS1/SMAD6/TET1/FGF2/FBN2/TOB1/RNF165/SMAD4/CCN1/ARNT/SLIT2/OGT/NOTCH1/ZEB1/VEGFC/CRIM1/HHEX/CXCL13/SKI/RBBP4/WNT4/SAP30/ELAPOR2/HTRA1/RBPJ/ZEB2/FZD4/SMAD2/EID2/FAM20C/RGMA/NOG/ZNF703/PTP4A3/HGS/BCL9L/TMPRSS6/SPRY4/TRIM33/SLC2A10/SPRED2/PDCD6/ITGB3/CDKN1C/CRIM1 | 93 |
| GO:0070670 | response to interleukin-4 | 17/3662 | 31/15509 | 0.000172593 | 0.00103959 | 0.000625189 | HSPA5/IL4R/HSP90AB1/XBP1/JAK3/GATA3/ARG1/TUBA1B/IL2RG/ALAD/ADAMTS13/IL24/CCL11/STAT5B/PTPN2/SHPK/ADAMTS13 | 17 |
| GO:2001243 | negative regulation of intrinsic apoptotic signaling pathway | 36/3662 | 87/15509 | 0.000174948 | 0.00105275 | 0.000633102 | KDM1A/SNAI2/CD74/CD44/HERPUD1/TMEM161A/XBP1/MMP9/URI1/HSPB1/CREB3/CXCL12/PPIF/PARK7/HDAC1/HELLS/CLU/TRAP1/BCL2L2/EPO/BCL2L10/TMBIM6/NONO/ZNF385A/TRIAP1/BCL2L1/GRINA/PTTG1IP/PRKN/MUC1/NOC2L/PPIA/SRC/NDUFS3/MAGEA3/MIF | 36 |
| GO:0070266 | necroptotic process | 21/3662 | 42/15509 | 0.000176597 | 0.00106164 | 0.000638452 | BIRC3/FAS/DNM1L/PPIF/FASLG/RBCK1/MUTYH/PARP1/OGT/TLR3/FADD/FZD9/TNF/TNF/TNF/TNF/TNF/TNF/TNF/TNF/PGAM5 | 21 |
| GO:0034502 | protein localization to chromosome | 41/3662 | 103/15509 | 0.000178677 | 0.0010731 | 0.000645343 | IFFO1/CENPQ/PARP3/SPI1/SIRT6/XRCC5/NDC80/ATRX/ZW10/ESR1/MSH2/EZH2/MACROH2A1/SLF2/H2BC11/POT1/MAU2/DKC1/WBP2/PPHLN1/CCT7/KNL1/NABP2/BRCA2/RB1/BOD1/MRNIP/TERT/VCP/CCT2/CDK1/ZWILCH/AURKB/RCC2/SETD2/H4C15/H4C14/H4C12/H4C5/H4C4/TINF2 | 41 |
| GO:0007548 | sex differentiation | 85/3662 | 253/15509 | 0.00018267 | 0.00109602 | 0.000659128 | HOXA11/BAK1/HSPA5/ARID4B/MSH4/TP63/HOXA9/LRP2/PGR/ATRX/BAX/MMP2/ESR1/MSH2/GATA1/PCYT1B/SFRP1/CASP2/TGFBR1/GATA3/BMPR1A/CCND1/SMAD5/PDGFRB/WNT5A/IL1A/SDC1/FOXO3/EIF2B2/TNFSF10/INHBA/CNTFR/MEA1/EIF2S2/KDR/SOX15/BCL2L2/RARA/HSD17B4/PDGFRA/NKX2-1/CYP19A1/CYP1B1/BRCA2/GREB1L/ARRB2/SMAD4/SOD1/RAB13/REN/CNOT9/SLIT2/GAS2/ARID5B/DHX37/BCL2L11/BMP6/MERTK/ADAMTS1/MMP14/KIT/WNT4/H3-3A/INHBB/CASP3/TLR3/GDF9/SHH/NOS3/ZFPM2/BCL2L1/CEBPB/STAT5B/LEP/FZD4/A2M/PTPN11/SLIT3/PBX1/ZP3/AKR1C3/SRC/NTRK1/FANCG/HOXA10 | 85 |
| GO:0048736 | appendage development | 62/3662 | 173/15509 | 0.000184593 | 0.00110542 | 0.000664777 | HOXA11/BAK1/ALX4/FGFR2/PITX1/TP63/PLXNA2/TULP3/HOXA9/ATRX/BAX/BMP7/RPGRIP1L/LMBR1/BMPR1A/FBXW4/DKK1/WNT3/ZBTB16/KAT2B/WNT5A/PRRX1/HDAC1/IRF6/RECK/SOX4/RUNX2/HOXD9/ALDH1A2/RARA/CPLANE2/NOTCH2/LRP4/TFAP2A/FBN2/COL2A1/RNF165/SMAD4/CRABP2/AFF3/GNA12/NOTCH1/FREM2/MBNL1/BCL2L11/SKI/PITX2/SHH/RARG/NOG/PBX1/ZNF358/PBX2/PBX2/SP9/PBX2/PBX2/PBX2/PBX2/HOXA10/WNT3/WNT3 | 62 |
| GO:0060173 | limb development | 62/3662 | 173/15509 | 0.000184593 | 0.00110542 | 0.000664777 | HOXA11/BAK1/ALX4/FGFR2/PITX1/TP63/PLXNA2/TULP3/HOXA9/ATRX/BAX/BMP7/RPGRIP1L/LMBR1/BMPR1A/FBXW4/DKK1/WNT3/ZBTB16/KAT2B/WNT5A/PRRX1/HDAC1/IRF6/RECK/SOX4/RUNX2/HOXD9/ALDH1A2/RARA/CPLANE2/NOTCH2/LRP4/TFAP2A/FBN2/COL2A1/RNF165/SMAD4/CRABP2/AFF3/GNA12/NOTCH1/FREM2/MBNL1/BCL2L11/SKI/PITX2/SHH/RARG/NOG/PBX1/ZNF358/PBX2/PBX2/SP9/PBX2/PBX2/PBX2/PBX2/HOXA10/WNT3/WNT3 | 62 |
| GO:0072073 | kidney epithelium development | 48/3662 | 126/15509 | 0.000186264 | 0.00111435 | 0.000670148 | HOXA11/PROM1/FGFR2/ARG2/BMP7/SMAD7/EYA1/SFRP1/TMEM59L/GATA3/SMAD5/HES1/STAT1/SDC1/PKD2/CAT/BMP2/LIF/PODXL/FOXJ1/LAMA5/RARA/NOTCH2/AHI1/EDNRB/SMAD6/FGF2/GREB1L/SMAD4/SLIT2/ADAMTS16/KLHL3/NOTCH1/WNT4/HEYL/SHH/LAMB2/SMAD2/CTNNBIP1/CXCR2/ADIPOQ/NOG/PBX1/MAGI2/WNT7B/KANK2/PECAM1/CD24 | 48 |
| GO:0030433 | ubiquitin-dependent ERAD pathway | 34/3662 | 81/15509 | 0.00018867 | 0.00112657 | 0.000677498 | HSPA5/HERPUD1/SEL1L/DERL2/BAG6/PSMC6/USP14/SGTA/CCDC47/UBE4A/MAN1A1/TRIM25/FBXO44/ECPAS/DERL1/FAM8A1/RNF121/ERLIN2/DNAJB12/CLGN/TMUB1/VCP/CALR/YOD1/SVIP/UBE2J1/RNF5/BAG6/TRIM13/BAG6/BAG6/BAG6/BAG6/FBXO17 | 34 |
| GO:0030901 | midbrain development | 34/3662 | 81/15509 | 0.00018867 | 0.00112657 | 0.000677498 | HSPA5/FGFR2/RHOA/SIRT2/NDST1/CDC42/ACTB/KDM2B/SFRP1/DKK1/WNT3/WNT5A/HES1/GNB4/ATP5PB/PADI2/SYNGR3/YWHAH/FGF2/CSNK1D/SYPL2/CALM2/GLUD1/NR4A2/CALM3/SHH/NDRG2/CNP/CXCR2/MBP/NDUFS3/WNT3/WNT3/LRP6 | 34 |
| GO:0106056 | regulation of calcineurin-mediated signaling | 22/3662 | 45/15509 | 0.000189474 | 0.00113028 | 0.000679729 | PTBP1/IGF1/ATP2B4/ERBB3/GSK3B/NFAT5/PPP3CB/FHL2/DYRK2/SPPL3/CHP2/CIB1/MTOR/TNF/TNF/STIMATE/TNF/TNF/TNF/TNF/TNF/TNF | 22 |
| GO:0043242 | negative regulation of protein-containing complex disassembly | 33/3662 | 78/15509 | 0.000195012 | 0.00116108 | 0.000698255 | SCIN/CLEC16A/PHF23/NAV3/SPTB/ADD2/ADD1/TPX2/MTPN/CAPZA1/APC/RDX/GSN/PLEKHH2/SCAF4/DMTN/SPTBN4/SPTA1/SPTBN2/TMEM39A/FLII/CIB1/SPTAN1/IQANK1/TNF/TNF/TNF/TNF/TNF/TNF/TNF/TNF/TWF2 | 33 |
| GO:1902117 | positive regulation of organelle assembly | 33/3662 | 78/15509 | 0.000195012 | 0.00116108 | 0.000698255 | IFT88/RHOA/SPAG5/GSK3B/SH3GLB1/KCTD17/IL5/SNX4/SDC1/ELAPOR1/CNOT1/BECN1/LCP1/NUMA1/BBS4/MSN/ARHGAP35/CSF2/ATMIN/PDCD6IP/CEP135/MAPK15/SRC/TNF/TNF/TNF/TNF/TNF/TNF/TNF/TNF/PIP4K2B/SEPTIN9 | 33 |
| GO:0009110 | vitamin biosynthetic process | 15/3662 | 26/15509 | 0.000195972 | 0.00116456 | 0.000700344 | SNAI2/PNPO/CYP27B1/IFNG/UBIAD1/CYP3A4/GFI1/TNF/TNF/TNF/TNF/TNF/TNF/TNF/TNF | 15 |
| GO:0010893 | positive regulation of steroid biosynthetic process | 15/3662 | 26/15509 | 0.000195972 | 0.00116456 | 0.000700344 | IFNG/IL1A/NR1D1/PRKAA1/IGF1R/BMP6/WNT4/TNF/TNF/TNF/TNF/TNF/TNF/TNF/TNF | 15 |
| GO:0010958 | regulation of amino acid import across plasma membrane | 13/3662 | 21/15509 | 0.000199499 | 0.00117837 | 0.000708649 | ARG1/PER2/ARL6IP5/ITGB1/SLC43A2/TNF/TNF/TNF/TNF/TNF/TNF/TNF/TNF | 13 |
| GO:0051984 | positive regulation of chromosome segregation | 13/3662 | 21/15509 | 0.000199499 | 0.00117837 | 0.000708649 | SIRT2/BIRC5/CDC6/SMC4/KAT2B/BECN1/CCNB1/CDCA8/NUMA1/NCAPG2/KAT5/AURKB/RCC2 | 13 |
| GO:1903789 | regulation of amino acid transmembrane transport | 13/3662 | 21/15509 | 0.000199499 | 0.00117837 | 0.000708649 | ARG1/PER2/ARL6IP5/ITGB1/SLC43A2/TNF/TNF/TNF/TNF/TNF/TNF/TNF/TNF | 13 |
| GO:0007080 | mitotic metaphase plate congression | 23/3662 | 48/15509 | 0.000199627 | 0.00117837 | 0.000708649 | NDC80/PIBF1/SEH1L/CHMP5/ZW10/BIRC5/NUDC/CHMP4B/RAB11A/KAT2B/BECN1/CHMP1A/CCNB1/PSRC1/CDCA8/CENPE/KIF2C/CENPC/BOD1/KAT5/CHMP6/AURKB/KIFC1 | 23 |
| GO:0032689 | negative regulation of interferon-gamma production | 23/3662 | 48/15509 | 0.000199627 | 0.00117837 | 0.000708649 | FOXP3/LILRB1/GATA3/C1QBP/INHBA/RARA/IL10/TLR4/CD96/NOD2/LGALS9/DDIT3/LILRB4/HMGB1/PDCD1LG2/CR1/LILRB1/LILRB4/LILRB1/LILRB1/LILRB1/LILRB4/LILRB4 | 23 |
| GO:0033173 | calcineurin-NFAT signaling cascade | 23/3662 | 48/15509 | 0.000199627 | 0.00117837 | 0.000708649 | PTBP1/IGF1/ATP2B4/ERBB3/GSK3B/NFATC2/NFAT5/PPP3CB/FHL2/DYRK2/SPPL3/CHP2/CIB1/MTOR/TNF/TNF/STIMATE/TNF/TNF/TNF/TNF/TNF/TNF | 23 |
| GO:0035307 | positive regulation of protein dephosphorylation | 23/3662 | 48/15509 | 0.000199627 | 0.00117837 | 0.000708649 | PTBP1/PTPRC/PPP1R15A/HSP90AB1/PPP1R16B/TGFB1/CD33/PPP2R5D/PDGFRB/PTPA/PIN1/CALM2/GNA12/SPPL3/PPP1R15B/CALM3/PRKCD/NSMF/ANKLE2/MAGI2/PPIA/MTOR/PTPRC | 23 |
| GO:0032092 | positive regulation of protein binding | 32/3662 | 75/15509 | 0.00020084 | 0.00118328 | 0.000711602 | HFE/HIPK2/ADD2/GSK3B/ADD1/FKBP1A/HSP90AB1/ABL1/MMP9/CSF3/PPP2CA/NPHP3/WNT5A/LRP1/USP9X/BMP2/PIN1/APOE/MEN1/DERL1/APP/TCF7L2/SPPL3/EPB41/SPTA1/TERT/CDK5/NMD3/BDNF/ANXA2/PRKN/B2M | 32 |
| GO:2001057 | reactive nitrogen species metabolic process | 32/3662 | 75/15509 | 0.00020084 | 0.00118328 | 0.000711602 | CPS1/ATP2B4/ARG2/HSP90AB1/CYB5R3/ACP5/IFNG/MTARC2/PKD2/CLU/PTK2B/IL1B/ASS1/CD36/IL10/TLR4/CYP1B1/DDAH1/NOS3/CX3CR1/NQO1/TRPV1/CD47/TNF/TNF/TNF/TNF/TNF/TNF/TNF/TNF/HBB | 32 |
| GO:0098813 | nuclear chromosome segregation | 91/3662 | 275/15509 | 0.00020165 | 0.00118692 | 0.000713794 | CDC27/BAZ1B/CENPQ/ARID1B/MSH4/SIRT2/CDC42/SMC1A/ACTB/MLH1/SPAG5/NDC80/PIBF1/ATRX/SEH1L/CHMP5/ZW10/ANAPC5/BIRC5/NUDC/KIF4A/CDC6/BAG6/BCL7C/SMARCB1/CCNB1IP1/CHMP4B/RAB11A/CCNE1/SMC3/SMARCD2/BCL7A/FBXO5/MACROH2A1/SMC4/KAT2B/TTL/CDC20/NSL1/ARID1A/SLF2/TEX14/NAA50/PDS5A/CENPK/BECN1/MAU2/CHMP1A/TOP2A/CCNB1/PSRC1/CDCA8/APC/NUMA1/NUSAP1/KIF23/KNL1/ACTR2/CENPE/RB1/KIF2C/CENPC/BOD1/NCAPG2/SPC25/SMARCA5/EME1/GEM/BRD7/BUB1/CENPX/KAT5/ZWILCH/CCNE2/RMI2/CHMP6/RMI1/AURKB/RCC2/MAPK15/KMT5A/ARID2/BAG6/SYCE1L/BAG6/BAG6/BAG6/BAG6/KIFC1/SMARCB1/SPICE1 | 91 |
| GO:0060348 | bone development | 74/3662 | 215/15509 | 0.000202821 | 0.00119268 | 0.000717258 | HOXA11/PAFAH1B1/TYROBP/MBTPS2/LTF/IGF1/FGFR2/RHOA/FGFR3/ATP6AP1/TULP3/PTPRC/ZMPSTE24/GLG1/PLS3/ACP5/XYLT1/LILRB1/SFRP4/ENG/MAP2K6/NSD2/ZBTB16/SH2B3/MAPK14/PEX7/SMAD5/LEPR/P3H1/RUNX2/BMP2/SBDS/KDR/LRRC17/RARA/NOTCH2/ADAMTS7/TFAP2A/COL2A1/DYM/MEIS1/PDGFC/SERPINH1/GJA1/BMP6/MMP14/KIT/SLC38A10/SKI/STC1/ZNF385A/TGFBR2/SLC9B2/PITX2/RANBP3L/RPL13/RARG/LEP/FAM20C/PTPN11/ANXA2/RFLNB/NOTUM/COL27A1/SRC/COL13A1/TGM2/GH1/PTPRC/LOC102724560/LILRB1/LILRB1/LILRB1/LILRB1 | 74 |
| GO:0009750 | response to fructose | 10/3662 | 14/15509 | 0.000204429 | 0.00119872 | 0.000720891 | XBP1/KHK/TNF/TNF/TNF/TNF/TNF/TNF/TNF/TNF | 10 |
| GO:0031622 | positive regulation of fever generation | 10/3662 | 14/15509 | 0.000204429 | 0.00119872 | 0.000720891 | IL1B/TNFRSF11A/TNF/TNF/TNF/TNF/TNF/TNF/TNF/TNF | 10 |
| GO:1905331 | negative regulation of morphogenesis of an epithelium | 10/3662 | 14/15509 | 0.000204429 | 0.00119872 | 0.000720891 | BMP7/WNT5A/TNF/TNF/TNF/TNF/TNF/TNF/TNF/TNF | 10 |
| GO:0055065 | metal ion homeostasis | 146/3662 | 476/15509 | 0.000204815 | 0.00119985 | 0.00072157 | HFE/LTF/SLC11A1/BAK1/CASR/HEXB/HERPUD1/CYBA/KCNQ1/KCNH2/ATP2B4/AP3D1/HYAL2/ATP6AP1/PRKACA/PICALM/SLC46A1/PTPRC/FTL/BAX/FKBP1A/P2RX7/SLC7A8/SLC22A17/ABL1/KCTD17/CD40/NUBP1/SLC39A14/HAMP/TFR2/ZNHIT1/CXCL12/CDH23/CCDC47/HPX/CALCA/SLC11A2/CYP27B1/VDR/IFNG/RHAG/PDE4D/WNT5A/ATP6V1A/IL1A/SLC30A3/EPAS1/FASLG/FBXL5/PKD2/CNNM1/PTK2B/TRIM24/KCNJ2/TMTC4/SLC25A23/CCR7/TRPV5/KDR/TNNI3/APOE/NDFIP1/C19orf12/IMMT/AP3B1/NT5E/ISCU/EDNRB/IREB2/ATP6V1G1/CCL21/FGF2/TMBIM6/SMAD4/SOD1/APP/SYPL2/TMCO1/CALM2/CORIN/ANK2/KLHL3/SLC12A9/SLC25A37/LCN2/GSTO1/ITPR1/BMP6/SLC24A2/STEAP2/ALAS2/STC1/CALM3/CCR5/CYB561A3/SELENON/SCNN1D/SLC30A7/DISC1/ATP1A1/MELTF/GPER1/FXN/TRPV6/EPB42/STIM1/FTH1/LETM1/PRKCE/CCL11/CCL19/ATP2A2/DDIT3/GRIN1/CD19/KCNJ10/GRINA/ERFE/CALR/F2/F2R/SLC8A1/SMDT1/BTBD9/PRKN/TMPRSS6/TMEM203/CLN3/FZD9/TRPV1/ELANE/TGM2/FIS1/KCTD7/TMEM199/ITGB3/PTPRC/CCL5/B2M/CCL5/TRPV5/TRPV6/ELANE/RASA3/PRKACA | 146 |
| GO:0002200 | somatic diversification of immune receptors | 31/3662 | 72/15509 | 0.000206004 | 0.00120568 | 0.000725074 | PARP3/FOXP3/TCF3/TBX21/MLH1/PTPRC/MSH2/CD40/CD40LG/NBN/IL27RA/TGFB1/EXOSC3/NSD2/AICDA/IL4/BCL6/SHLD2/BCL11B/NDFIP1/IL10/SLC15A4/DCAF1/TNFSF13/RAG1/LIG4/RAG2/CD28/HMGB1/PRKDC/PTPRC | 31 |
| GO:1905952 | regulation of lipid localization | 58/3662 | 160/15509 | 0.000207134 | 0.0012103 | 0.000727855 | PON1/CRY1/APOB/P2RX7/NFKBIA/MAP2K6/PPARD/TMEM30A/IL1A/KDM5B/FASLG/SPP1/CRHR1/CRY2/LRP1/IL1B/C3/APOE/CD36/IL6/THBS1/CYP19A1/ITGAV/EGF/FURIN/TNFRSF11A/REN/OSBPL11/BMP6/LDLRAP1/PRKCD/GDF9/SHH/SYK/ABCA3/PRELID1/TRIAP1/ARV1/LEP/PTPN2/LPL/ERFE/PTPN11/ADIPOQ/ANXA2/PRKN/TNF/TNF/FIS1/TNF/TNF/TNF/TNF/TNF/TNF/YJEFN3/ITGB3/MIF | 58 |
| GO:0006611 | protein export from nucleus | 24/3662 | 51/15509 | 0.000207185 | 0.0012103 | 0.000727855 | RANBP3/SP100/PRKACA/SIRT6/GSK3B/XPO1/RANGAP1/TGFB1/HSPA9/PARK7/EGR2/CSE1L/IL1B/NXT1/XPO4/ANP32B/TCF7L2/BAG3/RANBP3L/CDK5/AHCYL1/CALR/PTPN11/PRKACA | 24 |
| GO:0060840 | artery development | 38/3662 | 94/15509 | 0.000208784 | 0.00121849 | 0.000732781 | PRDM1/NGFR/MYLK/NDST1/NOTCH3/LRP2/APOB/HECTD1/SMAD7/NPRL3/EYA1/TGFBR1/ENG/BMPR1A/ZMIZ1/FOLR1/MDK/PDGFRB/HES1/SNX17/PRRX1/PKD2/EGR2/LRP1/SOX4/APOE/SMAD6/FKBP10/NOTCH1/SHH/DCTN5/RBPJ/LEP/DDIT3/NOG/ARID2/SLC2A10/AKT3 | 38 |
| GO:0043388 | positive regulation of DNA binding | 25/3662 | 54/15509 | 0.000212341 | 0.00123809 | 0.000744565 | IGF1/HIPK2/SIRT2/MMP9/ERCC2/TGFB1/EDF1/GATA3/IFNG/HES1/PARK7/NGF/IRF4/EGF/RB1/PARP1/CALM2/POU4F2/POU4F1/SKI/CALM3/PRKN/H1-0/HMGB1/NME1 | 25 |
| GO:0043627 | response to estrogen | 29/3662 | 66/15509 | 0.000213648 | 0.00124454 | 0.000748446 | HOXA11/F7/IL4R/OPRK1/MMP2/ESR1/SFRP1/GATA3/CCND1/CYP27B1/PDGFRB/IGFBP2/TRIM25/TRIM24/ASH2L/EPO/ARPC1B/RARA/WBP2/SMAD6/HAPLN3/PELP1/MMP14/TGFBR2/TNFRSF11B/SERPINB9/MME/HOXA10/CD24 | 29 |
| GO:0016447 | somatic recombination of immunoglobulin gene segments | 26/3662 | 57/15509 | 0.000215322 | 0.00125311 | 0.000753601 | PARP3/FOXP3/TCF3/TBX21/MLH1/PTPRC/MSH2/CD40/CD40LG/NBN/IL27RA/TGFB1/EXOSC3/NSD2/AICDA/IL4/BCL6/SHLD2/NDFIP1/IL10/SLC15A4/TNFSF13/LIG4/CD28/PRKDC/PTPRC | 26 |
| GO:0019731 | antibacterial humoral response | 28/3662 | 63/15509 | 0.000215735 | 0.00125434 | 0.000754337 | LTF/CTSG/SEMG1/H2BC11/SFTPD/NOD2/FGA/H2BC21/ELANE/RPL39/HLA-E/HLA-E/HLA-A/HLA-A/HLA-A/HLA-A/HLA-E/HLA-A/HLA-A/HLA-E/HLA-E/HLA-A/HLA-E/HLA-A/HLA-E/H2BC6/H2BC7/ELANE | 28 |
| GO:0035196 | miRNA processing | 27/3662 | 60/15509 | 0.000216372 | 0.00125487 | 0.000754658 | PUM2/TUT7/ZMPSTE24/ESR1/AGO1/ZC3H7B/TGFB1/DDX5/ZC3H7A/MYCN/IL6/NCBP1/TARBP2/EGFR/PUS10/TERT/TRUB1/SMAD2/SPOUT1/TNF/TNF/TNF/TNF/TNF/TNF/TNF/TNF | 27 |
| GO:0048565 | digestive tract development | 49/3662 | 130/15509 | 0.000216431 | 0.00125487 | 0.000754658 | CPS1/ALX4/KCNQ1/PRDM1/FGFR2/TP63/GLI2/CHD8/SFRP1/HOXA5/CCKBR/NPHP3/WNT5A/HES1/ID2/SFRP5/NKX2-2/ALDH1A2/ASS1/PDGFRA/AHI1/EDNRB/HLX/RB1/CYP1A1/PDGFC/EGFR/NOTCH1/NODAL/KIT/TGFBR2/SHH/SLC4A2/CXCL8/SMAD2/FOXL1/TYMS/OXTR/YIPF6/EPHB3/SRC/TNF/TNF/TNF/TNF/TNF/TNF/TNF/TNF | 49 |
| GO:0016331 | morphogenesis of embryonic epithelium | 52/3662 | 140/15509 | 0.000216434 | 0.00125487 | 0.000754658 | WNT16/FGFR2/PRKACA/TP63/TULP3/LRP2/TMED2/KDM2B/HECTD1/ABL1/CECR2/MTHFD1/BMP7/TSC2/SFRP1/TGFB1/DVL1/GATA3/FOLR1/NPHP3/WNT5A/MTHFD1L/SOX4/ALDH1A2/LAMA5/RARA/GRSF1/TFAP2A/BBS4/VEGFC/NODAL/SKI/ARHGAP35/DVL3/WNT4/VANGL2/CASP3/SHH/SEMA4C/RARG/GLMN/SETD2/RGMA/NOG/WNT7B/BRD2/TCTN1/BRD2/BRD2/BRD2/BRD2/PRKACA | 52 |
| GO:0006006 | glucose metabolic process | 62/3662 | 174/15509 | 0.000221611 | 0.00128369 | 0.000771987 | BAD/CRY1/IGF1/H6PD/KCNQ1/PKM/PDK3/SIRT6/DUSP12/ZMPSTE24/SLC25A1/PCK2/SLC39A14/GPI/GSK3A/BRAT1/ENO3/ALDOC/PPARD/MAPK14/KAT2B/LEPR/SERP1/DYRK2/SESN2/G6PC1/PER2/PRKAA1/PMAIP1/GALM/IGFBP3/OGT/SOGA1/DLAT/FOXO1/RANBP2/ADIPOR1/OMA1/ATF3/NNMT/GPD1/MST1/LEP/PTPN2/ERFE/ADIPOQ/SLC25A10/GDPGP1/PRKN/KCNJ11/USP7/WDR5/SRC/TNF/TNF/TNF/TNF/TNF/TNF/TNF/TNF/GPI | 62 |
| GO:0010923 | negative regulation of phosphatase activity | 19/3662 | 37/15509 | 0.000228723 | 0.00132118 | 0.000794535 | ROCK1/GSK3B/PPP1R15A/FKBP1A/URI1/PTPA/MASTL/CRY2/STYXL1/BOD1/TNF/PPP1R11/TNF/TNF/TNF/TNF/TNF/TNF/TNF | 19 |
| GO:0021762 | substantia nigra development | 19/3662 | 37/15509 | 0.000228723 | 0.00132118 | 0.000794535 | HSPA5/RHOA/SIRT2/CDC42/ACTB/GNB4/ATP5PB/PADI2/SYNGR3/YWHAH/FGF2/SYPL2/CALM2/GLUD1/CALM3/NDRG2/CNP/MBP/NDUFS3 | 19 |
| GO:0140467 | integrated stress response signaling | 19/3662 | 37/15509 | 0.000228723 | 0.00132118 | 0.000794535 | HSPA5/TMED2/PPP1R15A/CEBPE/CREB3/TMEM33/PPP1R15B/OMA1/FOS/EIF2AK3/CEBPB/DDIT3/PTPN2/FOSL1/JUN/MAF/MAFB/CEBPD/CEBPA | 19 |
| GO:1901654 | response to ketone | 66/3662 | 188/15509 | 0.000231287 | 0.00133475 | 0.000802694 | BAD/CD38/HOXA11/CPS1/FOXP3/CYBA/F7/GNB1/HOXA9/PCK2/SFRP1/PLAT/GPI/TGFB1/AHR/RPS6KB1/RECQL5/CCND1/XRN1/PARK7/ARG1/FOXO3/SPP1/KLF9/FOSB/NKX2-2/CCR7/ELK1/EPO/ASS1/PRKAA1/WBP2/CCL21/FDX1/THBS1/CYP1B1/IGF1R/PARP1/SLIT2/MSN/CALM3/SCNN1D/ADCY1/CYBB/DDIT4/PTAFR/FOS/PRKCE/BCL2L1/CCL19/FOSL1/A2M/TYMS/CALR/OXTR/NQO1/PAPPA/SLIT3/AKR1C3/SRC/MBP/F5/HOXA10/TXNIP/NEFL/GPI | 66 |
| GO:0040029 | epigenetic regulation of gene expression | 51/3662 | 137/15509 | 0.000232366 | 0.00133972 | 0.000805686 | KDM1A/ARID1B/KCNQ1/ARID4B/SPI1/SIRT2/MBD3/SIRT6/AXIN1/DOT1L/GSK3A/EZH2/EZH1/AICDA/FAM172A/MACROH2A1/KAT2B/HDAC1/PADI2/ARID1A/DNMT3A/HELLS/DNMT1/WBP2/PRMT7/PPHLN1/TET1/TDG/RB1/OGT/HMGA2/SMARCA5/CTBP1/LMNA/RBM15/H3-3A/PPM1D/EXOSC10/MSL2/GLMN/SUZ12/PCGF5/H1-0/HMGB1/WDR5/PHF2/L3MBTL3/RBM15B/H3C6/H3C10/H3C2 | 51 |
| GO:0001841 | neural tube formation | 40/3662 | 101/15509 | 0.000241771 | 0.00139136 | 0.000836741 | PRKACA/TULP3/LRP2/TMED2/KDM2B/HECTD1/ABL1/CECR2/MTHFD1/BMP7/TSC2/SFRP1/TGFB1/DVL1/FOLR1/NPHP3/WNT5A/MTHFD1L/SOX4/RARA/BBS4/NODAL/SKI/ARHGAP35/DVL3/VANGL2/CASP3/SEMA4C/RARG/GLMN/SETD2/RGMA/NOG/BRD2/TCTN1/BRD2/BRD2/BRD2/BRD2/PRKACA | 40 |
| GO:1901989 | positive regulation of cell cycle phase transition | 40/3662 | 101/15509 | 0.000241771 | 0.00139136 | 0.000836741 | CDC27/KMT2E/PAF1/ANAPC5/CDC6/CDC7/APEX1/CDC25B/RAB11A/EZH2/CCND1/FBXO5/CCND3/HSPA2/CCNB1/RDX/RB1/CUL4A/CYP1A1/APP/DTL/DYRK3/EGFR/ADAMTS1/LSM11/CUL4B/DBF4B/TERT/RRM1/CDK1/RRM2/RCC2/MAPK15/NPM1/PLCB1/CHEK2/CDK10/PBX1/TFDP1/PAGR1 | 40 |
| GO:0035066 | positive regulation of histone acetylation | 16/3662 | 29/15509 | 0.000243972 | 0.00139487 | 0.000838851 | BAZ1B/SNAI2/FOXP3/SMARCB1/GATA3/SF3B1/DEK/LIF/MYBBP1A/WBP2/SMAD4/SMARCA5/BRD7/MUC1/SMARCB1/TADA2A | 16 |
| GO:0061437 | renal system vasculature development | 16/3662 | 29/15509 | 0.000243972 | 0.00139487 | 0.000838851 | NOTCH3/ANGPT2/PDGFB/BMP7/ACTA2/PDGFRB/HES1/PKD2/TEK/EGR1/NOTCH2/PDGFRA/NOTCH1/IL6R/ITGB3/PECAM1 | 16 |
| GO:0061440 | kidney vasculature development | 16/3662 | 29/15509 | 0.000243972 | 0.00139487 | 0.000838851 | NOTCH3/ANGPT2/PDGFB/BMP7/ACTA2/PDGFRB/HES1/PKD2/TEK/EGR1/NOTCH2/PDGFRA/NOTCH1/IL6R/ITGB3/PECAM1 | 16 |
| GO:1902751 | positive regulation of cell cycle G2/M phase transition | 16/3662 | 29/15509 | 0.000243972 | 0.00139487 | 0.000838851 | CDC7/CDC25B/RAB11A/CCND1/FBXO5/HSPA2/CCNB1/APP/DTL/DYRK3/DBF4B/RRM1/CDK1/RCC2/NPM1/PBX1 | 16 |
| GO:0002774 | Fc receptor mediated inhibitory signaling pathway | 9/3662 | 12/15509 | 0.000244181 | 0.00139487 | 0.000838851 | LILRB1/LILRB4/LILRB1/LILRB4/LILRB1/LILRB1/LILRB1/LILRB4/LILRB4 | 9 |
| GO:0035509 | negative regulation of myosin-light-chain-phosphatase activity | 9/3662 | 12/15509 | 0.000244181 | 0.00139487 | 0.000838851 | ROCK1/TNF/TNF/TNF/TNF/TNF/TNF/TNF/TNF | 9 |
| GO:0071872 | cellular response to epinephrine stimulus | 9/3662 | 12/15509 | 0.000244181 | 0.00139487 | 0.000838851 | KCNQ1/ATP2B4/SIRT2/PRKACA/PKLR/ADIPOQ/PDE4B/PKLR/PRKACA | 9 |
| GO:0120188 | regulation of bile acid secretion | 9/3662 | 12/15509 | 0.000244181 | 0.00139487 | 0.000838851 | PRKAA1/TNF/TNF/TNF/TNF/TNF/TNF/TNF/TNF | 9 |
| GO:0030832 | regulation of actin filament length | 53/3662 | 144/15509 | 0.000246626 | 0.00140754 | 0.000846469 | SCIN/CYFIP2/RHOA/SPTB/WDR1/ADD2/ACTN2/ADD1/HCK/COTL1/PYCARD/MTPN/CXCL12/CSF3/ARPC3/DBN1/CAPZA1/PTK2B/DSTN/CCR7/CDC42EP1/ARPC1B/DBNL/CCL21/RDX/BBS4/SLIT2/ARHGAP18/GSN/CDC42EP2/PLEKHH2/DMTN/ARHGAP35/SPTBN4/ALOX15/ARPC5/CDC42EP3/SPTA1/PRKCD/RICTOR/PRKCE/CCL11/SPTBN2/FLII/GRB2/SPTAN1/MTOR/IQANK1/TMSB4X/PDXP/ARPC1A/TWF2/BRK1 | 53 |
| GO:0014074 | response to purine-containing compound | 50/3662 | 134/15509 | 0.000249376 | 0.00142193 | 0.000855122 | KDM1A/CPS1/HSPA5/KCNQ1/P2RX5/P2RX7/APEX1/GATA1/PLAT/PIK3CG/AHR/RAPGEF1/AREG/XRN1/STAT1/SDC1/PKD2/PTK2B/IL1B/FOSB/CDO1/ASS1/PRKAA1/NT5E/FDX1/CYP1B1/SOD1/APP/CARM1/PKLR/REN/DMTN/STC1/SELENON/INHBB/GPD1/PTAFR/FOS/BSG/PDE3A/FOSL1/ADIPOQ/SLC8A1/ZFP36L1/KCNJ11/P2RX2/TRPV1/PDXP/P2RY11/PKLR | 50 |
| GO:0060412 | ventricular septum morphogenesis | 20/3662 | 40/15509 | 0.00025089 | 0.00142925 | 0.000859523 | FGFR2/SMAD7/TGFBR1/BMPR1A/NSD2/WNT5A/HES1/SOX4/SMAD4/SLIT2/NOTCH1/RBM15/TGFBR2/HEYL/NOS3/RBPJ/ZFPM2/NKX2-5/NOG/SLIT3 | 20 |
| GO:0032259 | methylation | 108/3662 | 338/15509 | 0.000253834 | 0.00144469 | 0.000868809 | NFYA/KDM1A/KMT2E/PAF1/AASS/ARID4B/PRDM1/KDM4A/NFYC/SPI1/BUD23/MBD3/ZMPSTE24/ATRX/MECOM/DNMT3B/COMT/SMARCB1/SNRPD3/PCIF1/SETD6/DOT1L/FBL/GSK3A/EZH2/GATA3/TRDMT1/EZH1/NSD2/NOP2/HCFC2/MACROH2A1/KDM3A/ASH1L/MTR/NSUN4/DPH5/MYB/PHF19/DNMT3A/HELLS/EEF1AKMT3/H1-3/PRMT1/ASH2L/PRDM12/DNMT1/PRMT7/MEN1/CMTR1/TPMT/ALKBH8/THUMPD2/TET1/SNRPF/SKIC8/CYP1A1/CYP1A2/SMAD4/CARM1/METTL25B/PARP1/SNRPG/BOD1/WTAP/OGT/NSD3/SMARCA5/RNF20/BTG2/PRMT2/LMNA/GFI1/RBM15/PYGO2/NSD1/NNMT/SNRPD1/GATAD2A/SETD5/H1-4/FOS/MGMT/PPM1D/COPRS/HCFC1/TRMT112/TDRD12/LARP7/TYMS/WDR6/SUZ12/SETD2/SETD3/KMT5A/TET3/H1-2/TRMT2B/PAX5/WDR5/WDR5B/NCOA6/SPOUT1/PCMTD2/RBM15B/SMARCB1/PAGR1/EMG1 | 108 |
| GO:0048738 | cardiac muscle tissue development | 71/3662 | 206/15509 | 0.000257612 | 0.00146484 | 0.000880931 | IGF1/PKP2/ERBB3/MAP2K4/FGFR2/CDC42/SIRT6/ACTN2/TP73/LRP2/ZMPSTE24/NOX4/FKBP1A/DSP/ABL1/BMP7/SMAD7/NDRG4/NPRL3/TGFB1/HAMP/GSK3A/TGFBR1/ENG/BMPR1A/DKK1/MAPK14/BVES/SMAD5/PDGFRB/WNT5A/FHL2/ID2/TNNT2/OBSL1/BMP2/PRMT1/ALDH1A2/TNNI3/RARA/MYH11/NOTCH2/PDGFRA/FGF2/ARRB2/SMAD4/NOTCH1/ITGB1/POU4F1/GJA1/SKI/TNNI1/RUNX1/LMNA/MAML1/PDLIM5/TGFBR2/FRS2/RBPJ/ZFPM2/CDK1/S1PR1/PLEC/CALR/SLC8A1/NKX2-5/NOG/ARID2/MTOR/MYH11/PTEN | 71 |
| GO:0014002 | astrocyte development | 21/3662 | 43/15509 | 0.000268863 | 0.00152595 | 0.000917678 | GRN/IFNG/LRP1/IL1B/NR1D1/KRAS/TSPAN2/IL6/TLR4/APP/LAMB2/POU3F2/ROR1/TNF/TNF/TNF/TNF/TNF/TNF/TNF/TNF | 21 |
| GO:0014020 | primary neural tube formation | 38/3662 | 95/15509 | 0.000269659 | 0.00152595 | 0.000917678 | PRKACA/TULP3/LRP2/TMED2/KDM2B/HECTD1/ABL1/CECR2/MTHFD1/BMP7/TSC2/SFRP1/TGFB1/DVL1/FOLR1/NPHP3/WNT5A/MTHFD1L/RARA/BBS4/NODAL/SKI/ARHGAP35/DVL3/VANGL2/CASP3/SEMA4C/RARG/GLMN/SETD2/RGMA/NOG/BRD2/BRD2/BRD2/BRD2/BRD2/PRKACA | 38 |
| GO:0001788 | antibody-dependent cellular cytotoxicity | 8/3662 | 10/15509 | 0.000270328 | 0.00152595 | 0.000917678 | FCGR2B/HLA-E/HLA-E/HLA-E/HLA-E/HLA-E/HLA-E/HLA-E | 8 |
| GO:0010693 | negative regulation of alkaline phosphatase activity | 8/3662 | 10/15509 | 0.000270328 | 0.00152595 | 0.000917678 | TNF/TNF/TNF/TNF/TNF/TNF/TNF/TNF | 8 |
| GO:0043376 | regulation of CD8-positive, alpha-beta T cell differentiation | 8/3662 | 10/15509 | 0.000270328 | 0.00152595 | 0.000917678 | RUNX3/CBFB/RUNX1/SOCS1/LILRB4/LILRB4/LILRB4/LILRB4 | 8 |
| GO:0046968 | peptide antigen transport | 8/3662 | 10/15509 | 0.000270328 | 0.00152595 | 0.000917678 | TAP2/TAP2/TAP2/TAP2/TAP2/TAP2/TAP2/TAP2 | 8 |
| GO:1905242 | response to 3,3',5-triiodo-L-thyronine | 8/3662 | 10/15509 | 0.000270328 | 0.00152595 | 0.000917678 | TNF/TNF/TNF/TNF/TNF/TNF/TNF/TNF | 8 |
| GO:2001272 | positive regulation of cysteine-type endopeptidase activity involved in execution phase of apoptosis | 8/3662 | 10/15509 | 0.000270328 | 0.00152595 | 0.000917678 | TNF/TNF/TNF/TNF/TNF/TNF/TNF/TNF | 8 |
| GO:0032634 | interleukin-5 production | 12/3662 | 19/15509 | 0.000270999 | 0.00152696 | 0.000918285 | FOXP3/IL5RA/GATA3/PDE4D/RARA/TNFRSF21/LILRB4/IL1RAP/CRLF2/LILRB4/LILRB4/LILRB4 | 12 |
| GO:0032674 | regulation of interleukin-5 production | 12/3662 | 19/15509 | 0.000270999 | 0.00152696 | 0.000918285 | FOXP3/IL5RA/GATA3/PDE4D/RARA/TNFRSF21/LILRB4/IL1RAP/CRLF2/LILRB4/LILRB4/LILRB4 | 12 |
| GO:0071375 | cellular response to peptide hormone stimulus | 89/3662 | 270/15509 | 0.000272701 | 0.00153515 | 0.000923213 | CPS1/CYBA/PKM/ROCK1/ACTN2/GSK3B/RAB10/PXN/CDC6/XBP1/RANGAP1/APEX1/PCK2/TSC2/CSK/PLAT/SLC39A14/JAK3/GSK3A/RPS6KB1/CCND3/KAT2B/NCL/STAT1/ARG1/NR4A3/CRHR1/INHBA/NR4A1/NCOA5/IL1B/MAX/STAT5A/GDF15/ASS1/PRKAA1/LPIN3/MEN1/APC/SORL1/CYP1B1/RB1/IGF1R/RAB13/PKLR/PARP1/CCNA2/PIK3R1/OGT/EIF4EBP2/SESN3/SOGA1/FOXO1/POU4F2/NR4A2/APPL1/ADIPOR1/SHC1/JAK1/SCNN1D/INHBB/PRKCD/GPER1/ZNF592/SLC27A4/AHCYL1/PTK2/FOS/SLC25A33/RELA/ESRRA/STAT5B/LEP/PTPN2/LPL/GRB2/ERFE/PTPN11/ADIPOQ/PLCB1/FOXO4/SOCS1/ZFP36L1/SRC/PRKDC/ITGB3/GH1/PKLR/PIP4K2B | 89 |
| GO:0032469 | endoplasmic reticulum calcium ion homeostasis | 14/3662 | 24/15509 | 0.000274009 | 0.00154112 | 0.0009268 | BAK1/HERPUD1/BAX/KCTD17/CCDC47/TMTC4/TMBIM6/APP/TMCO1/ITPR1/ATP2A2/GRINA/TGM2/FIS1 | 14 |
| GO:0048332 | mesoderm morphogenesis | 31/3662 | 73/15509 | 0.000277894 | 0.00156155 | 0.000939087 | HOXA11/ITGA3/FGFR2/PRKACA/ITGA8/BMP7/AXIN1/EYA1/GPI/BMPR1A/DKK1/WNT3/WNT5A/INHBA/TWSG1/ARMC5/EPHA2/HMGA2/ITGB1/GJA1/NODAL/SMAD2/SETD2/NOG/NF2/TXNRD1/ITGB3/WNT3/WNT3/GPI/PRKACA | 31 |
| GO:0044000 | movement in host | 59/3662 | 165/15509 | 0.00027914 | 0.00156713 | 0.000942444 | CD4/CD74/HYAL2/MID2/CHMP5/ICAM1/CHMP4B/VAPA/KPNA3/SLC1A5/TRIM14/EFNB3/CD81/CD86/VAMP8/TRIM25/CD80/CXCR4/NUP153/NECTIN2/CHMP1A/TRIM5/TRIM22/ARL8B/ITGAV/SLC7A1/FURIN/EPHA2/EGFR/GSN/NCAM1/ITGB1/CCR5/ANPEP/TRIM68/SLC3A2/LGALS9/CXCL8/GYPA/CDK1/TRIM8/BSG/DAG1/CHMP6/CIITA/EXOC7/SLC52A2/IFITM1/PLSCR1/HMGB1/PPIA/CD55/SRC/DPP4/WWP2/CR1/TRIM26/ITGB3/ITCH | 59 |
| GO:0060147 | regulation of post-transcriptional gene silencing | 23/3662 | 49/15509 | 0.000292788 | 0.00164226 | 0.000987626 | PUM2/ELAVL1/ZMPSTE24/ESR1/TGFB1/DDX5/ZFP36/AJUBA/MYCN/IL6/EGFR/TERT/TRUB1/FOCAD/TNF/TNF/TNF/TNF/TNF/TNF/TNF/TNF/NEAT1 | 23 |
| GO:1905330 | regulation of morphogenesis of an epithelium | 28/3662 | 64/15509 | 0.000297929 | 0.00166959 | 0.00100406 | SNAI2/HGF/SIRT6/ESR1/ABL1/BMP7/SFRP1/GATA3/MDK/WNT5B/WNT5A/LIF/FGF2/EGF/ITGAX/GJA1/WNT4/SHH/NOG/FKBPL/TNF/TNF/TNF/TNF/TNF/TNF/TNF/TNF | 28 |
| GO:0001843 | neural tube closure | 36/3662 | 89/15509 | 0.000298782 | 0.00167135 | 0.00100512 | PRKACA/TULP3/LRP2/TMED2/KDM2B/HECTD1/ABL1/CECR2/MTHFD1/TSC2/SFRP1/TGFB1/DVL1/FOLR1/NPHP3/WNT5A/MTHFD1L/RARA/BBS4/SKI/ARHGAP35/DVL3/VANGL2/CASP3/SEMA4C/RARG/GLMN/SETD2/RGMA/NOG/BRD2/BRD2/BRD2/BRD2/BRD2/PRKACA | 36 |
| GO:0032091 | negative regulation of protein binding | 36/3662 | 89/15509 | 0.000298782 | 0.00167135 | 0.00100512 | KDM1A/HFE/ROCK1/ACTB/GSK3B/BAX/TFIP11/PDGFB/ADNP/TLE5/DVL1/MAPK8/DKK1/ITGA4/PARK7/IFIT2/TEX14/CDKN1A/ID1/PIN1/IL10/SORL1/TDG/TMBIM6/ARRB2/DISC1/PRKCD/GOLGA2/ADRB2/ATP2A2/CTNNBIP1/AURKB/ADIPOQ/RGMA/NOG/B2M | 36 |
| GO:0045599 | negative regulation of fat cell differentiation | 24/3662 | 52/15509 | 0.000299321 | 0.00167285 | 0.00100602 | SIRT2/RUNX1T1/MMP11/AXIN1/TGFB1/GATA3/WNT5A/BMP2/IL6/FOXO1/ZFP36L2/GPER1/ZFPM2/DDIT3/ADIPOQ/C1QL4/TNF/TNF/TNF/TNF/TNF/TNF/TNF/TNF | 24 |
| GO:0060393 | regulation of pathway-restricted SMAD protein phosphorylation | 27/3662 | 61/15509 | 0.000301654 | 0.00168319 | 0.00101224 | HFE/BMP7/SMAD7/TGFB1/TGFBR1/ENG/BMPR1A/DKK1/INHBA/LRP1/BMP2/PIN1/TWSG1/GDF15/SMAD6/SMAD4/BMP6/NODAL/INHBB/TGFBR2/GDF9/NOG/CSNK2B/CSNK2B/CSNK2B/CSNK2B/CSNK2B | 27 |
| GO:0052548 | regulation of endopeptidase activity | 112/3662 | 354/15509 | 0.000301715 | 0.00168319 | 0.00101224 | BAD/CASP10/LTF/HGF/BIRC3/FAS/CD44/BAK1/CYFIP2/NGFR/RHOA/ROCK1/TP63/PICALM/BAX/PEBP1/BIRC5/PSME1/PSMA3/MMP9/BIRC7/USP14/MEFV/PYCARD/PDCD5/GPI/TFPI2/DNAJB6/NOD1/CASP2/SERPINE1/AMBP/CRYAB/PERP/HSPE1/PARK7/HDAC1/FASLG/SERPINC1/TNFSF10/RECK/NR4A1/SEMG1/C3/SPINK2/ADRM1/PSME3/NGF/AKIRIN2/MICAL1/SERPINE2/ANP32B/MTCH1/SORL1/THBS1/BCL2L10/FURIN/ARRB2/PMAIP1/APP/CCN1/ARL6IP5/GSN/SERPINH1/CRIM1/BCL2L11/CAST/NODAL/FABP1/GPER1/INTS1/SYK/VCP/RAG1/FADD/LGALS9/PRELID1/EFNA1/MGMT/SERPINB9/TRIAP1/EIF2AK3/A2M/GRIN1/PAK2/F2R/ANXA2/CARD9/HMGB1/SPOCK3/DAPK1/SRC/MAP3K5/MBP/CR1/TNF/PSENEN/TNF/FIS1/MAGEA3/TNF/TNF/TNF/TNF/TNF/TNF/NAIP/PDCD6/NAIP/CRIM1/NAIP/GPI | 112 |
| GO:0060135 | maternal process involved in female pregnancy | 25/3662 | 55/15509 | 0.00030272 | 0.00168728 | 0.0010147 | ITGA3/PRDM1/DAZAP1/PGR/TMED2/ESR1/ANGPT2/KLF1/PTN/CYP27B1/VDR/PPARD/ASH1L/ARG1/SPP1/LIF/MEN1/PARP1/NODAL/STC1/WNT4/LGALS9/BSG/EPOR/LOC102724560 | 25 |
| GO:2000036 | regulation of stem cell population maintenance | 26/3662 | 58/15509 | 0.000303371 | 0.00168939 | 0.00101597 | ARID4B/BICRA/ELAVL1/TP63/ACTB/KDM2B/BCL7C/SMARCB1/BMP7/RBBP7/PTN/BCL7A/KDM3A/HDAC1/ARID1A/CNOT1/LOXL2/TAF5L/TET1/OGT/HMGA2/NODAL/TAF6L/RBBP4/SAP30/SMARCB1 | 26 |
| GO:2000758 | positive regulation of peptidyl-lysine acetylation | 18/3662 | 35/15509 | 0.000325329 | 0.00180889 | 0.00108783 | BAZ1B/SNAI2/FOXP3/SMARCB1/GATA3/SF3B1/SOX4/DEK/LIF/PRKAA1/MYBBP1A/WBP2/SMAD4/SMARCA5/BRD7/MUC1/SMARCB1/TADA2A | 18 |
| GO:2000058 | regulation of ubiquitin-dependent protein catabolic process | 57/3662 | 159/15509 | 0.000325413 | 0.00180889 | 0.00108783 | HFE/RNF14/UFL1/HERPUD1/HIPK2/SIRT2/CSNK2A2/MKRN2/SIRT6/UBE2K/GSK3B/XPO1/HECTD1/BAG6/HSP90AB1/USP14/SMAD7/N4BP1/AXIN1/SGTA/GSK3A/DVL1/USP5/PDCL3/PARK7/CDC20/RAD23B/CLU/PTK2B/USP9X/CBFA2T3/HSPBP1/EGF/CSNK1D/GNA12/TLK2/OGT/EIF3H/RNF144A/DISC1/RYBP/RCHY1/SHH/VCP/PTK2/GLMN/MAGEF1/PRKN/USP7/SVIP/BAG6/BAG6/BAG6/BAG6/BAG6/CEBPA/PTEN | 57 |
| GO:0031647 | regulation of protein stability | 93/3662 | 286/15509 | 0.000341366 | 0.00189587 | 0.00114014 | RPAP3/MYLIP/TYROBP/IGF1/GRN/USP28/PER3/CTSA/VPS35/SEL1L/FBXW11/SIRT6/NDC80/BAG6/HSP90AB1/SH3GLB1/POLR2E/RASSF2/SMAD7/UBL4A/PYCARD/URI1/BAG1/DVL1/CRYAB/HSPA8/CD81/PFDN1/PDCL3/PARK7/P3H1/CLU/TARDBP/TRIM24/PFDN5/USP9X/SOX4/BMP2/NR1D1/UXT/PIN1/FLOT2/KRAS/CCNH/CCT7/STXBP1/DERL1/SERF2/ANK2/PIK3R1/GSN/BAG3/GNAQ/B4GALT5/LMNA/DVL3/PEX19/RNF149/PRKCD/NAA15/CASP3/TERT/BTRC/CCT2/TRIM44/CDKN2AIP/TNIP2/EFNA1/AHSP/OTUD3/TADA3/HCFC1/CALR/NPM1/CHEK2/PRKN/NF2/USP7/SRC/DDI2/PARVA/GLMP/PFDN6/RNF5/BAG6/ZSWIM7/BAG6/BAG6/BAG6/BAG6/DDOST/PRKDC/PTEN | 93 |
| GO:0006898 | receptor-mediated endocytosis | 79/3662 | 236/15509 | 0.00034365 | 0.00190554 | 0.00114596 | SELE/CD9/HFE/AP2S1/HMMR/FCGR2B/PICALM/LRP2/ACHE/MICALL1/LILRB1/TFR2/SERPINE1/AP1S1/SFRP4/DKK1/UNC119/FOLR1/CD81/IL4/ITGA4/SNX17/SDC1/CLU/CLTA/LRP1/C3/APOE/CAP1/SFTPD/CD36/AHI1/DBNL/RABEPK/CCL21/SORL1/ITGAV/EGF/ARRB2/VLDLR/ITGB1/BICD1/LDLRAP1/ARHGAP27/ITGB2/AP2M1/CXCR1/TGFBR2/SLC9B2/SYK/AMN/ADRB2/CXCL8/ITGAM/CD14/CCL19/GRB2/CXCR2/ADIPOQ/ANXA2/CNTN2/HGS/LILRB4/MAGI2/CLN3/BTBD8/IGF2R/DPP4/DNM3/ITGB3/B2M/LILRB1/LILRB4/LILRB1/LILRB1/LILRB1/LILRB4/LILRB4/LRP6 | 79 |
| GO:0002082 | regulation of oxidative phosphorylation | 15/3662 | 27/15509 | 0.000344953 | 0.00190554 | 0.00114596 | RHOA/PPIF/SLC25A23/AK4/VCP/SLC25A33/PDE12/TNF/TNF/TNF/TNF/TNF/TNF/TNF/TNF | 15 |
| GO:0072012 | glomerulus vasculature development | 15/3662 | 27/15509 | 0.000344953 | 0.00190554 | 0.00114596 | NOTCH3/ANGPT2/PDGFB/BMP7/ACTA2/PDGFRB/HES1/TEK/EGR1/NOTCH2/PDGFRA/NOTCH1/IL6R/ITGB3/PECAM1 | 15 |
| GO:0072574 | hepatocyte proliferation | 15/3662 | 27/15509 | 0.000344953 | 0.00190554 | 0.00114596 | XBP1/PTN/MDK/TNFAIP3/NOTCH2/IL6/CEBPB/TNF/TNF/TNF/TNF/TNF/TNF/TNF/TNF | 15 |
| GO:0072575 | epithelial cell proliferation involved in liver morphogenesis | 15/3662 | 27/15509 | 0.000344953 | 0.00190554 | 0.00114596 | XBP1/PTN/MDK/TNFAIP3/NOTCH2/IL6/CEBPB/TNF/TNF/TNF/TNF/TNF/TNF/TNF/TNF | 15 |
| GO:1902235 | regulation of endoplasmic reticulum stress-induced intrinsic apoptotic signaling pathway | 15/3662 | 27/15509 | 0.000344953 | 0.00190554 | 0.00114596 | HERPUD1/XBP1/CREB3/PARK7/SERINC3/TMBIM6/PMAIP1/BCL2L11/BCL2L1/EIF2AK3/DDIT3/PTPN2/GRINA/PRKN/MAGEA3 | 15 |
| GO:0061041 | regulation of wound healing | 48/3662 | 129/15509 | 0.000353576 | 0.00195144 | 0.00117356 | CD9/F7/MYLK/APOH/XBP1/PDGFB/FERMT1/PLAT/SERPINE1/ACTA2/SH2B3/SMOC2/HBEGF/SERPINC1/TNFAIP3/CXCR4/APOE/EPHB2/PDGFRA/CD36/SERPINE2/THBS1/FGF2/ADAMTS18/ITGB1/DMTN/WNT4/PRKCD/NOS3/PRDX2/PTK2/PRKCE/FGG/FGA/HRAS/F2/F2R/ANXA2/MTOR/TNF/TNF/TNF/TNF/TNF/TNF/TNF/TNF/PTEN | 48 |
| GO:0010762 | regulation of fibroblast migration | 19/3662 | 38/15509 | 0.000356791 | 0.00196219 | 0.00118003 | HYAL2/TGFB1/HAS1/ACTA2/CORO1C/GNA13/AKAP12/THBS1/FGF2/GNA12/ITGB1/APPL1/DMTN/PTK2/PRKCE/RCC2/SLC8A1/CLN3/ITGB3 | 19 |
| GO:0035136 | forelimb morphogenesis | 19/3662 | 38/15509 | 0.000356791 | 0.00196219 | 0.00118003 | HOXA11/ALX4/TP63/HOXA9/ATRX/RPGRIP1L/WNT3/ZBTB16/RECK/RUNX2/HOXD9/ALDH1A2/TFAP2A/RNF165/CRABP2/SHH/ZNF358/WNT3/WNT3 | 19 |
| GO:0098751 | bone cell development | 19/3662 | 38/15509 | 0.000356791 | 0.00196219 | 0.00118003 | PAFAH1B1/TYROBP/LTF/ATP6AP1/LILRB1/SH2B3/NOTCH2/MEIS1/KIT/ZNF385A/SLC9B2/FAM20C/PTPN11/ANXA2/SRC/LILRB1/LILRB1/LILRB1/LILRB1 | 19 |
| GO:1903573 | negative regulation of response to endoplasmic reticulum stress | 19/3662 | 38/15509 | 0.000356791 | 0.00196219 | 0.00118003 | UFL1/HSPA5/HERPUD1/PPP1R15A/XBP1/USP14/BFAR/SGTA/CREB3/PARK7/CLU/TMBIM6/USP25/PPP1R15B/BCL2L1/GRINA/PRKN/SVIP/MAGEA3 | 19 |
| GO:0010948 | negative regulation of cell cycle process | 89/3662 | 272/15509 | 0.000359503 | 0.00197536 | 0.00118794 | CRY1/BAZ1B/FHL1/USP28/RAD51/NDC80/ATRX/ZW10/BIRC5/CDC6/MSH2/BMP7/RBBP8/NUBP1/NBN/DOT1L/CASP2/EZH2/CCL2/CCND1/FBXO5/MAPK14/CCNG1/RAD50/MACROH2A1/BCL6/KAT2B/CDC20/PKD2/TEX14/INHBA/CDKN1A/LIF/MEN1/CCNB1/CDCA8/APC/NABP2/BRCA2/RB1/CUL4A/DTL/INTS3/CTDSP1/PLK2/SPC25/ZFP36L2/SMARCA5/XPC/EME1/PRMT2/BRSK1/MRNIP/RPL26/GPER1/BRD7/WEE1/RFWD3/BUB1/AVEN/CDK1/TRIAP1/RHNO1/NABP1/ZWILCH/CTDSP2/AURKAIP1/AURKB/PTPN11/NPM1/CACNB4/CEP63/CHEK2/FOXO4/MUC1/ZFP36L1/H2AX/KANK2/GIGYF2/HLA-G/HLA-G/HLA-G/HLA-G/HLA-G/HLA-G/HLA-G/PRKDC/HLA-G/PTEN | 89 |
| GO:0031650 | regulation of heat generation | 11/3662 | 17/15509 | 0.000364467 | 0.00199909 | 0.00120222 | IL1B/EDNRB/TNFRSF11A/TNF/TNF/TNF/TNF/TNF/TNF/TNF/TNF | 11 |
| GO:0045945 | positive regulation of transcription by RNA polymerase III | 11/3662 | 17/15509 | 0.000364467 | 0.00199909 | 0.00120222 | BAZ1B/CHD8/ELL/SF3B1/INHBA/DEK/ICE2/MYBBP1A/SMARCA5/BRF1/MTOR | 11 |
| GO:0030307 | positive regulation of cell growth | 53/3662 | 146/15509 | 0.00036507 | 0.00200062 | 0.00120314 | CD38/PAFAH1B1/IGF1/CYBA/NTN1/RHOA/CDC42/DERL2/SLC23A2/KDM2B/ADNP/SMAD7/SFRP1/DDX49/HAMP/MTPN/BRAT1/TGFBR1/CXCL12/WNT3/EIF4G2/HBEGF/DBN1/FN1/PTK2B/CXCR4/NGF/DBNL/NCBP1/CRABP2/SYT2/EGFR/POU4F2/MMP14/DISC1/H3-3A/RICTOR/FXN/CDKN2AIP/LPAR3/SLC25A33/BDNF/CDH4/F2/CIB1/PRKN/PRR5/TEAD1/MTOR/GDI1/TWF2/WNT3/WNT3 | 53 |
| GO:0036503 | ERAD pathway | 41/3662 | 106/15509 | 0.000366744 | 0.00200802 | 0.00120759 | HSPA5/HERPUD1/ATXN3/SEL1L/DERL2/BAG6/XBP1/PSMC6/USP14/UGGT2/SGTA/CCDC47/UBE4A/MAN1A1/TRIM25/FBXO44/ECPAS/DERL1/FAM8A1/RNF121/ERLIN2/DNAJB12/CLGN/USP25/TMUB1/VCP/UBXN6/BRSK2/CALR/YOD1/PRKN/SVIP/UBE2J1/RNF5/BAG6/TRIM13/BAG6/BAG6/BAG6/BAG6/FBXO17 | 41 |
| GO:1903533 | regulation of protein targeting | 31/3662 | 74/15509 | 0.000371231 | 0.00203079 | 0.00122128 | CSNK2A2/LMAN1/SH3GLB1/PDCD5/GSK3A/RAC2/PRKAA1/SAE1/BAG3/DMTN/ITGB2/BAP1/CDK5/MFF/ITGAM/HRAS/PDZK1/ATG13/CDK5R1/MIEF2/CIB1/PRKN/UBE2L3/UBL5/GDI1/HSPA1L/HSPA1L/FIS1/HSPA1L/HSPA1L/HSPA1L | 31 |
| GO:0007052 | mitotic spindle organization | 44/3662 | 116/15509 | 0.00037741 | 0.00206096 | 0.00123942 | SPAST/PARP3/EML1/RHOA/SMC1A/NDC80/PIBF1/CHMP5/TPX2/BIRC5/NUDC/KIF4A/MYBL2/CHMP4B/RAB11A/ARHGEF10/BCCIP/SMC3/CDC20/STMN1/PTPA/SBDS/CHMP1A/CCNB1/PSRC1/CDCA8/BORA/NUMA1/KIF23/CENPE/PLK2/SPC25/PCNT/MAP9/VCP/GOLGA2/CHMP6/AURKB/CHEK2/DRG1/KIFC1/LSM14A/TBCE/SPICE1 | 44 |
| GO:2000779 | regulation of double-strand break repair | 44/3662 | 116/15509 | 0.00037741 | 0.00206096 | 0.00123942 | KDM1A/PARP3/ARID1B/RAD51/ACTB/SIRT6/FUS/BCL7C/SMARCB1/TFIP11/RBBP8/RECQL5/SMARCD2/NSD2/BCL7A/FOXM1/ARID1A/SLF2/SHLD2/MORF4L2/DEK/YEATS4/AUNIP/POT1/EPC2/ACTR2/PARP1/RADX/PPP4C/HMGA2/MRNIP/BRD7/RNF169/NUDT16L1/MGMT/KAT5/RMI2/MAGEF1/SETD2/ARID2/TRRAP/PRKDC/RTEL1/SMARCB1 | 44 |
| GO:0003205 | cardiac chamber development | 55/3662 | 153/15509 | 0.000379191 | 0.00206886 | 0.00124418 | PKP2/PRDM1/FGFR2/NDST1/LRP2/ZMPSTE24/FKBP1A/HECTD1/DSP/BMP7/SMAD7/NPRL3/TGFB1/GSK3A/TGFBR1/ENG/GATA3/BMPR1A/NSD2/NPHP3/WNT5A/HES1/SNX17/FHL2/TNNT2/NRP2/TEK/SOX4/BMP2/TNNI3/NOTCH2/SMAD6/IGF1R/GREB1L/SMAD4/CCN1/SLIT2/ANK2/NOTCH1/POU4F1/ADAMTS1/TNNI1/MAML1/RBM15/TGFBR2/HEYL/NOS3/FRS2/DCTN5/RBPJ/ZFPM2/NKX2-5/NOG/SLIT3/PARVA | 55 |
| GO:0043467 | regulation of generation of precursor metabolites and energy | 47/3662 | 126/15509 | 0.000379587 | 0.0020692 | 0.00124438 | SLC4A1/IGF1/RHOA/SIRT6/GSK3B/P2RX7/GSK3A/PPIF/IFNG/IL4/PASK/PARK7/PPP1R3C/SLC25A23/TRAP1/DYRK2/CBFA2T3/PRKAA1/CCNB1/ISCU/KHK/COX17/APP/ARNT/OGT/SLC2A6/AK4/VCP/GPD1/DDIT4/PRELID1/CDK1/PGAM1/SLC25A33/PDE12/PHLDA2/MTOR/TNF/TNF/TNF/TNF/TNF/TNF/TNF/TNF/EIF6/IL10RB | 47 |
| GO:0033044 | regulation of chromosome organization | 74/3662 | 219/15509 | 0.000380767 | 0.00207381 | 0.00124715 | CDC27/UPF1/BAZ1B/ARID1B/RNF4/SMG6/ACTB/SIRT6/XRCC5/NDC80/ATRX/ZW10/MAPKAPK5/ANAPC5/BIRC5/HNRNPC/CDC6/BCL7C/SMARCB1/ACTR5/NBN/SMARCD2/BCL7A/FBXO5/RAD50/MACROH2A1/SMC4/XRN1/KAT2B/INO80D/CDC20/ARID1A/SLF2/TEX14/BECN1/POT1/DNMT1/DKC1/TOP2A/CCNB1/PPHLN1/CDCA8/APC/HNRNPA1/CCT7/NUMA1/CENPE/NABP2/RB1/PIF1/PARP1/SPC25/SMARCA5/TAL1/H3-3A/BRD7/CCT2/BUB1/EXOSC10/DCP2/KAT5/LIG4/ZWILCH/RMI2/AURKB/MAPK15/USP7/ARID2/SRC/SMG5/TEN1/RTEL1/SMARCB1/TINF2 | 74 |
| GO:0045646 | regulation of erythrocyte differentiation | 20/3662 | 41/15509 | 0.000381845 | 0.00207515 | 0.00124796 | SPI1/GATA1/HOXA5/MAPK14/HSPA9/STAT1/FOXO3/INHBA/PRMT1/ZFP36/ABCB10/ARNT/TAL1/INPP5D/STAT5B/ZFP36L1/MAFB/PRKDC/B2M/INPP5D | 20 |
| GO:0010226 | response to lithium ion | 13/3662 | 22/15509 | 0.000382353 | 0.00207515 | 0.00124796 | CDH1/GSK3A/IGFBP2/PTK2B/IMPA2/PKLR/SHH/ADCY1/ARL13B/LIG4/CALR/CEBPA/PKLR | 13 |
| GO:0034104 | negative regulation of tissue remodeling | 13/3662 | 22/15509 | 0.000382353 | 0.00207515 | 0.00124796 | CD38/P2RX7/CSK/SFRP1/HAMP/CALCA/TNFAIP3/IAPP/IL6/TNFRSF11B/INPP5D/GPR137/INPP5D | 13 |
| GO:1903799 | negative regulation of miRNA maturation | 13/3662 | 22/15509 | 0.000382353 | 0.00207515 | 0.00124796 | ZMPSTE24/ESR1/TGFB1/IL6/TERT/TNF/TNF/TNF/TNF/TNF/TNF/TNF/TNF | 13 |
| GO:0001707 | mesoderm formation | 30/3662 | 71/15509 | 0.000384242 | 0.00208358 | 0.00125303 | HOXA11/ITGA3/FGFR2/PRKACA/ITGA8/BMP7/AXIN1/EYA1/GPI/BMPR1A/DKK1/WNT3/WNT5A/INHBA/TWSG1/ARMC5/EPHA2/HMGA2/ITGB1/GJA1/NODAL/SMAD2/NOG/NF2/TXNRD1/ITGB3/WNT3/WNT3/GPI/PRKACA | 30 |
| GO:0060606 | tube closure | 36/3662 | 90/15509 | 0.000386117 | 0.00209192 | 0.00125804 | PRKACA/TULP3/LRP2/TMED2/KDM2B/HECTD1/ABL1/CECR2/MTHFD1/TSC2/SFRP1/TGFB1/DVL1/FOLR1/NPHP3/WNT5A/MTHFD1L/RARA/BBS4/SKI/ARHGAP35/DVL3/VANGL2/CASP3/SEMA4C/RARG/GLMN/SETD2/RGMA/NOG/BRD2/BRD2/BRD2/BRD2/BRD2/PRKACA | 36 |
| GO:0110053 | regulation of actin filament organization | 81/3662 | 244/15509 | 0.000391441 | 0.00211891 | 0.00127428 | SCIN/CYFIP2/RHOA/ROCK1/SPTB/CDC42/WDR1/ARHGEF10L/ADD2/ACTN2/ADD1/PXN/ABL1/HCK/COTL1/PYCARD/TJP1/SFRP1/ARHGEF10/MTPN/MET/TGFBR1/CXCL12/CSF3/ARPC3/DBN1/CAPZA1/STMN1/PTK2B/DSTN/ID1/CCR7/CDC42EP1/ARPC1B/PPFIA1/WASF3/DBNL/CCL21/RDX/ABI2/BBS4/SLIT2/PIK3R1/ARHGAP18/C9orf72/GSN/CDC42EP2/PLEKHH2/DMTN/ARHGAP35/SPTBN4/ALOX15/WNT4/ARPC5/CDC42EP3/SPTA1/PRKCD/ARFIP1/RICTOR/TTC8/S1PR1/PRKCE/CCL11/SPTBN2/FLII/GRB2/PAK2/PRKN/NF2/CD47/GMFB/SPTAN1/MTOR/IQANK1/TMSB4X/PDXP/ARPC1A/TWF2/SHANK3/BRK1/TJP1 | 81 |
| GO:0045685 | regulation of glial cell differentiation | 29/3662 | 68/15509 | 0.000396164 | 0.0021426 | 0.00128852 | TMEM98/TNFRSF1B/KDM4A/WDR1/TP73/TGFB1/PTN/MDK/HES1/ID2/HDAC1/CXCR4/EGR2/NKX2-2/BMP2/NR1D1/LIF/SERPINE2/IL6/DUSP10/TNFRSF21/NOTCH1/SHH/CDK1/DAG1/F2/NOG/CNTN2/MTOR | 29 |
| GO:0035305 | negative regulation of dephosphorylation | 21/3662 | 44/15509 | 0.00040075 | 0.00216552 | 0.0013023 | ROCK1/GSK3B/PPP1R15A/FKBP1A/PPP1R16B/URI1/PTPA/MASTL/CRY2/STYXL1/ENSA/BOD1/TNF/PPP1R11/TNF/TNF/TNF/TNF/TNF/TNF/TNF | 21 |
| GO:1903556 | negative regulation of tumor necrosis factor superfamily cytokine production | 28/3662 | 65/15509 | 0.000406652 | 0.00219497 | 0.00132002 | LTF/IGF1/FOXP3/ARG2/ACP5/LILRB1/IL27RA/CD33/IL4/TNFAIP3/RARA/SYT11/PTPN22/IL10/TLR4/ARRB2/NOD2/LGALS9/ADIPOQ/LILRB4/ORM1/LILRB1/LILRB4/LILRB1/LILRB1/LILRB1/LILRB4/LILRB4 | 28 |
| GO:0048525 | negative regulation of viral process | 35/3662 | 87/15509 | 0.000406909 | 0.00219497 | 0.00132002 | LTF/EIF2AK2/MID2/MAVS/N4BP1/TRIM14/AICDA/STAT1/TRIM25/ZFP36/TRIM5/SRPK2/GSN/HMGA2/MBL2/TRIM8/LARP7/BANF1/CIITA/IFITM1/HEXIM1/PLSCR1/PPIA/TNF/TRIM13/TNF/TNF/TNF/TNF/TNF/TNF/TNF/TRIM26/CCL5/CCL5 | 35 |
| GO:0035270 | endocrine system development | 46/3662 | 123/15509 | 0.000407341 | 0.00219539 | 0.00132027 | BAD/BAK1/CDH1/PITX1/GLI2/RAP1GAP/GSK3B/GSK3A/HOXA5/TGFBR1/GATA3/BMPR1A/MDK/WNT5A/HES1/CRHR1/SOX4/NKX2-2/BMP2/THRA/HOXD3/ALDH1A2/MNX1/MEN1/PDGFRA/IL6/NKX2-1/CYP1B1/FGF2/ARMC5/SMAD4/ARID5B/BMP6/IL6R/WNT4/INHBB/PITX2/SHH/RBPJ/CDH2/EIF2AK3/SMAD2/NKX2-5/NOG/POU3F2/PBX1 | 46 |
| GO:0032703 | negative regulation of interleukin-2 production | 16/3662 | 30/15509 | 0.000408685 | 0.00219938 | 0.00132267 | FOXP3/NAV3/TBX21/PTPRC/GATA3/TNFAIP3/ZFP36/SFTPD/NOD2/KAT5/LILRB4/CR1/PTPRC/LILRB4/LILRB4/LILRB4 | 16 |
| GO:0048863 | stem cell differentiation | 75/3662 | 223/15509 | 0.000408791 | 0.00219938 | 0.00132267 | UFL1/SNAI2/EIF2AK2/FGFR2/CDC42/MBD3/TP63/SIRT6/XRCC5/PTPRC/GSK3B/ESR1/ABL1/OSM/BMP7/RBBP7/SETD6/SFRP1/ERCC2/PTN/EZH2/BMPR1A/WNT3/FOLR1/CORO1C/SH2B3/CHD4/MAPK14/HSPA9/FAM172A/HES1/FN1/KDM3A/HDAC1/NRP2/PHF19/RUNX2/ZFP36/LIF/ALDH1A2/LAMA5/PDGFRA/EDNRB/FGF2/SMAD4/NOTCH1/HMGA2/ITGB1/ZFP36L2/KIT/RBBP4/FRZB/PITX2/SHH/CDK12/GATAD2A/RBPJ/SEMA4C/HOXD4/SEMA3E/CDH2/KAT5/A2M/SETD2/NKX2-5/NOG/FOXO4/NELFB/PDCD6/PRKDC/PTPRC/WNT3/WNT3/LRP6/ITCH | 75 |
| GO:0051216 | cartilage development | 63/3662 | 181/15509 | 0.000412474 | 0.00221727 | 0.00133343 | HOXA11/SCIN/SNAI2/RUNX3/CD44/BARX2/HYAL2/FGFR3/PITX1/ZMPSTE24/GLG1/BMP7/SMAD7/SLC39A14/TGFB1/HOXA5/TGFBR1/BMPR1A/ZBTB16/MDK/WNT5B/MAPK14/SMAD5/WNT5A/PRRX1/SNX19/RUNX2/BMP2/THRA/HOXD3/TWSG1/RARA/CHI3L1/LOXL2/ADAMTS7/CCN3/FGF2/COL2A1/RB1/CCN1/ZEB1/SERPINH1/HMGA2/BMP6/STC1/RUNX1/FRZB/TGFBR2/BMP1/EIF2AK3/RARG/ESRRA/LEP/TYMS/MAF/PTPN11/CREB3L2/RFLNB/NOG/WNT7B/COL27A1/COL11A2/LOC102724560 | 63 |
| GO:0030521 | androgen receptor signaling pathway | 22/3662 | 47/15509 | 0.000413966 | 0.00222144 | 0.00133593 | KDM1A/RNF14/PLPP1/RHOA/PIAS2/SFRP1/ZMIZ1/DDX5/KDM3A/PARK7/HDAC1/ARID1A/PKN1/NODAL/PRMT2/HEYL/TRIM68/DAXX/DAXX/DAXX/DAXX/DAXX | 22 |
| GO:0060964 | regulation of miRNA-mediated gene silencing | 22/3662 | 47/15509 | 0.000413966 | 0.00222144 | 0.00133593 | PUM2/ELAVL1/ZMPSTE24/ESR1/TGFB1/DDX5/ZFP36/AJUBA/MYCN/IL6/EGFR/TERT/TRUB1/TNF/TNF/TNF/TNF/TNF/TNF/TNF/TNF/NEAT1 | 22 |
| GO:0003279 | cardiac septum development | 39/3662 | 100/15509 | 0.000415062 | 0.0022229 | 0.00133681 | PRDM1/FGFR2/NDST1/LRP2/HECTD1/BMP7/SMAD7/NPRL3/TGFBR1/ENG/GATA3/BMPR1A/NSD2/NPHP3/WNT5A/HES1/SNX17/NRP2/SOX4/NOTCH2/SMAD6/SMAD4/CCN1/SLIT2/ANK2/NOTCH1/MAML1/RBM15/TGFBR2/HEYL/NOS3/FRS2/DCTN5/RBPJ/ZFPM2/NKX2-5/NOG/SLIT3/PARVA | 39 |
| GO:0032835 | glomerulus development | 27/3662 | 62/15509 | 0.000415315 | 0.0022229 | 0.00133681 | PROM1/NOTCH3/ANGPT2/PDGFB/BMP7/ACTA2/PDGFRB/HES1/TEK/EGR1/PODXL/FOXJ1/NOTCH2/PDGFRA/EDNRB/PLCE1/ENPEP/NOTCH1/IL6R/HEYL/LAMB2/ADIPOQ/NOG/MAGI2/ITGB3/PECAM1/CD24 | 27 |
| GO:0061077 | chaperone-mediated protein folding | 27/3662 | 62/15509 | 0.000415315 | 0.0022229 | 0.00133681 | CD74/HSPA5/FKBP1A/PDCD5/DNAJB6/HSPB1/BAG1/HSPA8/CHORDC1/HSPA9/PDCL3/HSPE1/P3H1/CLU/TRAP1/HSPA2/CCT7/DNAJB12/PDIA4/PEX19/CCT2/HSPA1L/HSPA1L/HSPA1L/HSPA1L/HSPA1L/CHORDC1 | 27 |
| GO:0000819 | sister chromatid segregation | 67/3662 | 195/15509 | 0.000417162 | 0.00223086 | 0.0013416 | CDC27/BAZ1B/ARID1B/SMC1A/ACTB/SPAG5/NDC80/PIBF1/ATRX/SEH1L/CHMP5/ZW10/ANAPC5/BIRC5/NUDC/KIF4A/CDC6/BCL7C/SMARCB1/CHMP4B/RAB11A/SMC3/SMARCD2/BCL7A/FBXO5/MACROH2A1/SMC4/KAT2B/CDC20/NSL1/ARID1A/SLF2/TEX14/NAA50/PDS5A/CENPK/BECN1/MAU2/CHMP1A/TOP2A/CCNB1/PSRC1/CDCA8/APC/NUMA1/NUSAP1/KIF23/CENPE/RB1/KIF2C/CENPC/BOD1/NCAPG2/SPC25/SMARCA5/BRD7/BUB1/KAT5/ZWILCH/RMI2/CHMP6/AURKB/MAPK15/KMT5A/ARID2/KIFC1/SMARCB1 | 67 |
| GO:0090066 | regulation of anatomical structure size | 142/3662 | 468/15509 | 0.000418389 | 0.00223549 | 0.00134439 | CD38/KDM1A/USH1C/IFRD1/SCIN/PAFAH1B1/CPS1/CASR/CDH1/CYFIP2/NTN1/RHOA/ROCK1/SPTB/WDR1/PICALM/ADD2/ACTN2/GSK3B/PPP1R15A/MMP2/ADD1/P2RX7/DPYSL2/HSP90AB1/ABL1/CDHR5/ADNP/HCK/COTL1/PYCARD/RAB11A/KCNN4/KXD1/MTPN/CXCL12/ACTA2/CSF3/WNT3/CALCA/ARPC3/PPARD/DBN1/WNT5A/TTL/FN1/CAPZA1/SPP1/PTK2B/DSTN/CCR7/HP1BP3/CDC42EP1/APOE/ARPC1B/PER2/NGF/EDNRB/DBNL/CCL21/KIAA0319/RDX/BBS4/SOD1/CRABP2/SNAPIN/SLIT2/ARHGAP18/SLC12A9/MSN/GSN/CDC42EP2/POU4F2/PLEKHH2/DMTN/ARHGAP35/SPTBN4/AP2M1/ALOX15/ARPC5/DISC1/CDC42EP3/SPTA1/PRKCD/RICTOR/GPER1/NOS3/CDK5/BORCS7/SEMA4C/ADRB2/SEMA3E/PRKCE/LPAR3/FGG/FGA/CCL11/RARG/SPTBN2/LEP/ZDHHC21/BDNF/FLII/GRB2/CDH4/OXTR/F2R/NPM1/SLC8A1/CNTN2/ADRA2C/DCC/WNT7B/LAMTOR4/CLN3/ABCB8/SPTAN1/MTOR/IQANK1/GDI1/TNF/AKT1S1/TMSB4X/TNF/TNF/TNF/TNF/TNF/TNF/TNF/PDXP/ARPC1A/HBB/TWF2/SHANK3/BRK1/LOC102724560/AKT3/NEFL/WNT3/WNT3/PTEN | 142 |
| GO:0048016 | inositol phosphate-mediated signaling | 26/3662 | 59/15509 | 0.000421707 | 0.00224283 | 0.0013488 | PTBP1/IGF1/ATP2B4/ERBB3/INPP5A/GSK3B/NFATC2/NFAT5/PPP3CB/FHL2/DYRK2/PLCE1/ITPR1/SPPL3/CHP2/CIB1/MTOR/TNF/TNF/STIMATE/TNF/TNF/TNF/TNF/TNF/TNF | 26 |
| GO:0007566 | embryo implantation | 23/3662 | 50/15509 | 0.000422062 | 0.00224283 | 0.0013488 | VMP1/FBLN1/MMP2/MMP9/SYDE1/C1QBP/CALCA/PPARD/SPP1/RECK/IL1B/LIF/EPO/SOD1/GJA1/NODAL/STC1/H3-3A/TGFBR2/BSG/CALR/YTHDF3/ITGB3 | 23 |
| GO:0019083 | viral transcription | 23/3662 | 50/15509 | 0.000422062 | 0.00224283 | 0.0013488 | MID2/SMARCB1/MON1B/USF2/TRIM14/HDAC1/TARDBP/ZFP36/MDFIC/TARBP2/HMGA2/PSMC3/TRIM8/LARP7/JUN/HEXIM1/TRIM13/CCL5/CCL5/CCL4/CCL4/SMARCB1/CCL4 | 23 |
| GO:0060966 | regulation of gene silencing by RNA | 23/3662 | 50/15509 | 0.000422062 | 0.00224283 | 0.0013488 | PUM2/ELAVL1/ZMPSTE24/ESR1/TGFB1/DDX5/ZFP36/AJUBA/MYCN/IL6/TARBP2/EGFR/TERT/TRUB1/TNF/TNF/TNF/TNF/TNF/TNF/TNF/TNF/NEAT1 | 23 |
| GO:2000059 | negative regulation of ubiquitin-dependent protein catabolic process | 23/3662 | 50/15509 | 0.000422062 | 0.00224283 | 0.0013488 | HFE/HIPK2/CSNK2A2/BAG6/HSP90AB1/USP14/N4BP1/SGTA/PDCL3/PARK7/USP9X/TLK2/OGT/EIF3H/RYBP/SHH/USP7/SVIP/BAG6/BAG6/BAG6/BAG6/BAG6 | 23 |
| GO:0006605 | protein targeting | 92/3662 | 284/15509 | 0.000422257 | 0.00224283 | 0.0013488 | AGK/ZDHHC6/TOMM34/HSPA5/HERPUD1/SEC61A1/AP3D1/SEC61A2/CSNK2A2/LMAN1/BAG6/SH3GLB1/TIMM13/RNF215/MICALL1/SAMM50/AP4S1/TIMM9/CHMP4B/UBL4A/MON1B/SGTA/PDCD5/GSK3A/GRPEL1/HSPA8/MAN1A1/PEX7/ARL6/SPCS1/TRAK2/MFN2/CLU/BECN1/ATG14/RAB3IP/RAC2/HACL1/TIMM10B/PRKAA1/AP3B1/ZDHHC4/SORL1/SRP14/SAE1/SRPRB/PARD3/IMMP1L/TIMM8B/BAG3/ZFAND2B/DMTN/ITGB2/ZDHHC12/PEX19/ZDHHC3/BAP1/CDK5/SRP68/MFF/ITGAM/TOMM20/HRAS/PDZK1/ATG13/TOMM5/ZDHHC21/CDK5R1/MIEF2/TRAK1/AP3M1/CIB1/PRKN/HGS/UBE2L3/NACA/UBL5/RASSF9/GDI1/ZDHHC18/HSPA1L/BAG6/HSPA1L/FIS1/HSPA1L/BAG6/BAG6/BAG6/HSPA1L/BAG6/HSPA1L/TIMM23 | 92 |
| GO:0016573 | histone acetylation | 56/3662 | 157/15509 | 0.000422295 | 0.00224283 | 0.0013488 | NFYA/KMT2E/MED24/BAZ1B/SNAI2/FOXP3/NFYC/SPI1/MBD3/ACTB/ZMPSTE24/ATXN7L3/BRPF3/SMARCB1/JADE3/GATA3/NAA40/ZNF451/KAT2B/SF3B1/PARK7/DR1/NAA50/MORF4L2/DEK/YEATS4/LIF/MYBBP1A/WBP2/TAF5L/EPC2/IRF4/BRCA2/SMAD4/OGT/KAT14/MBIP/SMARCA5/BRPF1/CTBP1/TAF6L/PYGO2/BRD7/SETD5/TADA3/HCFC1/KAT5/MSL2/TAF7/MUC1/NOC2L/WDR5/TRRAP/SMARCB1/TADA2A/PCGF2 | 56 |
| GO:0045428 | regulation of nitric oxide biosynthetic process | 25/3662 | 56/15509 | 0.000425333 | 0.00225676 | 0.00135718 | ATP2B4/HSP90AB1/ACP5/IFNG/PKD2/CLU/PTK2B/IL1B/ASS1/CD36/IL10/TLR4/DDAH1/CX3CR1/TRPV1/CD47/TNF/TNF/TNF/TNF/TNF/TNF/TNF/TNF/HBB | 25 |
| GO:0097720 | calcineurin-mediated signaling | 24/3662 | 53/15509 | 0.000425647 | 0.00225676 | 0.00135718 | PTBP1/IGF1/ATP2B4/ERBB3/GSK3B/NFATC2/NFAT5/PPP3CB/FHL2/NR5A2/DYRK2/SPPL3/CHP2/CIB1/MTOR/TNF/TNF/STIMATE/TNF/TNF/TNF/TNF/TNF/TNF | 24 |
| GO:0002244 | hematopoietic progenitor cell differentiation | 45/3662 | 120/15509 | 0.000436929 | 0.00231262 | 0.00139077 | UFL1/FLT4/EIF2AK2/SPI1/EML1/HYAL2/XRCC5/PTPRC/ABL1/OSM/FLT1/SFRP1/ERCC2/TGFB1/ARMC6/ZNHIT1/GATA3/SH2B3/BVES/ZBTB24/HSPA9/HES1/MYB/FLT3/INHBA/SOX4/SBDS/ZFP36/KDR/TOP2A/RARA/AP3B1/PDGFRA/NOTCH1/AGPAT5/KIT/SHH/KAT5/LIG4/CSF1R/CEBPD/TNFRSF13B/PRKDC/PTPRC/ITCH | 45 |
| GO:2000278 | regulation of DNA biosynthetic process | 45/3662 | 120/15509 | 0.000436929 | 0.00231262 | 0.00139077 | HGF/PARP3/SMG6/XRCC5/NOX4/MAPKAPK5/HNRNPC/HSP90AB1/PDGFB/GINS1/JADE3/PRKD2/SMOC2/PDGFRB/XRN1/PTK2B/CDKN1A/POT1/DKC1/MEN1/HNRNPA1/CCT7/CYP1B1/FGF2/PIF1/ARRB2/CCT2/EXOSC10/DCP2/AURKB/MAPK15/ADIPOQ/SRC/TFDP1/SMG5/TNF/TNF/TNF/TNF/TNF/TNF/TNF/TNF/TEN1/TINF2 | 45 |
| GO:0045995 | regulation of embryonic development | 33/3662 | 81/15509 | 0.000449234 | 0.0023737 | 0.0014275 | PAFAH1B1/LAMA3/RPS6KA6/BAG6/LAMA1/NPHP3/KAT2B/HES1/INO80D/DR1/TGIF2/LAMA5/TDG/NOTCH1/KAT14/MBIP/NODAL/B4GALT5/WNT4/POGLUT1/CDK1/TADA3/CFL1/DAG1/PHLDA2/PLCB1/WDR5/BAG6/BAG6/BAG6/BAG6/BAG6/TADA2A | 33 |
| GO:1901992 | positive regulation of mitotic cell cycle phase transition | 33/3662 | 81/15509 | 0.000449234 | 0.0023737 | 0.0014275 | CDC27/KMT2E/ANAPC5/CDC6/CDC7/APEX1/CDC25B/RAB11A/CCND1/FBXO5/CCND3/HSPA2/CCNB1/RDX/RB1/CUL4A/CYP1A1/APP/DTL/EGFR/ADAMTS1/LSM11/CUL4B/DBF4B/TERT/RRM1/CDK1/RRM2/RCC2/PLCB1/CDK10/PBX1/TFDP1 | 33 |
| GO:0009411 | response to UV | 50/3662 | 137/15509 | 0.000456903 | 0.00241217 | 0.00145064 | KDM1A/BAK1/USP28/TMEM161A/HYAL2/SIRT6/UBE2A/BAX/MMP2/MSH2/CIRBP/MMP9/ACTR5/N4BP1/ERCC2/MAPK8/CCND1/IL12B/CAT/CDKN1A/PRKAA1/MEN1/DDB2/XPA/BRCA2/CUL4A/DTL/PARP1/PIK3R1/EGFR/XPC/CUL4B/BRSK1/RPL26/ERCC3/PRKCD/UVSSA/CASP3/TP53INP1/TRIAP1/RHNO1/RELA/AURKB/NPM1/H2AC25/NOC2L/MME/MMP1/ELANE/ELANE | 50 |
| GO:0002726 | positive regulation of T cell cytokine production | 17/3662 | 33/15509 | 0.000463262 | 0.00243537 | 0.00146459 | TBX21/GATA3/CD81/IL4/IL1B/IL6/IL18/CD55/HLA-A/HLA-A/HLA-A/HLA-A/HLA-A/HLA-A/HLA-A/HLA-A/B2M | 17 |
| GO:0032743 | positive regulation of interleukin-2 production | 17/3662 | 33/15509 | 0.000463262 | 0.00243537 | 0.00146459 | CD4/PTPRC/ABL1/PRKD2/PDE4D/CD86/IL1A/CD80/IL1B/IRF4/RUNX1/STAT5B/GLMN/CD28/PDE4B/PNP/PTPRC | 17 |
| GO:0045940 | positive regulation of steroid metabolic process | 17/3662 | 33/15509 | 0.000463262 | 0.00243537 | 0.00146459 | IFNG/IL1A/NR1D1/APOE/PRKAA1/IGF1R/BMP6/LDLRAP1/WNT4/TNF/TNF/TNF/TNF/TNF/TNF/TNF/TNF | 17 |
| GO:1903203 | regulation of oxidative stress-induced neuron death | 17/3662 | 33/15509 | 0.000463262 | 0.00243537 | 0.00146459 | PARK7/NR4A3/IL10/TLR4/MEAK7/PARP1/NONO/TBC1D24/PRKN/TNF/TNF/TNF/TNF/TNF/TNF/TNF/TNF | 17 |
| GO:2000515 | negative regulation of CD4-positive, alpha-beta T cell activation | 17/3662 | 33/15509 | 0.000463262 | 0.00243537 | 0.00146459 | RUNX3/FOXP3/CBFB/TBX21/IL4R/ARG2/SMAD7/JAK3/IL4/BCL6/TWSG1/NDFIP1/HLX/RUNX1/LGALS9/HMGB1/ITCH | 17 |
| GO:0019080 | viral gene expression | 37/3662 | 94/15509 | 0.000467649 | 0.00245635 | 0.0014772 | ST3GAL1/PTBP1/ST6GAL1/MID2/GSK3B/SMARCB1/MON1B/USF2/GSK3A/EIF3B/TRIM14/EIF3A/SPCS1/HDAC1/TARDBP/PRMT1/ZFP36/MDFIC/ST6GALNAC4/TARBP2/FURIN/HMGA2/ST3GAL2/PSMC3/TRIM8/LARP7/JUN/ST6GALNAC3/HEXIM1/PCBP2/TRIM13/CCL5/CCL5/CCL4/CCL4/SMARCB1/CCL4 | 37 |
| GO:0002361 | CD4-positive, CD25-positive, alpha-beta regulatory T cell differentiation | 10/3662 | 15/15509 | 0.000483147 | 0.00252704 | 0.00151972 | FOXP3/IFNG/IL2RG/LGALS9/KLHL25/HLA-DRA/HLA-DRA/HLA-DRA/HLA-DRA/HLA-DRA | 10 |
| GO:0031652 | positive regulation of heat generation | 10/3662 | 15/15509 | 0.000483147 | 0.00252704 | 0.00151972 | IL1B/TNFRSF11A/TNF/TNF/TNF/TNF/TNF/TNF/TNF/TNF | 10 |
| GO:0032819 | positive regulation of natural killer cell proliferation | 10/3662 | 15/15509 | 0.000483147 | 0.00252704 | 0.00151972 | IL12B/IL18/STAT5B/HLA-E/HLA-E/HLA-E/HLA-E/HLA-E/HLA-E/HLA-E | 10 |
| GO:0071871 | response to epinephrine | 10/3662 | 15/15509 | 0.000483147 | 0.00252704 | 0.00151972 | KCNQ1/ATP2B4/SIRT2/PRKACA/ABL1/PKLR/ADIPOQ/PDE4B/PKLR/PRKACA | 10 |
| GO:1903960 | negative regulation of anion transmembrane transport | 10/3662 | 15/15509 | 0.000483147 | 0.00252704 | 0.00151972 | ARL6IP5/SLC43A2/TNF/TNF/TNF/TNF/TNF/TNF/TNF/TNF | 10 |
| GO:1903209 | positive regulation of oxidative stress-induced cell death | 14/3662 | 25/15509 | 0.000487809 | 0.00254862 | 0.0015327 | NOX1/ABL1/PARK7/FOXO3/TLR4/SOD1/TNF/TNF/TNF/TNF/TNF/TNF/TNF/TNF | 14 |
| GO:0006397 | mRNA processing | 129/3662 | 421/15509 | 0.000488095 | 0.00254862 | 0.0015327 | KDM1A/PAF1/PTBP1/ZCCHC8/THOC3/SNRNP40/DDX20/PHRF1/DAZAP1/FAM50A/PRKACA/MBNL3/DDX1/SF3B2/XRN2/RBM41/RBM27/ALKBH5/HNRNPC/CWF19L1/CIRBP/SNRPD3/TFIP11/SNU13/RBFOX2/ZC3H14/ACIN1/PABPN1/PNN/CSTF1/PRPF6/CSTF2/ESRP1/SNRNP70/YJU2/CASC3/C1QBP/DDX5/EFTUD2/ZPR1/HSPA8/AICDA/SRSF9/FAM172A/NCL/PAPOLG/SF3B1/SRSF7/SRSF4/PRPF3/PTBP2/PRDX6/PTBP3/NRDE2/TARDBP/COIL/SMU1/SNRPC/RNF113A/HNRNPR/RALY/RBM42/SCAF1/PUS7L/AAR2/GRSF1/PRMT7/RBM17/SRPK2/HNRNPA1/SRSF1/PRPF4/NCBP1/CMTR1/SLTM/DBR1/CIR1/SCAF11/SNRPF/DHX38/EIF4A3/APP/SF3B4/SNRPG/POLR2D/WTAP/LUC7L2/NONO/RBMX/CWC15/MBNL1/CWC27/LSM11/SCAF4/SSU72/RBM15/THOC7/RPUSD4/TRUB1/CPSF2/SNRPD1/CDK12/SRRM2/SNRNP48/AHCYL1/USP39/HNRNPH1/ZRSR2/HNRNPA3/SMN1/CLP1/LARP7/PDE12/AURKAIP1/PUS1/ERN1/NPM1/RBM10/ZFP36L1/RNPC3/UBL5/LSM2/RBM15B/SRSF8/RBM8A/SRSF1/PRPF8/RBM27/PRKACA | 129 |
| GO:0042177 | negative regulation of protein catabolic process | 40/3662 | 104/15509 | 0.00049155 | 0.00256346 | 0.00154162 | HFE/CTSA/ROCK1/SIRT2/VPS35/BAG6/HSP90AB1/USP14/N4BP1/SNRNP70/SGTA/PARK7/USP9X/PIN1/MGAT3/SERPINE2/IL10/FURIN/SMAD4/EGFR/TLK2/OGT/SNX12/EIF3H/ALAD/USP25/RYBP/SHH/RELA/NQO1/ADGRB1/ANXA2/USP7/SVIP/BAG6/BAG6/BAG6/BAG6/BAG6/F8A1 | 40 |
| GO:0001959 | regulation of cytokine-mediated signaling pathway | 49/3662 | 134/15509 | 0.000492178 | 0.00256346 | 0.00154162 | PAFAH1B1/CD74/UBE2K/PTPRC/MAVS/BIRC7/PYCARD/IL7/HPX/SH2B3/WNT5A/PADI2/TNFAIP3/ARG1/CXCR4/H2BC11/RNF113A/IRF3/PXDN/IL6/IL1RN/SLIT2/GFI1/SYK/TRIM44/FADD/NKIRAS2/TRIM56/PTPN2/PTPN11/ADIPOQ/TRAIP/IRAK1/SLIT3/CSF1/SIGIRR/SOCS1/PRKN/YTHDF3/NKIRAS1/CPNE1/NAIP/LSM14A/PTPRC/CCL5/CD24/CCL5/NAIP/NAIP | 49 |
| GO:0003158 | endothelium development | 49/3662 | 134/15509 | 0.000492178 | 0.00256346 | 0.00154162 | FOXP3/TIE1/RHOA/ROCK1/ADD1/ICAM1/PPP1R16B/TJP1/PRKD2/MET/EDF1/RAPGEF1/PDE4D/CXCR4/IL1B/ID1/KDR/BTG1/EDNRB/CCM2/RDX/ITGAX/SMAD4/RHOB/MSN/NOTCH1/ZEB1/BMP6/STC1/RBPJ/S1PR1/ZDHHC21/PLCB1/COL18A1/CSNK2B/TNF/TNF/TNF/CSNK2B/CSNK2B/TNF/TNF/CSNK2B/TNF/TNF/TNF/CSNK2B/PECAM1/TJP1 | 49 |
| GO:0022604 | regulation of cell morphogenesis | 90/3662 | 278/15509 | 0.000495719 | 0.00257974 | 0.00155141 | PAFAH1B1/SPAG9/CD44/HEXB/PKP2/RHOA/CDC42/WDR1/MARK2/ST6GAL1/PLXNA2/FBLN1/ZMPSTE24/SLC23A2/ABL1/MYH9/HCK/OLFM4/MYH14/DVL1/C1QBP/CCL2/SH3D19/MDK/CORO1C/NEDD9/BVES/DBN1/WNT5A/FN1/MPL/GNA13/PTK2B/CXCR4/OBSL1/KDR/CDC42EP1/RAC2/WASF3/EPHB2/DBNL/RDX/ACTR2/SYT2/RHOB/ARHGAP18/GNA12/MSN/GAS2/CDC42EP2/KIT/DMTN/EPB41/ARHGAP35/ITGB2/DVL3/TBC1D24/CDC42EP3/SPTA1/MELTF/EPB42/RHOH/PTK2/LIMS1/SEMA3E/FGG/FGA/CCL11/CFL1/DAG1/FZD4/SYNE3/RCC2/CALR/F2/CSF1R/CNTN2/SS18L1/FMNL1/CIB1/PRKN/BRWD1/BCL9L/SPRY4/SRC/PARVA/GPRASP3/PRKDC/CUX1/ITGB3 | 90 |
| GO:1903034 | regulation of response to wounding | 56/3662 | 158/15509 | 0.00050591 | 0.00263056 | 0.00158197 | CD9/GRN/F7/MYLK/APOH/XBP1/PDGFB/FERMT1/PLAT/PTN/SERPINE1/ACTA2/MDK/SH2B3/SMOC2/HBEGF/SERPINC1/TNFAIP3/SPP1/CXCR4/APOE/EPHB2/PDGFRA/CD36/SERPINE2/IL10/KIAA0319/THBS1/FGF2/IGF1R/ADAMTS18/ITGB1/DMTN/WNT4/PRKCD/NOS3/PRDX2/PTK2/PRKCE/FGG/FGA/HRAS/F2/F2R/RGMA/ANXA2/MTOR/TNF/TNF/TNF/TNF/TNF/TNF/TNF/TNF/PTEN | 56 |
| GO:0036475 | neuron death in response to oxidative stress | 18/3662 | 36/15509 | 0.000507952 | 0.00263455 | 0.00158437 | PARK7/NR4A3/IL10/TLR4/MEAK7/PARP1/ARL6IP5/NONO/TBC1D24/PRKN/TNF/TNF/TNF/TNF/TNF/TNF/TNF/TNF | 18 |
| GO:0045954 | positive regulation of natural killer cell mediated cytotoxicity | 18/3662 | 36/15509 | 0.000507952 | 0.00263455 | 0.00158437 | IL12B/CD160/NECTIN2/IL21/STAT5B/HLA-E/HLA-E/NCR3/HLA-E/NCR3/HLA-E/HLA-E/HLA-E/NCR3/HLA-E/NCR3/NCR3/NCR3 | 18 |
| GO:1903715 | regulation of aerobic respiration | 18/3662 | 36/15509 | 0.000507952 | 0.00263455 | 0.00158437 | RHOA/PPIF/PARK7/SLC25A23/CBFA2T3/ISCU/AK4/VCP/SLC25A33/PDE12/TNF/TNF/TNF/TNF/TNF/TNF/TNF/TNF | 18 |
| GO:0001890 | placenta development | 51/3662 | 141/15509 | 0.000514075 | 0.00266185 | 0.00160079 | PRDM1/FGFR2/DAZAP1/TMED2/HECTD1/HSP90AB1/PDGFB/BMP7/PTN/DNAJB6/CYP27B1/VDR/PPARD/MAPK14/HES1/EPAS1/ASH1L/PKD2/SPP1/LIF/SOX15/MEN1/NOTCH2/ADAM19/IL10/SOD1/CCN1/ARNT/PARP1/EGFR/NODAL/STC1/PLCD3/RBM15/CSF2/HTRA1/RBPJ/PTK2/CEBPB/BSG/LEP/FOSL1/GRB2/SETD2/PHLDA2/ZFP36L1/EPOR/WNT7B/MME/ZNF568/CEBPA | 51 |
| GO:0035148 | tube formation | 51/3662 | 141/15509 | 0.000514075 | 0.00266185 | 0.00160079 | SDCCAG8/FGFR2/PRKACA/TULP3/LRP2/TMED2/KDM2B/HECTD1/ABL1/CECR2/MTHFD1/BMP7/TSC2/SFRP1/TGFB1/DVL1/GATA3/FOLR1/NPHP3/WNT5A/MTHFD1L/SOX4/PODXL/RARA/FGF2/EGF/BBS4/NOTCH1/BCL2L11/NODAL/SKI/ARHGAP35/DVL3/WNT4/VANGL2/CASP3/SHH/SEMA4C/RARG/GLMN/SETD2/RGMA/NOG/TGM2/BRD2/TCTN1/BRD2/BRD2/BRD2/BRD2/PRKACA | 51 |
| GO:0032200 | telomere organization | 58/3662 | 165/15509 | 0.000516025 | 0.00266972 | 0.00160552 | UPF1/PARP3/RAD51/SP100/SIRT2/SMG6/SIRT6/XRCC5/ATRX/MAPKAPK5/HNRNPC/HSP90AB1/TFIP11/APEX1/NBN/DOT1L/CCNE1/EZH2/EZH1/RAD50/XRN1/INO80D/SLF2/SHLD2/POT1/DKC1/HNRNPA1/CCT7/SMARCAL1/NABP2/BRCA2/PIF1/PARP1/H3-3A/TERT/CCT2/EXOSC10/DCP2/CCNE2/AURKB/MAPK15/NOP10/USP7/SRC/DCLRE1A/SMG5/PRKDC/TEN1/RTEL1/H4C15/H4C14/H4C12/H3C6/H4C5/H4C4/H3C10/TINF2/H3C2 | 58 |
| GO:0007051 | spindle organization | 60/3662 | 172/15509 | 0.000523352 | 0.00270537 | 0.00162696 | SPAST/PARP3/RNF4/EML1/RHOA/SMC1A/MLH1/SPAG5/NDC80/PIBF1/ATRX/CHMP5/TPX2/BIRC5/NUDC/KIF4A/MYH9/MYBL2/CHMP4B/RAB11A/ARHGEF10/BCCIP/SMC3/FBXO5/CDC20/STMN1/PTPA/SBDS/AUNIP/CHMP1A/CCNB1/PSRC1/CDCA8/BORA/NUMA1/KIF23/HAUS2/CENPE/CSNK1D/PLK2/SPC25/PCNT/MAP9/VCP/MAPRE2/GOLGA2/RGS14/CHMP6/AURKB/MAPK15/CEP63/CHEK2/DRG1/TUBB/CCDC69/HAUS3/KIFC1/LSM14A/TBCE/SPICE1 | 60 |
| GO:0032434 | regulation of proteasomal ubiquitin-dependent protein catabolic process | 48/3662 | 131/15509 | 0.000530049 | 0.0027377 | 0.00164641 | HFE/RNF14/UFL1/HERPUD1/SIRT2/MKRN2/SIRT6/UBE2K/GSK3B/XPO1/HECTD1/BAG6/HSP90AB1/USP14/SMAD7/N4BP1/AXIN1/SGTA/GSK3A/DVL1/USP5/PARK7/CDC20/RAD23B/CLU/USP9X/CBFA2T3/HSPBP1/CSNK1D/GNA12/TLK2/OGT/EIF3H/RNF144A/RYBP/RCHY1/SHH/VCP/GLMN/PRKN/USP7/SVIP/BAG6/BAG6/BAG6/BAG6/BAG6/CEBPA | 48 |
| GO:0006620 | post-translational protein targeting to endoplasmic reticulum membrane | 12/3662 | 20/15509 | 0.000532029 | 0.0027388 | 0.00164707 | HSPA5/SEC61A1/SEC61A2/BAG6/CHMP4B/UBL4A/SGTA/BAG6/BAG6/BAG6/BAG6/BAG6 | 12 |
| GO:0046325 | negative regulation of glucose import | 12/3662 | 20/15509 | 0.000532029 | 0.0027388 | 0.00164707 | SIRT6/GSK3A/PEA15/LEP/TNF/TNF/TNF/TNF/TNF/TNF/TNF/TNF | 12 |
| GO:0060444 | branching involved in mammary gland duct morphogenesis | 12/3662 | 20/15509 | 0.000532029 | 0.0027388 | 0.00164707 | PGR/ESR1/AREG/VDR/WNT5A/KDM5B/EPHA2/WNT4/BTRC/CCL11/CSF1/SRC | 12 |
| GO:0150078 | positive regulation of neuroinflammatory response | 12/3662 | 20/15509 | 0.000532029 | 0.0027388 | 0.00164707 | CTSC/IL1B/IL6/IL18/TNF/TNF/TNF/TNF/TNF/TNF/TNF/TNF | 12 |
| GO:0022613 | ribonucleoprotein complex biogenesis | 122/3662 | 396/15509 | 0.000543155 | 0.00279375 | 0.00168011 | TSR3/UTP18/RPL26L1/NOP16/EIF4B/DDX20/RRP15/BUD23/XRCC5/DDX1/XPO1/SF3B2/DDX18/XRN2/RPL6/AGO1/HSP90AB1/SNRPD3/PES1/SNU13/PRPF6/NOP56/RIOK3/PIN4/EIF3J/ERCC2/FBL/YJU2/DDX49/EIF3B/EIF4H/EXOSC3/EIF3A/C1QBP/NOP2/SRSF9/BRIX1/KAT2B/RRP9/SF3B1/PRPF3/EBNA1BP2/NSUN4/PTBP2/UTP20/COIL/SNRPC/EIF2S2/SBDS/DKC1/NOL11/AAR2/MYBBP1A/UTP3/ERAL1/PRMT7/SRPK2/LTV1/GLUL/MRPL44/SRSF1/NCBP1/SCAF11/SNRPF/TARBP2/CUL4A/PELP1/EIF4A3/METTL25B/ISG20L2/SF3B4/SNRPG/POLR2D/ABT1/RPL7L1/LUC7L2/RBMX/EIF3H/EIF3M/DHX37/HEATR3/CUL4B/TSR2/RPL26/NOL9/NSA2/DCAF13/RPL10L/RPUSD4/SNRPD1/USP39/ZRSR2/NMD3/MRPL1/PA2G4/RIOX2/MRPL36/EXOSC10/SMN1/CLP1/TRMT112/IMP3/NPM1/NOP10/RPS17/EIF3C/TRMT2B/NOC2L/RRP7A/RPL23A/SDAD1/RPL10A/LSM2/PWP2/EIF6/PRKDC/BOP1/SRSF1/PRPF8/AATF/PTEN/EMG1 | 122 |
| GO:0030900 | forebrain development | 109/3662 | 348/15509 | 0.00054361 | 0.00279378 | 0.00168013 | BAD/KDM1A/PAFAH1B1/TYROBP/UBA6/CDH1/PHLPP2/SYNE2/ATP2B4/FGFR2/RHOA/PITX1/NDST1/CSNK2A2/NDE1/GLI2/NOTCH3/PCM1/LRP2/GSK3B/ATRX/BAX/XRN2/KDM2B/RPGRIP1L/EZH2/AKNA/CXCL12/BMPR1A/DKK1/ZMIZ1/EZH1/MDK/WNT5A/HES1/ID2/HDAC1/SLC2A1/NRP2/CXCR4/INHBA/BMP2/BCL11B/TWSG1/ALDH1A2/RARA/EPHB2/KRAS/AKIRIN2/NKX2-1/ATAT1/FGF2/IGF1R/BBS4/APP/SLIT2/EPHA5/EGFR/NTRK2/NOTCH1/ZEB1/POU4F1/NR4A2/SKI/GART/BTG2/ARHGAP35/WNT4/ARPC5/DISC1/INHBB/PITX2/CASP3/SHH/CDK5/TTC8/FRS2/RBPJ/ARL13B/ITGAM/SEMA3E/CDH2/ALK/CNP/CDK5R1/SSTR2/OXTR/SETD2/CSF1R/EPHB3/PLCB1/SLC8A1/NOG/CNTN2/POU3F2/NF2/SECISBP2/WNT7B/H2AX/PAX5/PGAP1/SRC/TCTN1/CCDC85C/SHANK3/B2M/NDE1/NEFL/PTEN | 109 |
| GO:0002455 | humoral immune response mediated by circulating immunoglobulin | 28/3662 | 66/15509 | 0.000548865 | 0.00281611 | 0.00169356 | FCGR2B/PTPRC/FCER2/C1QBP/HPX/CD81/CLU/C3/FOXJ1/MBL2/NOD2/ZP3/CD55/CR1/TNF/TNF/LTA/TNF/LTA/TNF/TNF/TNF/TNF/LTA/LTA/TNF/LTA/PTPRC | 28 |
| GO:0010822 | positive regulation of mitochondrion organization | 28/3662 | 66/15509 | 0.000548865 | 0.00281611 | 0.00169356 | BAD/DCN/ZDHHC6/BAK1/VPS35/GSK3B/BAX/DNM1L/GZMB/MMP9/PYCARD/PDCD5/GSK3A/MAPK8/PPIF/PARK7/TNFSF10/KDR/HRK/NMT1/PMAIP1/BCL2L11/GPER1/MFF/MIEF2/PRKN/FIS1/PGAM5 | 28 |
| GO:0046822 | regulation of nucleocytoplasmic transport | 38/3662 | 98/15509 | 0.000558207 | 0.00286168 | 0.00172096 | CDH1/IPO5/SP100/HYAL2/PRKACA/SIRT6/GSK3B/XPO1/MAVS/HSP90AB1/RANGAP1/FERMT1/TGFB1/ZPR1/IFNG/MAPK14/PARK7/NRDE2/TARDBP/NUP153/IL1B/XPO4/CD36/MDFIC/ANP32B/PIK3R1/TCF7L2/BAG3/PRKCD/SHH/CDK5/CHP2/PKIG/CDK1/LEP/PTPN11/SETD2/PRKACA | 38 |
| GO:0010639 | negative regulation of organelle organization | 101/3662 | 319/15509 | 0.000564728 | 0.00288933 | 0.00173759 | SCIN/BAZ1B/IGF1/HGF/BAK1/PHF23/NAV3/SPTB/SMG6/ADD2/NDC80/ATRX/ZW10/ADD1/TPX2/BIRC5/HNRNPC/TMEM14A/BMP7/CHMP4B/TSC2/NUBP1/TJP1/NBN/MTPN/MET/PPIF/FBXO5/RAD50/XRN1/KAT2B/CAPZA1/CDC20/STMN1/CLU/TEX14/IAPP/EML2/BECN1/STYXL1/LIF/POT1/BCL2L2/PPFIA1/TOP2A/CCNB1/CDCA8/APC/HNRNPA1/RDX/PIF1/BBS4/ARRB2/TBCD/SMAD4/PARP1/SLIT2/PIK3R1/GSN/SPC25/PLEKHH2/SMARCA5/DMTN/SPTBN4/LMNA/OMA1/H3-3A/SPTA1/PRKCD/FXN/PRELID1/BUB1/TRIAP1/S1PR1/BCL2L1/EXOSC10/DCP2/SPTBN2/ZWILCH/AURKAIP1/TMEM39A/FLII/AURKB/PAK2/NPM1/CIB1/INPP5J/CDK10/PRKN/FZD9/GMFB/SRC/SPTAN1/IQANK1/TMSB4X/TWF2/SHANK3/TEN1/RTEL1/TJP1/TINF2 | 101 |
| GO:0032720 | negative regulation of tumor necrosis factor production | 27/3662 | 63/15509 | 0.000564999 | 0.00288933 | 0.00173759 | IGF1/FOXP3/ARG2/ACP5/LILRB1/IL27RA/CD33/IL4/TNFAIP3/RARA/SYT11/PTPN22/IL10/TLR4/ARRB2/NOD2/LGALS9/ADIPOQ/LILRB4/ORM1/LILRB1/LILRB4/LILRB1/LILRB1/LILRB1/LILRB4/LILRB4 | 27 |
| GO:0070918 | small regulatory ncRNA processing | 27/3662 | 63/15509 | 0.000564999 | 0.00288933 | 0.00173759 | PUM2/TUT7/ZMPSTE24/ESR1/AGO1/ZC3H7B/TGFB1/DDX5/ZC3H7A/MYCN/IL6/NCBP1/TARBP2/EGFR/PUS10/TERT/TRUB1/SMAD2/SPOUT1/TNF/TNF/TNF/TNF/TNF/TNF/TNF/TNF | 27 |
| GO:0045429 | positive regulation of nitric oxide biosynthetic process | 20/3662 | 42/15509 | 0.000568434 | 0.00289971 | 0.00174384 | HSP90AB1/IFNG/PKD2/CLU/PTK2B/IL1B/ASS1/CD36/TLR4/DDAH1/TRPV1/TNF/TNF/TNF/TNF/TNF/TNF/TNF/TNF/HBB | 20 |
| GO:0055010 | ventricular cardiac muscle tissue morphogenesis | 20/3662 | 42/15509 | 0.000568434 | 0.00289971 | 0.00174384 | PKP2/FGFR2/LRP2/FKBP1A/DSP/SMAD7/TGFB1/TGFBR1/ENG/BMPR1A/TNNT2/TNNI3/SMAD4/NOTCH1/POU4F1/TNNI1/RBPJ/ZFPM2/NKX2-5/NOG | 20 |
| GO:2000403 | positive regulation of lymphocyte migration | 20/3662 | 42/15509 | 0.000568434 | 0.00289971 | 0.00174384 | RHOA/ABL1/PYCARD/CXCL12/NEDD9/WNT5A/CCL20/ITGA4/PTK2B/CCL21/APP/ABL2/CXCL13/FADD/ITGB3/CCL5/CCL5/CCL4/CCL4/CCL4 | 20 |
| GO:0044409 | entry into host | 52/3662 | 145/15509 | 0.000574857 | 0.00293007 | 0.00176209 | CD4/CD74/HYAL2/MID2/ICAM1/KPNA3/SLC1A5/TRIM14/EFNB3/CD81/CD86/VAMP8/TRIM25/CD80/CXCR4/NUP153/NECTIN2/TRIM5/TRIM22/ITGAV/SLC7A1/FURIN/EPHA2/EGFR/GSN/NCAM1/ITGB1/CCR5/ANPEP/TRIM68/SLC3A2/LGALS9/CXCL8/GYPA/CDK1/TRIM8/BSG/DAG1/CIITA/EXOC7/SLC52A2/IFITM1/PLSCR1/HMGB1/CD55/SRC/DPP4/WWP2/CR1/TRIM26/ITGB3/ITCH | 52 |
| GO:0002407 | dendritic cell chemotaxis | 15/3662 | 28/15509 | 0.000581488 | 0.00294449 | 0.00177077 | SPI1/PIK3CG/C1QBP/CXCR4/CCR7/CCL21/CCR5/CXCR1/LGALS9/CCL19/CALR/CXCR2/HMGB1/CCL5/CCL5 | 15 |
| GO:0060149 | negative regulation of post-transcriptional gene silencing | 15/3662 | 28/15509 | 0.000581488 | 0.00294449 | 0.00177077 | ELAVL1/ZMPSTE24/ESR1/TGFB1/IL6/TERT/TNF/TNF/TNF/TNF/TNF/TNF/TNF/TNF/NEAT1 | 15 |
| GO:0060603 | mammary gland duct morphogenesis | 15/3662 | 28/15509 | 0.000581488 | 0.00294449 | 0.00177077 | NTN1/FGFR2/PGR/ESR1/AREG/VDR/WNT5A/KDM5B/EPHA2/WNT4/BTRC/CCL11/CSF1R/CSF1/SRC | 15 |
| GO:0060965 | negative regulation of miRNA-mediated gene silencing | 15/3662 | 28/15509 | 0.000581488 | 0.00294449 | 0.00177077 | ELAVL1/ZMPSTE24/ESR1/TGFB1/IL6/TERT/TNF/TNF/TNF/TNF/TNF/TNF/TNF/TNF/NEAT1 | 15 |
| GO:0060967 | negative regulation of gene silencing by RNA | 15/3662 | 28/15509 | 0.000581488 | 0.00294449 | 0.00177077 | ELAVL1/ZMPSTE24/ESR1/TGFB1/IL6/TERT/TNF/TNF/TNF/TNF/TNF/TNF/TNF/TNF/NEAT1 | 15 |
| GO:0071353 | cellular response to interleukin-4 | 15/3662 | 28/15509 | 0.000581488 | 0.00294449 | 0.00177077 | HSPA5/IL4R/HSP90AB1/XBP1/JAK3/GATA3/ARG1/TUBA1B/IL2RG/ALAD/ADAMTS13/IL24/PTPN2/SHPK/ADAMTS13 | 15 |
| GO:0072576 | liver morphogenesis | 15/3662 | 28/15509 | 0.000581488 | 0.00294449 | 0.00177077 | XBP1/PTN/MDK/TNFAIP3/NOTCH2/IL6/CEBPB/TNF/TNF/TNF/TNF/TNF/TNF/TNF/TNF | 15 |
| GO:1900369 | negative regulation of post-transcriptional gene silencing by RNA | 15/3662 | 28/15509 | 0.000581488 | 0.00294449 | 0.00177077 | ELAVL1/ZMPSTE24/ESR1/TGFB1/IL6/TERT/TNF/TNF/TNF/TNF/TNF/TNF/TNF/TNF/NEAT1 | 15 |
| GO:0048013 | ephrin receptor signaling pathway | 22/3662 | 48/15509 | 0.00059533 | 0.00300232 | 0.00180555 | EPHA3/EPHA8/EPHA6/MMP2/MMP9/EFNB3/CHN1/EPHB2/EPHA2/EPHA5/RBPJ/EFNA1/PTK2/CDK5R1/PTPN11/EPHB3/ANKS1B/SRC/SIPA1L1/NTRK1/EFNA4/EPHB6 | 22 |
| GO:0050691 | regulation of defense response to virus by host | 22/3662 | 48/15509 | 0.00059533 | 0.00300232 | 0.00180555 | MAVS/IL12RB1/PYCARD/LILRB1/IL12B/IL4/STAT1/TNFAIP3/IL1B/PTPN22/TARBP2/TRIM44/MICB/MICB/MICB/MICB/MICB/MICB/LILRB1/LILRB1/LILRB1/LILRB1 | 22 |
| GO:1900368 | regulation of post-transcriptional gene silencing by RNA | 22/3662 | 48/15509 | 0.00059533 | 0.00300232 | 0.00180555 | PUM2/ELAVL1/ZMPSTE24/ESR1/TGFB1/DDX5/ZFP36/AJUBA/MYCN/IL6/EGFR/TERT/TRUB1/TNF/TNF/TNF/TNF/TNF/TNF/TNF/TNF/NEAT1 | 22 |
| GO:1903747 | regulation of establishment of protein localization to mitochondrion | 22/3662 | 48/15509 | 0.00059533 | 0.00300232 | 0.00180555 | CSNK2A2/LMAN1/SH3GLB1/GZMB/PDCD5/GSK3A/MAPK8/RAC2/PRKAA1/NMT1/SAE1/BAG3/BAP1/ATG13/PRKN/UBE2L3/UBL5/HSPA1L/HSPA1L/HSPA1L/HSPA1L/HSPA1L | 22 |
| GO:1905953 | negative regulation of lipid localization | 22/3662 | 48/15509 | 0.00059533 | 0.00300232 | 0.00180555 | CRY1/NFKBIA/PPARD/CRY2/IL6/THBS1/ITGAV/EGF/SHH/LEP/PTPN2/PTPN11/TNF/TNF/FIS1/TNF/TNF/TNF/TNF/TNF/TNF/ITGB3 | 22 |
| GO:0061028 | establishment of endothelial barrier | 24/3662 | 54/15509 | 0.000596291 | 0.00300473 | 0.00180699 | FOXP3/ROCK1/ADD1/ICAM1/PPP1R16B/TJP1/RAPGEF1/PDE4D/IL1B/EDNRB/RDX/MSN/ZDHHC21/PLCB1/TNF/TNF/TNF/TNF/TNF/TNF/TNF/TNF/PECAM1/TJP1 | 24 |
| GO:0007160 | cell-matrix adhesion | 70/3662 | 208/15509 | 0.000612272 | 0.00308275 | 0.00185391 | ITGAL/ITGA3/ITGA2B/CD44/EPHA3/RHOA/ROCK1/ACTN2/ITGA8/GSK3B/CEACAM6/NID2/PXN/ABL1/FERMT1/MSLN/SFRP1/SERPINE1/CORO1C/BCL6/ITGA4/FN1/TEK/PTK2B/CCR7/RRAS/KDR/HOXD3/AJUBA/PPFIA1/TIMM10B/CD36/CCL21/TMEM8B/THBS1/ITGA11/ITGAV/ITGAX/PIK3R1/ITGB1/BCL2L11/CD96/MMP14/DMTN/ITGB2/ADAMTS13/WNT4/VCAM1/SNED1/DISC1/CDK5/ADAM9/PTK2/PLEKHA2/LIMS1/ITGAM/SEMA3E/FGG/FGA/DAG1/RCC2/CSF1/CIB1/NF2/BCAM/SRC/COL13A1/ITGB3/ADAMTS13/PTEN | 70 |
| GO:0070301 | cellular response to hydrogen peroxide | 32/3662 | 79/15509 | 0.000613802 | 0.0030853 | 0.00185544 | HGF/ABL1/APEX1/MET/EZH2/PPIF/PARK7/TNFAIP3/ARG1/FOXO3/NR4A3/CAT/BECN1/TRAP1/PRKAA1/IL6/IL10/IL18BP/CYP1B1/RHOB/FABP1/PRKCD/FXN/CDK1/RELA/ERN1/NQO1/SRC/MAP3K5/ZNF277/ZNF580/PCGF2 | 32 |
| GO:1901983 | regulation of protein acetylation | 32/3662 | 79/15509 | 0.000613802 | 0.0030853 | 0.00185544 | NFYA/KMT2E/BAZ1B/SNAI2/FOXP3/NFYC/SPI1/GSK3B/ZMPSTE24/SMARCB1/GATA3/ZNF451/SF3B1/PARK7/SOX4/DEK/LIF/PRKAA1/MYBBP1A/WBP2/SMAD4/SMARCA5/CTBP1/PYGO2/BRD7/SETD5/KAT5/TAF7/MUC1/NOC2L/SMARCB1/TADA2A | 32 |
| GO:1903900 | regulation of viral life cycle | 46/3662 | 125/15509 | 0.000614272 | 0.0030853 | 0.00185544 | CD4/LTF/CD74/EIF2AK2/MID2/MAVS/N4BP1/TRIM14/AICDA/NR5A2/TRIM25/STAU1/NECTIN2/TOP2A/TRIM5/TRIM22/SRPK2/TARBP2/FURIN/GSN/NOTCH1/HMGA2/TRIM68/LGALS9/CXCL8/TRIM8/PDE12/BANF1/TMEM39A/CD28/CIITA/IFITM1/PLSCR1/HMGB1/PPIA/TNF/TNF/TNF/TNF/TNF/TNF/TNF/TNF/TRIM26/CCL5/CCL5 | 46 |
| GO:0071774 | response to fibroblast growth factor | 40/3662 | 105/15509 | 0.000615393 | 0.00308843 | 0.00185733 | CPS1/CD44/CASR/NGFR/FGFR2/HYAL2/FGFR3/NDST1/FGFR1/SFRP1/PRKD2/GATA3/SHOC2/CCL2/SMOC2/WNT5A/GALNT3/KDM5B/NR4A1/RUNX2/FLRT3/ELK1/ZFP36/SPRY2/THBS1/FGF2/ZFP36L2/CXCL13/WNT4/CEP57/FRS2/CXCL8/FAM20C/GRB2/PTPN11/NOG/ZFP36L1/SPRY4/CCL5/CCL5 | 40 |
| GO:0050728 | negative regulation of inflammatory response | 51/3662 | 142/15509 | 0.000620774 | 0.00311291 | 0.00187205 | IGF1/HGF/TNFRSF1B/GRN/FOXP3/VPS35/FCGR2B/MKRN2/PTPRC/HCK/ACP5/MEFV/HAMP/GATA3/MDK/MVK/PPARD/MAPK14/IL12B/IL4/ASH1L/TNFAIP3/TEK/NR1D1/ZFP36/APOE/NDFIP1/SYT11/IL2RA/NT5E/IL10/CCN3/CYP19A1/RB1/FURIN/SOD1/DUSP10/PLK2/PSMB4/NLRX1/PRKCD/GPER1/SYK/NOD2/PTPN2/ADIPOQ/CNR2/SRC/ELANE/PTPRC/ELANE | 51 |
| GO:0010810 | regulation of cell-substrate adhesion | 66/3662 | 194/15509 | 0.000621727 | 0.00311517 | 0.00187341 | ITGA3/EPHA3/PKP2/ATXN3/RHOA/ROCK1/CDC42/ST6GAL1/FBLN1/GSK3B/CEACAM6/ANGPT2/ABL1/PDGFB/FERMT1/OLFM4/SFRP1/SERPINE1/C1QBP/MDK/CORO1C/NEDD9/BCL6/FN1/TEK/PTK2B/CCR7/RRAS/KDR/RAC2/MEN1/CD36/CCL21/THBS1/TBCD/CCN1/PIK3R1/NOTCH1/ABI3BP/MMP14/DMTN/COL26A1/ALOX15/WNT4/DISC1/MELTF/EDIL3/EGFLAM/PTK2/PLEKHA2/LIMS1/SEMA3E/PRKCE/FGG/FGA/DAG1/FZD4/RCC2/CALR/CSF1/CIB1/NF2/SPRY4/SRC/ITGB3/PTEN | 66 |
| GO:0002461 | tolerance induction dependent upon immune response | 9/3662 | 13/15509 | 0.000626659 | 0.00312976 | 0.00188218 | FOXP3/HLA-G/HLA-G/HLA-G/HLA-G/HLA-G/HLA-G/HLA-G/HLA-G | 9 |
| GO:0070317 | negative regulation of G0 to G1 transition | 9/3662 | 13/15509 | 0.000626659 | 0.00312976 | 0.00188218 | FOXO4/HLA-G/HLA-G/HLA-G/HLA-G/HLA-G/HLA-G/HLA-G/HLA-G | 9 |
| GO:1901668 | regulation of superoxide dismutase activity | 9/3662 | 13/15509 | 0.000626659 | 0.00312976 | 0.00188218 | PARK7/TNF/TNF/TNF/TNF/TNF/TNF/TNF/TNF | 9 |
| GO:2001270 | regulation of cysteine-type endopeptidase activity involved in execution phase of apoptosis | 9/3662 | 13/15509 | 0.000626659 | 0.00312976 | 0.00188218 | PAK2/TNF/TNF/TNF/TNF/TNF/TNF/TNF/TNF | 9 |
| GO:0035115 | embryonic forelimb morphogenesis | 16/3662 | 31/15509 | 0.000660517 | 0.00329061 | 0.00197891 | HOXA11/ALX4/TP63/HOXA9/RPGRIP1L/WNT3/RECK/RUNX2/HOXD9/ALDH1A2/TFAP2A/CRABP2/SHH/ZNF358/WNT3/WNT3 | 16 |
| GO:0060563 | neuroepithelial cell differentiation | 16/3662 | 31/15509 | 0.000660517 | 0.00329061 | 0.00197891 | ABL1/SERPINE1/BCCIP/HES1/SOX4/NKX2-2/BMP2/FGF2/NOTCH1/NODAL/WNT4/CDH2/CEBPB/FAM20C/POU3F2/TUBB | 16 |
| GO:1902993 | positive regulation of amyloid precursor protein catabolic process | 16/3662 | 31/15509 | 0.000660517 | 0.00329061 | 0.00197891 | PICALM/GSK3A/IFNG/CLU/SLC2A13/CASP3/EFNA1/RELA/TNF/TNF/TNF/TNF/TNF/TNF/TNF/TNF | 16 |
| GO:0001704 | formation of primary germ layer | 45/3662 | 122/15509 | 0.000660988 | 0.00329061 | 0.00197891 | HOXA11/ITGA3/PAF1/LAMA3/FGFR2/PRKACA/ITGA8/MMP2/MMP9/BMP7/AXIN1/EYA1/GPI/BMPR1A/DKK1/WNT3/MACROH2A1/WNT5A/ITGA4/FN1/INHBA/TWSG1/COL5A1/DUSP5/ITGAV/ARMC5/EPHA2/HMGA2/ITGB1/GJA1/NODAL/MMP14/DUSP2/ITGB2/SMAD2/GRB2/SETD2/NOG/NF2/TXNRD1/ITGB3/WNT3/WNT3/GPI/PRKACA | 45 |
| GO:0051851 | modulation by host of symbiont process | 30/3662 | 73/15509 | 0.000674575 | 0.00335555 | 0.00201797 | LTF/YTHDC2/CDC42/CCNK/SMARCB1/VAPA/HSPA8/HDAC1/TARDBP/APOE/SFTPD/HMGA2/EEF1A1/SAP30/PSMC3/CX3CR1/PAIP1/CFL1/JUN/CSF1R/PRKN/CARD9/IGF2R/ZBED1/CCL5/CCL5/CCL4/CCL4/SMARCB1/CCL4 | 30 |
| GO:0032516 | positive regulation of phosphoprotein phosphatase activity | 13/3662 | 23/15509 | 0.000689849 | 0.00341508 | 0.00205377 | PTPRC/PPP1R15A/HSP90AB1/CD33/PDGFRB/PTPA/CALM2/GNA12/PPP1R15B/CALM3/MAGI2/MTOR/PTPRC | 13 |
| GO:0034138 | toll-like receptor 3 signaling pathway | 13/3662 | 23/15509 | 0.000689849 | 0.00341508 | 0.00205377 | WDFY1/TNFAIP3/PTPN22/TLR3/TNIP2/TNF/TNF/TNF/TNF/TNF/TNF/TNF/TNF | 13 |
| GO:0036296 | response to increased oxygen levels | 13/3662 | 23/15509 | 0.000689849 | 0.00341508 | 0.00205377 | NOX1/FAS/ATP6AP1/MMP2/PDGFRB/ATP6V1A/CAT/EPO/ATP6V1G1/CYP1A1/FOXO1/ATG7/TMEM199 | 13 |
| GO:0060740 | prostate gland epithelium morphogenesis | 13/3662 | 23/15509 | 0.000689849 | 0.00341508 | 0.00205377 | FGFR2/TP63/MMP2/ESR1/BMP7/SFRP1/WNT5A/NOTCH1/SHH/FRS2/CYP7B1/RARG/NOG | 13 |
| GO:0070989 | oxidative demethylation | 13/3662 | 23/15509 | 0.000689849 | 0.00341508 | 0.00205377 | ALKBH5/CYP2D6/CYP3A5/TET1/TDG/CYP1A2/CYP3A4/TET3/CYP2D6/CYP2D6/CYP2D6/CYP2D6/CYP2D6 | 13 |
| GO:2000010 | positive regulation of protein localization to cell surface | 13/3662 | 23/15509 | 0.000689849 | 0.00341508 | 0.00205377 | TYROBP/HSP90AB1/RANGRF/TMEM35A/RIC3/TNF/TNF/TNF/TNF/TNF/TNF/TNF/TNF | 13 |
| GO:0055076 | transition metal ion homeostasis | 47/3662 | 129/15509 | 0.000695129 | 0.00343847 | 0.00206784 | HFE/LTF/SLC11A1/AP3D1/HYAL2/ATP6AP1/PICALM/SLC46A1/FTL/SLC22A17/NUBP1/SLC39A14/HAMP/TFR2/HPX/SLC11A2/IFNG/RHAG/ATP6V1A/SLC30A3/EPAS1/FBXL5/NDFIP1/AP3B1/ISCU/IREB2/ATP6V1G1/SMAD4/SOD1/APP/SLC25A37/LCN2/BMP6/STEAP2/ALAS2/CYB561A3/SLC30A7/MELTF/FXN/EPB42/FTH1/ERFE/BTBD9/PRKN/TMPRSS6/TMEM199/B2M | 47 |
| GO:0003281 | ventricular septum development | 29/3662 | 70/15509 | 0.000704272 | 0.00347815 | 0.0020917 | PRDM1/FGFR2/LRP2/HECTD1/SMAD7/NPRL3/TGFBR1/GATA3/BMPR1A/NSD2/WNT5A/HES1/SOX4/SMAD6/SMAD4/CCN1/SLIT2/NOTCH1/RBM15/TGFBR2/HEYL/NOS3/FRS2/DCTN5/RBPJ/ZFPM2/NKX2-5/NOG/SLIT3 | 29 |
| GO:0006289 | nucleotide-excision repair | 29/3662 | 70/15509 | 0.000704272 | 0.00347815 | 0.0020917 | ARID1B/NTHL1/ATXN3/ACTB/BCL7C/SMARCB1/ERCC2/POLR2I/SMARCD2/GTF2H1/BCL7A/ARID1A/RAD23B/USP45/DDB2/XPA/BRCA2/CUL4A/XPC/FANCC/ERCC3/UVSSA/BRD7/KAT5/LIG4/USP7/ARID2/SMARCB1/FAN1 | 29 |
| GO:0051783 | regulation of nuclear division | 49/3662 | 136/15509 | 0.000723637 | 0.00357012 | 0.00214701 | CDC27/IGF1/SIRT2/CDC42/NDC80/ZW10/ANAPC5/BIRC5/PDGFB/BMP7/FBXO5/CUL9/PDGFRB/WNT5A/IL1A/CDC20/TEX14/OBSL1/IL1B/PIN1/PKMYT1/LIF/CCNB1/CDCA8/APC/BORA/NUSAP1/EGF/RB1/MKI67/SPC25/WNT4/BUB1/PDE3A/ZWILCH/AURKAIP1/CD28/AURKB/CALR/PLCB1/TNF/TNF/TNF/TNF/TNF/TNF/TNF/TNF/PDXP | 49 |
| GO:0046685 | response to arsenic-containing substance | 17/3662 | 34/15509 | 0.000724047 | 0.00357012 | 0.00214701 | RNF4/MKNK2/PPIF/HNRNPA1/CYP1B1/CYP1A1/ALAD/GSTO1/ATF3/TNFRSF11B/VCP/DAXX/DAXX/DAXX/DAXX/DAXX/NEFL | 17 |
| GO:0008154 | actin polymerization or depolymerization | 62/3662 | 181/15509 | 0.000732351 | 0.00360533 | 0.00216818 | SCIN/TTC17/CYFIP2/RHOA/SPTB/WDR1/ADD2/ACTN2/ADD1/ABL1/HCK/COTL1/PYCARD/MTPN/CXCL12/CSF3/ARPC3/DBN1/WIPF1/CAPZA1/PTK2B/DSTN/CCR7/CDC42EP1/ARPC1B/WASF3/MICAL1/DBNL/CCL21/RDX/ABI2/DIAPH3/BBS4/SLIT2/ARHGAP18/GSN/CDC42EP2/PLEKHH2/DMTN/ARHGAP35/SPTBN4/ALOX15/ARPC5/CDC42EP3/SPTA1/PRKCD/RICTOR/PRKCE/CCL11/CFL1/SPTBN2/FLII/GRB2/SPTAN1/MSRB1/MTOR/IQANK1/TMSB4X/PDXP/ARPC1A/TWF2/BRK1 | 62 |
| GO:0071897 | DNA biosynthetic process | 62/3662 | 181/15509 | 0.000732351 | 0.00360533 | 0.00216818 | HGF/PARP3/SMG6/XRCC5/NOX4/MAPKAPK5/HNRNPC/HSP90AB1/PDGFB/GINS1/POLA1/JADE3/CHRAC1/PRKD2/LIG1/DNTT/SMOC2/RAD50/PDGFRB/XRN1/POLE4/PTK2B/POLM/CDKN1A/POT1/DKC1/MEN1/HNRNPA1/CCT7/CYP1B1/FGF2/PIF1/ARRB2/DTL/FAAP20/RCHY1/TERT/VCP/CCT2/TK2/RRM1/EXOSC10/DCP2/LIG4/TYMS/AURKB/MAPK15/ADIPOQ/NOP10/SRC/TFDP1/SMG5/TNF/TNF/TNF/TNF/TNF/TNF/TNF/TNF/TEN1/TINF2 | 62 |
| GO:0032495 | response to muramyl dipeptide | 11/3662 | 18/15509 | 0.0007373 | 0.00361248 | 0.00217248 | CHMP5/NFKBIA/NOD1/MAPK14/TNFAIP3/IRF5/PTPN22/NOTCH1/NOD2/RELA/CARD9 | 11 |
| GO:0032621 | interleukin-18 production | 11/3662 | 18/15509 | 0.0007373 | 0.00361248 | 0.00217248 | IL10/GBP5/NOD2/TNF/TNF/TNF/TNF/TNF/TNF/TNF/TNF | 11 |
| GO:0032661 | regulation of interleukin-18 production | 11/3662 | 18/15509 | 0.0007373 | 0.00361248 | 0.00217248 | IL10/GBP5/NOD2/TNF/TNF/TNF/TNF/TNF/TNF/TNF/TNF | 11 |
| GO:0036344 | platelet morphogenesis | 11/3662 | 18/15509 | 0.0007373 | 0.00361248 | 0.00217248 | WDR1/MYH9/GATA1/MPL/ZNF385A/BAP1/CASP3/C1GALT1C1/PTPN11/CIB1/PRKDC | 11 |
| GO:0051770 | positive regulation of nitric-oxide synthase biosynthetic process | 11/3662 | 18/15509 | 0.0007373 | 0.00361248 | 0.00217248 | MAP2K4/FCER2/JAK3/CCL2/MAP2K6/IFNG/STAT1/KDR/AKAP12/TLR4/NOD2 | 11 |
| GO:0051956 | negative regulation of amino acid transport | 11/3662 | 18/15509 | 0.0007373 | 0.00361248 | 0.00217248 | ARL6IP5/SLC43A2/LEP/TNF/TNF/TNF/TNF/TNF/TNF/TNF/TNF | 11 |
| GO:0060389 | pathway-restricted SMAD protein phosphorylation | 27/3662 | 64/15509 | 0.000759888 | 0.00372021 | 0.00223727 | HFE/BMP7/SMAD7/TGFB1/TGFBR1/ENG/BMPR1A/DKK1/INHBA/LRP1/BMP2/PIN1/TWSG1/GDF15/SMAD6/SMAD4/BMP6/NODAL/INHBB/TGFBR2/GDF9/NOG/CSNK2B/CSNK2B/CSNK2B/CSNK2B/CSNK2B | 27 |
| GO:0090150 | establishment of protein localization to membrane | 78/3662 | 238/15509 | 0.000760987 | 0.00372265 | 0.00223874 | AGK/ZDHHC6/HSPA5/SEC61A1/SEC61A2/VPS35/ATP6AP1/NSF/RAB10/BAX/BAG6/TIMM13/MICALL1/SAMM50/GZMB/TIMM9/ARFRP1/CHMP4B/UBL4A/CSK/RAB11A/SGTA/PDCD5/MAPK8/CCDC47/KRT18/ARL6/ACSL3/EMC3/PHAF1/RAB3IP/EMC4/TIMM10B/REEP2/AP3B1/ZDHHC4/NMT1/KIF13A/RDX/PREPL/SRP14/SRPRB/EGFR/PARD3/TIMM8B/ZFAND2B/DMTN/CALM3/ITGB2/ZDHHC12/EMC10/PEX19/ZDHHC3/CDK5/AMN/SRP68/MFF/ITGAM/TOMM20/HRAS/PDZK1/TOMM5/ZDHHC21/SYNE3/CDK5R1/MIEF2/CIB1/CLN3/NACA/GDI1/ZDHHC18/BAG6/FIS1/BAG6/BAG6/BAG6/BAG6/CD24 | 78 |
| GO:1990000 | amyloid fibril formation | 18/3662 | 37/15509 | 0.000772485 | 0.00377592 | 0.00227077 | FKBP1A/FUS/CRYAB/PFDN1/CLU/TARDBP/IAPP/PFDN5/USP9X/APOE/CD36/HNRNPA1/FURIN/APP/GSN/PRKN/PFDN6/B2M | 18 |
| GO:0090307 | mitotic spindle assembly | 26/3662 | 61/15509 | 0.000784555 | 0.00381549 | 0.00229457 | RHOA/SMC1A/PIBF1/CHMP5/TPX2/BIRC5/KIF4A/MYBL2/CHMP4B/RAB11A/ARHGEF10/BCCIP/SMC3/CDC20/CHMP1A/CDCA8/KIF23/MAP9/GOLGA2/CHMP6/AURKB/CHEK2/DRG1/KIFC1/LSM14A/SPICE1 | 26 |
| GO:0033211 | adiponectin-activated signaling pathway | 8/3662 | 11/15509 | 0.000784891 | 0.00381549 | 0.00229457 | ADIPOR2/APPL1/ADIPOR1/CSNK2B/CSNK2B/CSNK2B/CSNK2B/CSNK2B | 8 |
| GO:0035709 | memory T cell activation | 8/3662 | 11/15509 | 0.000784891 | 0.00381549 | 0.00229457 | HLA-A/HLA-A/HLA-A/HLA-A/HLA-A/HLA-A/HLA-A/HLA-A | 8 |
| GO:0036295 | cellular response to increased oxygen levels | 8/3662 | 11/15509 | 0.000784891 | 0.00381549 | 0.00229457 | NOX1/FAS/ATP6AP1/ATP6V1A/ATP6V1G1/FOXO1/ATG7/TMEM199 | 8 |
| GO:0060009 | Sertoli cell development | 8/3662 | 11/15509 | 0.000784891 | 0.00381549 | 0.00229457 | ARID4B/ATRX/GATA1/IL1A/SDC1/HSD17B4/RAB13/NTRK1 | 8 |
| GO:0060174 | limb bud formation | 8/3662 | 11/15509 | 0.000784891 | 0.00381549 | 0.00229457 | FGFR2/PLXNA2/WNT3/SOX4/COL2A1/SHH/WNT3/WNT3 | 8 |
| GO:2000672 | negative regulation of motor neuron apoptotic process | 8/3662 | 11/15509 | 0.000784891 | 0.00381549 | 0.00229457 | ERBB3/MAP2K4/RHOA/ROCK1/ZPR1/CNTFR/MAP3K12/NEFL | 8 |
| GO:0022404 | molting cycle process | 36/3662 | 93/15509 | 0.000798958 | 0.00387476 | 0.00233021 | ALX4/PUM2/CDH3/NGFR/FGFR2/TP63/GLI2/ZMPSTE24/FERMT1/ERCC2/DKK1/WNT5A/HDAC1/GORAB/INHBA/LAMA5/LRP4/NUMA1/SMAD4/LRIG1/EGFR/NOTCH1/MYSM1/FOXQ1/SHH/RBPJ/RELA/ZDHHC21/TNF/TNF/TNF/TNF/TNF/TNF/TNF/TNF | 36 |
| GO:0022405 | hair cycle process | 36/3662 | 93/15509 | 0.000798958 | 0.00387476 | 0.00233021 | ALX4/PUM2/CDH3/NGFR/FGFR2/TP63/GLI2/ZMPSTE24/FERMT1/ERCC2/DKK1/WNT5A/HDAC1/GORAB/INHBA/LAMA5/LRP4/NUMA1/SMAD4/LRIG1/EGFR/NOTCH1/MYSM1/FOXQ1/SHH/RBPJ/RELA/ZDHHC21/TNF/TNF/TNF/TNF/TNF/TNF/TNF/TNF | 36 |
| GO:0098773 | skin epidermis development | 36/3662 | 93/15509 | 0.000798958 | 0.00387476 | 0.00233021 | ALX4/PUM2/CDH3/NGFR/FGFR2/TP63/GLI2/ZMPSTE24/FERMT1/ERCC2/DKK1/WNT5A/HDAC1/GORAB/INHBA/LAMA5/AP3B1/LRP4/NUMA1/SMAD4/EGFR/NOTCH1/MYSM1/FOXQ1/SHH/RBPJ/RELA/ZDHHC21/TNF/TNF/TNF/TNF/TNF/TNF/TNF/TNF | 36 |
| GO:1990266 | neutrophil migration | 45/3662 | 123/15509 | 0.000807323 | 0.00391226 | 0.00235277 | CD74/WDR1/DNM1L/CCL22/CCL17/PIK3CG/C1QBP/CCL2/MDK/IL1A/CCL20/CSF3R/IL1B/CCR7/RAC2/CCL21/SLIT2/CXCL13/ITGB2/CXCR1/PF4/SYK/NOD2/RHOH/CXCL8/CCL11/BSG/CCL19/CXCR2/PDE4B/PPIA/FUT4/PRTN3/DPP4/CD177/PECAM1/CCL5/CCL5/CCL4/CCL18/CCL4/PRTN3/CCL4/CCL18/CCL18 | 45 |
| GO:0033688 | regulation of osteoblast proliferation | 14/3662 | 26/15509 | 0.000828286 | 0.00400446 | 0.00240821 | LTF/EIF2AK2/FGFR2/RHOA/ABL1/GATA1/SFRP1/BMP2/ITGAV/IGF1R/CCN1/MN1/NF2/ITGB3 | 14 |
| GO:0051000 | positive regulation of nitric-oxide synthase activity | 14/3662 | 26/15509 | 0.000828286 | 0.00400446 | 0.00240821 | FCER2/NOD1/PTK2B/APOE/CALM3/TERT/TNF/TNF/TNF/TNF/TNF/TNF/TNF/TNF | 14 |
| GO:0090200 | positive regulation of release of cytochrome c from mitochondria | 14/3662 | 26/15509 | 0.000828286 | 0.00400446 | 0.00240821 | BAD/BAK1/BAX/DNM1L/MMP9/PYCARD/PDCD5/PPIF/TNFSF10/HRK/PMAIP1/BCL2L11/GPER1/MFF | 14 |
| GO:0030042 | actin filament depolymerization | 23/3662 | 52/15509 | 0.000835901 | 0.0040287 | 0.00242279 | SCIN/SPTB/WDR1/ADD2/ACTN2/ADD1/MTPN/CAPZA1/DSTN/MICAL1/RDX/GSN/PLEKHH2/DMTN/SPTBN4/SPTA1/CFL1/SPTBN2/FLII/SPTAN1/IQANK1/PDXP/TWF2 | 23 |
| GO:0032387 | negative regulation of intracellular transport | 23/3662 | 52/15509 | 0.000835901 | 0.0040287 | 0.00242279 | SP100/VPS35/DERL2/LMAN1/SIRT6/RANGAP1/FERMT1/CRYAB/PARK7/NUP153/CD36/MDFIC/SNX12/BAG3/DMTN/ARFIP1/CDK5/PKIG/YOD1/ADIPOQ/SVIP/UBE2J1/GDI1 | 23 |
| GO:0043457 | regulation of cellular respiration | 23/3662 | 52/15509 | 0.000835901 | 0.0040287 | 0.00242279 | RHOA/PPIF/IFNG/IL4/PARK7/SLC25A23/TRAP1/CBFA2T3/ISCU/AK4/VCP/PRELID1/SLC25A33/PDE12/TNF/TNF/TNF/TNF/TNF/TNF/TNF/TNF/IL10RB | 23 |
| GO:0043903 | regulation of biological process involved in symbiotic interaction | 23/3662 | 52/15509 | 0.000835901 | 0.0040287 | 0.00242279 | CD4/LTF/CD74/MID2/TRIM14/ARG1/TRIM25/NECTIN2/TRIM5/TRIM22/SFTPD/ITGAV/FURIN/GSN/TRIM68/LGALS9/CXCL8/TRIM8/CIITA/EXOC7/IFITM1/HMGB1/TRIM26 | 23 |
| GO:0001942 | hair follicle development | 35/3662 | 90/15509 | 0.000850785 | 0.00409407 | 0.0024621 | ALX4/PUM2/CDH3/NGFR/FGFR2/TP63/GLI2/ZMPSTE24/FERMT1/ERCC2/DKK1/WNT5A/HDAC1/GORAB/INHBA/LAMA5/LRP4/NUMA1/SMAD4/EGFR/NOTCH1/MYSM1/FOXQ1/SHH/RBPJ/RELA/ZDHHC21/TNF/TNF/TNF/TNF/TNF/TNF/TNF/TNF | 35 |
| GO:0031058 | positive regulation of histone modification | 35/3662 | 90/15509 | 0.000850785 | 0.00409407 | 0.0024621 | KDM1A/KMT2E/PAF1/BAZ1B/SNAI2/FOXP3/DNMT3B/SMARCB1/PRKD2/GATA3/BCL6/SF3B1/MYB/PHF19/DEK/LIF/PRDM12/DNMT1/MYBBP1A/WBP2/TET1/SKIC8/SMAD4/OGT/NSD3/SMARCA5/RNF20/CTBP1/LMNA/BRD7/HCFC1/MUC1/WDR5/SMARCB1/TADA2A | 35 |
| GO:0045861 | negative regulation of proteolysis | 94/3662 | 297/15509 | 0.000870435 | 0.00418538 | 0.00251701 | TMEM98/HFE/LTF/HGF/BIRC3/CD44/HIPK2/ROCK1/CSNK2A2/PICALM/PEBP1/BIRC5/GLG1/BAG6/HSP90AB1/MMP9/BIRC7/USP14/N4BP1/PLAT/SGTA/GPI/TFPI2/DNAJB6/SERPINE1/AMBP/CRYAB/PDCL3/PARK7/SERPINC1/RECK/NR4A1/LRP1/USP9X/C3/SPINK2/CHAC1/NGF/MICAL1/SERPINE2/IL10/SORL1/THBS1/FURIN/ARRB2/APP/TLK2/OGT/SNX12/EIF3H/ALAD/SERPINH1/CRIM1/CAST/USP25/FABP1/RYBP/SHH/INTS1/CDK5/RAG1/EFNA1/SERPINB9/TRIAP1/A2M/F2/PAK2/ANXA2/USP7/CLN3/SPOCK3/SRC/SVIP/CR1/BAG6/TNF/TNF/MAGEA3/TNF/TNF/BAG6/TNF/TNF/BAG6/TNF/TNF/BAG6/BAG6/NAIP/NAIP/CRIM1/NAIP/GPI/F8A1 | 94 |
| GO:1990778 | protein localization to cell periphery | 97/3662 | 308/15509 | 0.000872573 | 0.00419241 | 0.00252124 | SLC4A1/ITGA3/ANK1/RABEP1/CDH1/EPHA3/PKP2/ATP2B4/ROCK1/VPS35/ATP6AP1/PICALM/NSF/ACTB/GPC4/ACTN2/EFR3B/RAB10/TMED2/HECTD1/PPIL2/SEC23A/ARFRP1/NUBP1/CSK/RAB11A/EHD4/TGFB1/RANGRF/CD81/LIN7A/KRT18/IFNG/TMEM59/VAMP8/PDZD11/LRP1/RAB38/ACSL3/PHAF1/LAMA5/PPFIA1/FLOT2/EPHB2/STXBP1/KIF13A/NUMA1/RDX/PREPL/ARL3/EPHA2/RAB13/STAC/ARL6IP5/ANK2/PIK3R1/TPBG/EGFR/ITGB1/MMP14/APPL1/RER1/LDLRAP1/EPB41/SPTBN4/AP2M1/ZDHHC3/GPER1/CDK5/TTC8/AMN/ARL13B/CDH2/KIF5B/PRKCE/NPTX1/BCL2L1/BSG/DAG1/HRAS/PDZK1/PACS1/ADIPOQ/CIB1/STAC3/CLN3/TNF/TNF/TNF/TNF/TNF/TNF/TNF/TNF/PIGW/LRP6/SQSTM1 | 97 |
| GO:0044089 | positive regulation of cellular component biogenesis | 136/3662 | 453/15509 | 0.00087773 | 0.00421392 | 0.00253418 | DHX33/BAK1/IFT88/FNIP2/RHOA/NAV3/ROCK1/CDC42/ARHGEF10L/SPAG5/GSK3B/BAX/PSMC5/P2RX7/PXN/ESR1/ABL1/SH3GLB1/KCTD17/PSMC6/TCL1A/ADNP/BMP7/FERMT1/HCK/PIEZO1/PYCARD/SFRP1/ARHGEF10/MED25/TGFB1/MET/TGFBR1/CSF3/IFNG/IL17A/IL5/SNX4/SDC1/PARK7/ELAPOR1/SLF2/TEK/CLU/PTK2B/CNOT1/FLRT3/ID1/CCR7/BECN1/KDR/CDC42EP1/RAC2/AJUBA/DNMT1/EPHB2/PSRC1/PPHLN1/APC/HRK/CD36/LCP1/TLR4/CCL21/ATAT1/NUMA1/ACTR2/PLCE1/ABI2/CLSTN3/SLAIN1/WARS1/BBS4/ST8SIA2/DEF8/EPHA2/PIK3R1/TPBG/MSN/NTRK2/CDC42EP2/BCL2L11/PRKCA/GBP5/CXCL13/KIT/ARHGAP35/ALOX15/TAL1/WNT4/CDC42EP3/RICTOR/CSF2/SYK/VCP/ATMIN/ABCA3/LIMS1/PDCD6IP/PRKCE/CCL11/CCL19/DAG1/HRAS/CEP135/BDNF/CDK5R1/GRB2/OXTR/MAPK15/ADGRB1/EPHB3/HGS/DRG1/THBS2/NF2/IL1RAP/MMP1/CD47/SRC/DNM3/NTRK1/MTOR/GPRASP3/TNF/TNF/TNF/TNF/TNF/TNF/TNF/TNF/TWF2/BRK1/PIP4K2B/SEPTIN9 | 136 |
| GO:0044344 | cellular response to fibroblast growth factor stimulus | 38/3662 | 100/15509 | 0.000878547 | 0.00421458 | 0.00253457 | CPS1/CD44/NGFR/FGFR2/HYAL2/FGFR3/NDST1/FGFR1/SFRP1/PRKD2/GATA3/SHOC2/CCL2/SMOC2/WNT5A/GALNT3/KDM5B/NR4A1/RUNX2/FLRT3/ZFP36/SPRY2/THBS1/FGF2/ZFP36L2/CXCL13/WNT4/CEP57/FRS2/CXCL8/FAM20C/GRB2/PTPN11/NOG/ZFP36L1/SPRY4/CCL5/CCL5 | 38 |
| GO:0072655 | establishment of protein localization to mitochondrion | 41/3662 | 110/15509 | 0.000883092 | 0.0042331 | 0.00254571 | AGK/TOMM34/CSNK2A2/LMAN1/BAX/SH3GLB1/TIMM13/SAMM50/GZMB/TIMM9/PDCD5/GSK3A/MAPK8/GRPEL1/MFN2/RAC2/TIMM10B/PRKAA1/AP3B1/NMT1/SAE1/IMMP1L/TIMM8B/BAG3/CALM3/BAP1/MFF/TOMM20/DDIT3/ATG13/TOMM5/PRKN/UBE2L3/UBL5/HSPA1L/HSPA1L/FIS1/HSPA1L/HSPA1L/HSPA1L/TIMM23 | 41 |
| GO:0060759 | regulation of response to cytokine stimulus | 51/3662 | 144/15509 | 0.000894961 | 0.00428668 | 0.00257794 | PAFAH1B1/CD74/UBE2K/PTPRC/MAVS/BIRC7/PYCARD/IL7/TLE5/HPX/SH2B3/WNT5A/PADI2/TNFAIP3/ARG1/CXCR4/H2BC11/RNF113A/IRF3/PXDN/IL6/IL1RN/TLR4/SLIT2/GFI1/SYK/TRIM44/FADD/NKIRAS2/TRIM56/PTPN2/PTPN11/ADIPOQ/TRAIP/IRAK1/SLIT3/CSF1/SIGIRR/SOCS1/PRKN/YTHDF3/NKIRAS1/CPNE1/NAIP/LSM14A/PTPRC/CCL5/CD24/CCL5/NAIP/NAIP | 51 |
| GO:0071772 | response to BMP | 55/3662 | 158/15509 | 0.000923557 | 0.00441682 | 0.0026562 | ITGA3/HFE/HIPK2/LRP2/ABL1/BMP7/SMAD7/SFRP1/TGFB1/SFRP4/ENG/GATA3/BMPR1A/DKK1/DDX5/SMAD5/WNT5A/HES1/SFRP5/EGR1/USP9X/RUNX2/BMP2/KDR/TWSG1/GDF15/NOTCH2/ADAMTS7/NUMA1/SORL1/SMAD6/COL2A1/TOB1/RNF165/SMAD4/CCN1/NOTCH1/CRIM1/BMP6/NODAL/SKI/HEYL/GDF9/ELAPOR2/HTRA1/RBPJ/RGMB/SMAD2/RGMA/NOG/TMPRSS6/FAM83G/TRIM33/CRIM1/ZNF8 | 55 |
| GO:0071773 | cellular response to BMP stimulus | 55/3662 | 158/15509 | 0.000923557 | 0.00441682 | 0.0026562 | ITGA3/HFE/HIPK2/LRP2/ABL1/BMP7/SMAD7/SFRP1/TGFB1/SFRP4/ENG/GATA3/BMPR1A/DKK1/DDX5/SMAD5/WNT5A/HES1/SFRP5/EGR1/USP9X/RUNX2/BMP2/KDR/TWSG1/GDF15/NOTCH2/ADAMTS7/NUMA1/SORL1/SMAD6/COL2A1/TOB1/RNF165/SMAD4/CCN1/NOTCH1/CRIM1/BMP6/NODAL/SKI/HEYL/GDF9/ELAPOR2/HTRA1/RBPJ/RGMB/SMAD2/RGMA/NOG/TMPRSS6/FAM83G/TRIM33/CRIM1/ZNF8 | 55 |
| GO:0030968 | endoplasmic reticulum unfolded protein response | 29/3662 | 71/15509 | 0.000925244 | 0.00442148 | 0.002659 | MBTPS2/UFL1/BAK1/HSPA5/HERPUD1/EIF2AK2/DERL2/TMED2/PPP1R15A/BAX/XBP1/BFAR/CREB3/TMEM33/CCND1/SERP1/TMTC4/DERL1/PIK3R1/BCL2L11/PPP1R15B/ATF3/VCP/EIF2AK3/DDIT3/PTPN2/ERN1/YOD1/CREB3L2 | 29 |
| GO:2001056 | positive regulation of cysteine-type endopeptidase activity | 48/3662 | 134/15509 | 0.000942415 | 0.00448956 | 0.00269994 | BAD/CASP10/FAS/BAK1/CYFIP2/NGFR/RHOA/BAX/MEFV/PYCARD/PDCD5/NOD1/CASP2/PERP/HSPE1/FASLG/TNFSF10/ANP32B/MTCH1/BCL2L10/PMAIP1/CCN1/ARL6IP5/GSN/BCL2L11/NODAL/GPER1/SYK/VCP/FADD/LGALS9/EIF2AK3/GRIN1/F2R/CARD9/HMGB1/DAPK1/MAP3K5/TNF/TNF/FIS1/TNF/TNF/TNF/TNF/TNF/TNF/PDCD6 | 48 |
| GO:0042178 | xenobiotic catabolic process | 15/3662 | 29/15509 | 0.000943111 | 0.00448956 | 0.00269994 | CYP2D6/CYP3A5/GSTM1/TPMT/CYP1A1/CYP1A2/GSTO1/CYP3A4/CYP2C19/CYP2B6/CYP2D6/CYP2D6/CYP2D6/CYP2D6/CYP2D6 | 15 |
| GO:0045662 | negative regulation of myoblast differentiation | 15/3662 | 29/15509 | 0.000943111 | 0.00448956 | 0.00269994 | MBNL3/CCL17/TGFB1/PPARD/NOTCH1/IL18/DDIT3/TNF/TNF/TNF/TNF/TNF/TNF/TNF/TNF | 15 |
| GO:0046825 | regulation of protein export from nucleus | 15/3662 | 29/15509 | 0.000943111 | 0.00448956 | 0.00269994 | SP100/PRKACA/SIRT6/GSK3B/XPO1/RANGAP1/PARK7/IL1B/XPO4/ANP32B/TCF7L2/BAG3/CDK5/PTPN11/PRKACA | 15 |
| GO:0050687 | negative regulation of defense response to virus | 15/3662 | 29/15509 | 0.000943111 | 0.00448956 | 0.00269994 | FOXP3/RIOK3/C1QBP/PPM1B/TARBP2/NLRX1/HTRA1/PCBP2/MICB/MICB/MICB/MICB/MICB/MICB/ITCH | 15 |
| GO:0007272 | ensheathment of neurons | 50/3662 | 141/15509 | 0.000968047 | 0.00459639 | 0.00276419 | TMEM98/CD9/CNTN1/HGF/TNFRSF1B/HEXB/SIRT2/ARHGEF10/ERCC2/PTN/CNTNAP1/CTSC/ZPR1/PPARD/EIF2B2/CLU/CXCR4/EGR2/MYRF/RARA/WASF3/TSPAN2/ITGAX/SOD1/ANK2/TNFRSF21/NTRK2/PARD3/SKI/B4GALT5/SLC25A46/ORMDL3/EIF2AK3/RARG/DAG1/KCNJ10/PLEC/CNTN2/POU3F2/MBP/MTOR/TNF/TNF/TNF/TNF/TNF/TNF/TNF/TNF/PTEN | 50 |
| GO:0008366 | axon ensheathment | 50/3662 | 141/15509 | 0.000968047 | 0.00459639 | 0.00276419 | TMEM98/CD9/CNTN1/HGF/TNFRSF1B/HEXB/SIRT2/ARHGEF10/ERCC2/PTN/CNTNAP1/CTSC/ZPR1/PPARD/EIF2B2/CLU/CXCR4/EGR2/MYRF/RARA/WASF3/TSPAN2/ITGAX/SOD1/ANK2/TNFRSF21/NTRK2/PARD3/SKI/B4GALT5/SLC25A46/ORMDL3/EIF2AK3/RARG/DAG1/KCNJ10/PLEC/CNTN2/POU3F2/MBP/MTOR/TNF/TNF/TNF/TNF/TNF/TNF/TNF/TNF/PTEN | 50 |
| GO:0060411 | cardiac septum morphogenesis | 28/3662 | 68/15509 | 0.000968615 | 0.00459639 | 0.00276419 | FGFR2/LRP2/BMP7/SMAD7/TGFBR1/ENG/BMPR1A/NSD2/WNT5A/HES1/NRP2/SOX4/NOTCH2/SMAD6/SMAD4/CCN1/SLIT2/NOTCH1/RBM15/TGFBR2/HEYL/NOS3/RBPJ/ZFPM2/NKX2-5/NOG/SLIT3/PARVA | 28 |
| GO:0031669 | cellular response to nutrient levels | 68/3662 | 204/15509 | 0.000969873 | 0.00459639 | 0.00276419 | SNAI2/RRAGD/FAS/CASR/CLEC16A/HSPA5/EIF2AK2/ASNS/SEH1L/GCN1/COMT/SH3GLB1/XBP1/NPRL3/SFRP1/USF2/MAPK8/RNF167/HSPA8/FOLR1/CYP27B1/VDR/ELAPOR1/SLC2A1/FOXO3/TRIM24/CDKN1A/MAX/BECN1/ATG14/CD68/SESN2/PRKAA1/MYBBP1A/HNRNPA1/GLUL/TTC5/GABARAPL1/IGF1R/TNFRSF11A/PMAIP1/SESN3/FOXO1/KLF10/WIPI2/BRSK1/WNT4/ATF3/INHBB/ALB/RICTOR/AQP3/ZFYVE1/MN1/FOS/PPM1D/EIF2AK3/KAT5/BRSK2/LEP/LPL/GAS2L1/PRR5/AKR1C3/KANK2/MAP3K5/ATG7/MTOR | 68 |
| GO:0051651 | maintenance of location in cell | 68/3662 | 204/15509 | 0.000969873 | 0.00459639 | 0.00276419 | SCIN/PAFAH1B1/CD4/HSPA5/HEXB/CYBA/AP3D1/SP100/PRKACA/PTPRC/FTL/BAX/FKBP1A/P2RX7/ABL1/RANGAP1/KDELR1/PDE4D/SKP1/DBN1/SLC30A3/PARK7/FASLG/PKD2/PTK2B/SRGN/SLC25A23/CCR7/APOE/SYNE1/CCL21/TAF8/SORL1/FGF2/BBS4/CALM2/ANK2/GSN/LCN2/GSTO1/ITPR1/RER1/CALM3/CCR5/SELENON/SLC30A7/ALB/GPER1/CDK5/FTH1/LETM1/PRKCE/CCL19/DDIT3/CD19/CALR/F2/F2R/SLC8A1/TRPV1/GM2A/SPOUT1/TMSB4X/TWF2/ITGB3/PTPRC/RASA3/PRKACA | 68 |
| GO:1903320 | regulation of protein modification by small protein conjugation or removal | 75/3662 | 229/15509 | 0.000970003 | 0.00459639 | 0.00276419 | KDM1A/CRY1/UFL1/BIRC3/PHF23/HSPA5/HERPUD1/FKBP1A/HSP90AB1/ABL1/RASD2/BIRC7/SMAD7/NDFIP2/N4BP1/AXIN1/UBE2I/GSK3A/AIMP2/TGFBR1/ZMIZ1/SEPTIN4/FBXO5/SKP1/EPAS1/PARK7/CDC20/TNFAIP3/MASTL/EGR1/SOX4/PIN1/NDFIP1/PIAS3/PER2/HSPBP1/PTPN22/SPRY2/TANK/DERL1/ARRB2/SAE1/ARNT/SPOPL/OGT/RCHY1/CDK5/VCP/BTRC/WBP1L/TRIM44/NOD2/NXN/COPS6/CENPX/GPS1/PRKCE/RELA/GLMN/SVBP/NPM1/ADGRB1/PTTG1IP/PRKN/UBE2L3/PPIA/DAXX/DAXX/DAXX/DAXX/DAXX/PDCD6/SQSTM1/PTEN/ITCH | 75 |
| GO:2000345 | regulation of hepatocyte proliferation | 12/3662 | 21/15509 | 0.000975402 | 0.00461844 | 0.00277745 | XBP1/PTN/MDK/TNFAIP3/TNF/TNF/TNF/TNF/TNF/TNF/TNF/TNF | 12 |
| GO:0050878 | regulation of body fluid levels | 110/3662 | 357/15509 | 0.000984762 | 0.0046592 | 0.00280196 | SLC4A1/CD9/CYBA/F7/HYAL2/PRKACA/TP63/LMAN1/ACTB/FBLN1/OPRK1/CD59/APOH/XBP1/PDGFB/MYH9/CTSG/PROCR/CD40/GATA1/CD40LG/DGKH/PLAT/KCNN4/GPI/USF2/TFPI2/PIK3CG/MET/HSPB1/SERPINE1/HGFAC/CCND1/VWF/SH2B3/VDR/MAPK14/SLC29A1/FN1/MPL/SERPINC1/STMN1/VAMP8/GNA13/F13A1/STAT5A/TRPV5/CDO1/APOE/AP3B1/EPHB2/PDGFRA/CD36/SERPINE2/EDNRB/IL6/STXBP1/TLR4/THBS1/ADAMTS18/CELSR2/FLG/GNA12/AK3/UGCG/IL18/MERTK/DGKE/PRKCA/GNAQ/DMTN/ADAMTS13/ZNF385A/AQP5/PF4/PRKCD/ANXA5/F2RL2/SHH/NOS3/SYK/AQP3/FUNDC2/HPS6/PRDX2/PRKCE/C1GALT1C1/FGG/FGA/JMJD1C/STAT5B/SELP/PLEC/F2/OXTR/F2R/ANXA2/ADRA2C/PLSCR1/BLOC1S3/PPIA/SRC/F5/NME1/HBB/ITGB3/TRPV5/ADAMTS13/GPI/PRKACA | 110 |
| GO:0050770 | regulation of axonogenesis | 52/3662 | 148/15509 | 0.000987187 | 0.00466356 | 0.00280458 | IFRD1/PAFAH1B1/CDH1/NTN1/MARK2/PLXNA2/GSK3B/ADNP/CXCL12/WNT3/EFNB3/DBN1/WNT5A/FN1/SPP1/CHN1/EPHB2/NGF/LRP4/DBNL/KIAA0319/CRABP2/SLIT2/NTRK2/POU4F2/ARHGAP35/BRSK1/DISC1/CDK5/SEMA4C/EFNA1/SEMA3E/CDH2/LPAR3/MAP6/BRSK2/BDNF/CDH4/PAK2/EPHB3/CNTN2/POU3F2/DCC/SYNGAP1/SIPA1L1/MBP/GDI1/TWF2/NEFL/WNT3/WNT3/PTEN | 52 |
| GO:0097530 | granulocyte migration | 52/3662 | 148/15509 | 0.000987187 | 0.00466356 | 0.00280458 | CD74/WDR1/DNM1L/CCL22/CCL17/PIK3CG/C1QBP/CCL2/MDK/IL17A/IL4/IL1A/CCL20/CSF3R/IL1B/CCR7/RAC2/CCL21/THBS1/SLIT2/CXCL13/ITGB2/CXCR1/PF4/SYK/NOD2/RHOH/PTK2/CXCL8/SCG2/CCL11/BSG/CCL19/CXCR2/CSF1R/CSF1/PDE4B/PPIA/FUT4/PRTN3/DPP4/CD177/PECAM1/CCL5/CCL5/CCL4/CCL18/CCL4/PRTN3/CCL4/CCL18/CCL18 | 52 |
| GO:0007088 | regulation of mitotic nuclear division | 42/3662 | 114/15509 | 0.00100849 | 0.00475371 | 0.00285879 | CDC27/IGF1/CDC42/NDC80/ZW10/ANAPC5/BIRC5/PDGFB/BMP7/FBXO5/CUL9/PDGFRB/IL1A/CDC20/TEX14/OBSL1/IL1B/PIN1/PKMYT1/CCNB1/CDCA8/APC/BORA/NUSAP1/EGF/RB1/MKI67/SPC25/BUB1/ZWILCH/AURKAIP1/CD28/AURKB/TNF/TNF/TNF/TNF/TNF/TNF/TNF/TNF/PDXP | 42 |
| GO:0070585 | protein localization to mitochondrion | 42/3662 | 114/15509 | 0.00100849 | 0.00475371 | 0.00285879 | AGK/TOMM34/CSNK2A2/LMAN1/BAX/DNM1L/SH3GLB1/TIMM13/SAMM50/GZMB/TIMM9/PDCD5/GSK3A/MAPK8/GRPEL1/MFN2/RAC2/TIMM10B/PRKAA1/AP3B1/NMT1/SAE1/IMMP1L/TIMM8B/BAG3/CALM3/BAP1/MFF/TOMM20/DDIT3/ATG13/TOMM5/PRKN/UBE2L3/UBL5/HSPA1L/HSPA1L/FIS1/HSPA1L/HSPA1L/HSPA1L/TIMM23 | 42 |
| GO:0002260 | lymphocyte homeostasis | 27/3662 | 65/15509 | 0.00101087 | 0.00475371 | 0.00285879 | CD74/FAS/BAK1/TNFRSF17/FOXP3/BAX/P2RX7/ABL1/JAK3/PPP3CB/TNFAIP3/GPAM/PKN1/IL2RA/PMAIP1/BCL2L11/TSC22D3/SPTA1/CASP3/RAG1/LMO1/PRDX2/FADD/LGALS9/STAT5B/TNFRSF13B/MIF | 27 |
| GO:0002534 | cytokine production involved in inflammatory response | 27/3662 | 65/15509 | 0.00101087 | 0.00475371 | 0.00285879 | MEFV/PYCARD/EZH2/MAPK14/IL17A/EPHB2/IL6/TLR4/GBP5/APPL1/BAP1/NOD2/LEP/F2/LILRB4/CARD9/TNF/TNF/TNF/TNF/TNF/TNF/TNF/TNF/LILRB4/LILRB4/LILRB4 | 27 |
| GO:0070265 | necrotic cell death | 27/3662 | 65/15509 | 0.00101087 | 0.00475371 | 0.00285879 | BIRC3/FAS/BAX/DNM1L/ASAH1/GSDME/PPIF/FASLG/RBCK1/IRF3/MUTYH/PARP1/OGT/NDUFC2/TLR3/FADD/FZD9/MAP3K5/TNF/TNF/TNF/TNF/TNF/TNF/TNF/TNF/PGAM5 | 27 |
| GO:1900015 | regulation of cytokine production involved in inflammatory response | 27/3662 | 65/15509 | 0.00101087 | 0.00475371 | 0.00285879 | MEFV/PYCARD/EZH2/MAPK14/IL17A/EPHB2/IL6/TLR4/GBP5/APPL1/BAP1/NOD2/LEP/F2/LILRB4/CARD9/TNF/TNF/TNF/TNF/TNF/TNF/TNF/TNF/LILRB4/LILRB4/LILRB4 | 27 |
| GO:0060070 | canonical Wnt signaling pathway | 89/3662 | 280/15509 | 0.00101416 | 0.00475479 | 0.00285945 | WNT16/SNAI2/PTPRU/CDH3/FGFR2/VPS35/GSK3B/GSKIP/CHD8/FERMT1/AXIN1/SFRP1/TLE5/TGFB1/GSK3A/SFRP4/DVL1/GATA3/DKK1/WNT3/FOLR1/MDK/WNT5B/FZD10/MAPK14/NPHP3/KPNA1/WNT5A/IGFBP2/SDC1/BCL9/HDAC1/FOXO3/SFRP5/EGR1/RECK/PFDN5/SOX4/BMP2/PIN1/APOE/LRP4/APC/EDNRB/PPM1B/FGF2/EGF/CSNK1D/RBMS3/TPBG/EGFR/NOTCH1/TCF7L2/FOXO1/HHEX/NR4A2/GNAQ/DVL3/WNT4/DISC1/FRZB/PYGO2/SHH/VCP/AMER2/BTRC/RBPJ/ZEB2/CTNND2/CDH2/RARG/FZD4/DDIT3/CTNNBIP1/NKX2-5/NOG/ZNF703/NOTUM/PRKN/BCL9L/RNF220/WNT7B/FZD9/SRC/NRARP/WNT3/WNT3/LRP6/PTEN | 89 |
| GO:0010763 | positive regulation of fibroblast migration | 10/3662 | 16/15509 | 0.00101571 | 0.00475479 | 0.00285945 | TGFB1/ACTA2/AKAP12/THBS1/ITGB1/DMTN/PTK2/PRKCE/SLC8A1/ITGB3 | 10 |
| GO:0032782 | bile acid secretion | 10/3662 | 16/15509 | 0.00101571 | 0.00475479 | 0.00285945 | CASR/PRKAA1/TNF/TNF/TNF/TNF/TNF/TNF/TNF/TNF | 10 |
| GO:0033189 | response to vitamin A | 10/3662 | 16/15509 | 0.00101571 | 0.00475479 | 0.00285945 | HAMP/PPARD/ARG1/DNMT3A/CAT/ALDH1A2/EPO/RARA/CYP1A1/TYMS | 10 |
| GO:0043922 | negative regulation by host of viral transcription | 10/3662 | 16/15509 | 0.00101571 | 0.00475479 | 0.00285945 | HDAC1/TARDBP/HMGA2/PSMC3/JUN/CCL5/CCL5/CCL4/CCL4/CCL4 | 10 |
| GO:0071712 | ER-associated misfolded protein catabolic process | 10/3662 | 16/15509 | 0.00101571 | 0.00475479 | 0.00285945 | BAG6/UGGT2/DERL1/VCP/RNF5/BAG6/BAG6/BAG6/BAG6/BAG6 | 10 |
| GO:0019835 | cytolysis | 16/3662 | 32/15509 | 0.00103351 | 0.00482354 | 0.00290079 | GSDMB/LYZ/GZMB/TGFB1/PRF1/MICA/CR1/MICB/MICB/MICB/MICB/MICA/MICB/MICA/MICA/MICB | 16 |
| GO:0045948 | positive regulation of translational initiation | 16/3662 | 32/15509 | 0.00103351 | 0.00482354 | 0.00290079 | PPP1R15A/RPS6KB1/POLR2D/CDC123/YTHDF3/MTOR/TNF/TNF/TNF/TNF/TNF/TNF/TNF/TNF/CCL5/CCL5 | 16 |
| GO:0062149 | detection of stimulus involved in sensory perception of pain | 16/3662 | 32/15509 | 0.00103351 | 0.00482354 | 0.00290079 | CXCL12/CALCA/CXCR4/PRDM12/ARRB2/NR2F6/TRPV1/NTRK1/TNF/TNF/TNF/TNF/TNF/TNF/TNF/TNF | 16 |
| GO:1903955 | positive regulation of protein targeting to mitochondrion | 16/3662 | 32/15509 | 0.00103351 | 0.00482354 | 0.00290079 | CSNK2A2/SH3GLB1/PDCD5/GSK3A/RAC2/PRKAA1/SAE1/BAP1/ATG13/UBE2L3/UBL5/HSPA1L/HSPA1L/HSPA1L/HSPA1L/HSPA1L | 16 |
| GO:0046718 | viral entry into host cell | 49/3662 | 138/15509 | 0.00104705 | 0.00488307 | 0.00293659 | CD4/CD74/HYAL2/MID2/ICAM1/KPNA3/SLC1A5/TRIM14/EFNB3/CD81/CD86/VAMP8/TRIM25/CD80/CXCR4/NUP153/NECTIN2/TRIM5/TRIM22/ITGAV/SLC7A1/FURIN/EPHA2/EGFR/GSN/NCAM1/ITGB1/CCR5/ANPEP/TRIM68/SLC3A2/LGALS9/GYPA/CDK1/TRIM8/BSG/DAG1/CIITA/SLC52A2/IFITM1/PLSCR1/HMGB1/CD55/DPP4/WWP2/CR1/TRIM26/ITGB3/ITCH | 49 |
| GO:0016445 | somatic diversification of immunoglobulins | 26/3662 | 62/15509 | 0.00105123 | 0.00489888 | 0.0029461 | PARP3/FOXP3/TCF3/TBX21/MLH1/PTPRC/MSH2/CD40/CD40LG/NBN/IL27RA/TGFB1/EXOSC3/NSD2/AICDA/IL4/BCL6/SHLD2/NDFIP1/IL10/SLC15A4/TNFSF13/LIG4/CD28/PRKDC/PTPRC | 26 |
| GO:0031346 | positive regulation of cell projection organization | 99/3662 | 317/15509 | 0.00105812 | 0.00492729 | 0.00296318 | KDM1A/ITGA3/PAFAH1B1/CNTN1/HGF/GRN/IFT88/EPHA3/HSPA5/NTN1/CDC42/MARK2/PLXNA2/GSK3B/P2RX7/ABL1/KCTD17/ADNP/BMP7/NDRG4/SCN1B/PTN/EZH2/TGFBR1/RAPGEF1/DVL1/CXCL12/WNT3/MDK/CORO1C/NEDD9/TMEM30A/DBN1/WNT5A/FN1/P3H1/PTK2B/OBSL1/CCR7/STYXL1/CDC42EP1/RAC2/APOE/EPO/EPHB2/NGF/APC/DBNL/CCL21/TUBB2B/ACTR2/PLCE1/ABI2/IGF1R/BBS4/DEF8/RETREG3/CRABP2/ABL2/SLIT2/PIK3R1/VLDLR/NTRK2/CDC42EP2/POU4F2/KIT/ARHGAP35/DVL3/TBC1D24/DISC1/CDC42EP3/ATMIN/ALK/LPAR3/MAP6/ENC1/CCL19/HRAS/CEP135/FZD4/BDNF/CDH4/CREB3L2/SS18L1/ROR1/MAGI2/SRC/DNM3/NTRK1/MTOR/GPRASP3/GDI1/TWF2/BRK1/CUX1/NEFL/WNT3/WNT3/SEPTIN9 | 99 |
| GO:0006310 | DNA recombination | 93/3662 | 295/15509 | 0.00106211 | 0.00494217 | 0.00297214 | KDM1A/HMGB3/PARP3/FOXP3/RAD51/MSH4/TCF3/TBX21/ACTB/MLH1/SIRT6/XRCC5/PTPRC/RAD54L/FUS/MSH2/CDC7/CCNB1IP1/APEX1/CD40/ACTR5/RBBP8/CD40LG/NBN/ERCC2/IL27RA/TGFB1/EXOSC3/RECQL5/NSD2/AICDA/IL4/RAD50/BCL6/KPNA1/INO80D/SLF2/SHLD2/POLM/MORF4L2/H1-3/KLHDC3/AP5S1/BCL11B/YEATS4/AUNIP/NDFIP1/TOP2A/BRME1/EPC2/IL10/ACTR2/SLC15A4/NABP2/BRCA2/PIF1/INTS3/PARP1/DCAF1/NONO/RADX/PPP4C/EME1/MRNIP/TNFSF13/RAG1/MCM7/H1-4/RFWD3/CENPX/RHNO1/KAT5/NABP1/LIG4/RAG2/RMI2/MAGEF1/CD28/RMI1/SETD2/H1-2/H2AX/H1-0/ARID2/HMGB1/TRRAP/ZSWIM7/PRKDC/RTEL1/PTPRC/FAN1/PAGR1/TOP3A | 93 |
| GO:0033077 | T cell differentiation in thymus | 31/3662 | 78/15509 | 0.0010798 | 0.00501744 | 0.0030174 | CD74/FOXP3/GLI2/PTPRC/ABL1/GATA3/IL1A/ZAP70/IL1B/CCR7/BCL11B/FOXJ1/SOD1/IL2RG/ZEB1/ZFP36L2/MR1/WNT4/SHH/RAG1/FADD/STAT5B/LIG4/RAG2/PTPN2/CD28/ZFP36L1/MAFB/PRKDC/PTPRC/B2M | 31 |
| GO:0007623 | circadian rhythm | 63/3662 | 187/15509 | 0.00107991 | 0.00501744 | 0.0030174 | CRY1/BMAL2/PER3/F7/NGFR/FBXW11/SIRT6/GSK3B/EZH2/AHR/MAPK8/RAI1/ID2/HDAC1/KLF9/EGR1/TARDBP/CRY2/USP9X/ID1/NR1D1/FBXL12/ASS1/TOP2A/PER2/PRKAA1/MYBBP1A/BHLHE40/NKX2-1/CSNK1D/TNFRSF11A/PARP1/NONO/OGT/NTRK2/KLF10/GNAQ/NR2F6/CSF2/ADCY1/BTRC/CDK1/KAT5/KDM2A/LEP/TYMS/ADIPOQ/BTBD9/USP7/ATG7/NTRK1/MTOR/CIPC/TNF/TNF/TNF/TNF/TNF/TNF/TNF/TNF/PRKDC/PTEN | 63 |
| GO:0051304 | chromosome separation | 41/3662 | 111/15509 | 0.00108547 | 0.00503949 | 0.00303066 | CDC27/ARID1B/CSNK2A2/ACTB/MLH1/NDC80/ZW10/ANAPC5/BIRC5/CDC6/BCL7C/SMARCB1/RECQL5/SMARCD2/BCL7A/FBXO5/SMC4/CDC20/ARID1A/TEX14/TOP2A/CCNB1/CDCA8/APC/NUMA1/CENPE/RB1/NCAPG2/SPC25/EME1/BRD7/BUB1/CENPX/ZWILCH/RMI1/AURKB/MAPK15/PLSCR1/ARID2/SMARCB1/TOP3A | 41 |
| GO:0080164 | regulation of nitric oxide metabolic process | 25/3662 | 59/15509 | 0.00108873 | 0.00505088 | 0.00303751 | ATP2B4/HSP90AB1/ACP5/IFNG/PKD2/CLU/PTK2B/IL1B/ASS1/CD36/IL10/TLR4/DDAH1/CX3CR1/TRPV1/CD47/TNF/TNF/TNF/TNF/TNF/TNF/TNF/TNF/HBB | 25 |
| GO:0071478 | cellular response to radiation | 59/3662 | 173/15509 | 0.00109477 | 0.00507507 | 0.00305206 | KDM1A/CRY1/SNAI2/BAK1/HSPA5/USP28/RAD51/CYBA/TMEM161A/HYAL2/XRCC5/ZMPSTE24/BAX/MMP2/MMP9/ACTR5/N4BP1/SFRP1/EEF1D/HAMP/GATA3/CRYAB/MAPK14/GADD45A/EGR1/CRY2/CDKN1A/ELK1/DDB2/NMT1/TANK/XPA/BRCA2/CUL4A/PARP1/RHOB/PIK3R1/TLK2/NMT2/XPC/CUL4B/RPL26/PRKCD/TP53INP1/MGMT/TRIAP1/BCL2L1/RHNO1/LIG4/HRAS/GRB2/AURKB/NPM1/H2AC25/CHEK2/H2AX/NOC2L/MME/MMP1 | 59 |
| GO:0072175 | epithelial tube formation | 46/3662 | 128/15509 | 0.00110001 | 0.00509076 | 0.00306149 | FGFR2/PRKACA/TULP3/LRP2/TMED2/KDM2B/HECTD1/ABL1/CECR2/MTHFD1/BMP7/TSC2/SFRP1/TGFB1/DVL1/GATA3/FOLR1/NPHP3/WNT5A/MTHFD1L/SOX4/PODXL/RARA/FGF2/EGF/BBS4/NODAL/SKI/ARHGAP35/DVL3/WNT4/VANGL2/CASP3/SEMA4C/RARG/GLMN/SETD2/RGMA/NOG/BRD2/TCTN1/BRD2/BRD2/BRD2/BRD2/PRKACA | 46 |
| GO:0042307 | positive regulation of protein import into nucleus | 17/3662 | 35/15509 | 0.00110062 | 0.00509076 | 0.00306149 | CDH1/IPO5/HYAL2/MAVS/HSP90AB1/TGFB1/ZPR1/IFNG/MAPK14/TARDBP/PIK3R1/BAG3/PRKCD/SHH/CHP2/CDK1/LEP | 17 |
| GO:0042759 | long-chain fatty acid biosynthetic process | 17/3662 | 35/15509 | 0.00110062 | 0.00509076 | 0.00306149 | ACOT7/CYP2D6/CYP2E1/GSTM1/CYP1A1/CYP1A2/CYP3A4/ALOX15/GPX4/ASAH2/LTC4S/CYP2D6/CYP2D6/CYP2D6/CYP2D6/CYP2D6/LTC4S | 17 |
| GO:2000573 | positive regulation of DNA biosynthetic process | 30/3662 | 75/15509 | 0.00114148 | 0.00527585 | 0.0031728 | HGF/XRCC5/NOX4/MAPKAPK5/HSP90AB1/PDGFB/GINS1/PRKD2/SMOC2/PDGFRB/PTK2B/POT1/DKC1/HNRNPA1/CCT7/CYP1B1/FGF2/ARRB2/CCT2/AURKB/MAPK15/SRC/TNF/TNF/TNF/TNF/TNF/TNF/TNF/TNF | 30 |
| GO:0033045 | regulation of sister chromatid segregation | 34/3662 | 88/15509 | 0.00114471 | 0.00528684 | 0.00317941 | CDC27/ARID1B/ACTB/NDC80/ZW10/ANAPC5/BIRC5/CDC6/BCL7C/SMARCB1/SMARCD2/BCL7A/FBXO5/KAT2B/CDC20/ARID1A/TEX14/BECN1/CCNB1/CDCA8/APC/NUMA1/CENPE/RB1/SPC25/BRD7/BUB1/KAT5/ZWILCH/RMI2/AURKB/MAPK15/ARID2/SMARCB1 | 34 |
| GO:0043029 | T cell homeostasis | 18/3662 | 38/15509 | 0.00114661 | 0.00528771 | 0.00317994 | FAS/FOXP3/BAX/P2RX7/JAK3/PPP3CB/GPAM/IL2RA/PMAIP1/BCL2L11/TSC22D3/CASP3/RAG1/LMO1/PRDX2/FADD/LGALS9/STAT5B | 18 |
| GO:0070229 | negative regulation of lymphocyte apoptotic process | 18/3662 | 38/15509 | 0.00114661 | 0.00528771 | 0.00317994 | ST3GAL1/CD74/ARG2/JAK3/BCL6/GPAM/BCL11B/TSC22D3/RAG1/FADD/EFNA1/PTCRA/ORMDL3/AURKB/NOC2L/CCL5/CCL5/MIF | 18 |
| GO:0035904 | aorta development | 23/3662 | 53/15509 | 0.00115043 | 0.00529744 | 0.00318579 | PRDM1/NGFR/MYLK/NDST1/LRP2/HECTD1/NPRL3/EYA1/ENG/BMPR1A/PDGFRB/HES1/SNX17/PKD2/EGR2/LRP1/SOX4/SMAD6/FKBP10/NOTCH1/DCTN5/RBPJ/LEP | 23 |
| GO:1901799 | negative regulation of proteasomal protein catabolic process | 23/3662 | 53/15509 | 0.00115043 | 0.00529744 | 0.00318579 | HFE/BAG6/HSP90AB1/USP14/N4BP1/SGTA/PARK7/USP9X/TLK2/OGT/EIF3H/ALAD/USP25/RYBP/SHH/USP7/SVIP/BAG6/BAG6/BAG6/BAG6/BAG6/F8A1 | 23 |
| GO:0045668 | negative regulation of osteoblast differentiation | 22/3662 | 50/15509 | 0.00117168 | 0.00539128 | 0.00324222 | SFRP1/AREG/TWSG1/MEN1/SMAD6/TOB1/NOTCH1/VEGFC/CRIM1/SKI/RANBP3L/RIOX1/NOG/TNF/TNF/TNF/TNF/TNF/TNF/TNF/TNF/CRIM1 | 22 |
| GO:0043124 | negative regulation of I-kappaB kinase/NF-kappaB signaling | 19/3662 | 41/15509 | 0.00117409 | 0.00539438 | 0.00324408 | RHOA/ESR1/ABL1/RIOK3/PYCARD/STAT1/HDAC1/ASH1L/TNFAIP3/NR1D1/TANK/PPM1B/NLRX1/RHOH/ADIPOQ/LILRB4/LILRB4/LILRB4/LILRB4 | 19 |
| GO:1990090 | cellular response to nerve growth factor stimulus | 19/3662 | 41/15509 | 0.00117409 | 0.00539438 | 0.00324408 | TAC1/HSPA5/CSTF2/RAPGEF1/CALCA/HES1/FOXO3/ID1/NGF/DYNC1LI2/EIF4A3/CSNK1D/APP/NTRK2/BDNF/CIB1/MAGI2/TRPV1/NTRK1 | 19 |
| GO:0046033 | AMP metabolic process | 13/3662 | 24/15509 | 0.0011813 | 0.00541158 | 0.00325443 | AK2/PRPS2/AK1/AMPD2/NT5C1A/PAICS/PPAT/NT5E/AK3/GART/AK4/ADSS1/ADSL | 13 |
| GO:1901550 | regulation of endothelial cell development | 13/3662 | 24/15509 | 0.0011813 | 0.00541158 | 0.00325443 | ROCK1/ADD1/IL1B/ZDHHC21/PLCB1/TNF/TNF/TNF/TNF/TNF/TNF/TNF/TNF | 13 |
| GO:1903140 | regulation of establishment of endothelial barrier | 13/3662 | 24/15509 | 0.0011813 | 0.00541158 | 0.00325443 | ROCK1/ADD1/IL1B/ZDHHC21/PLCB1/TNF/TNF/TNF/TNF/TNF/TNF/TNF/TNF | 13 |
| GO:0001659 | temperature homeostasis | 60/3662 | 177/15509 | 0.00118133 | 0.00541158 | 0.00325443 | KDM1A/ADIPOR2/TFE3/ACADVL/IL4R/SIRT6/ACHE/SCD/MAP2K6/IL4/IL1A/KDM3A/EPAS1/LEPR/MFN2/EGR1/CXCR4/IL1B/ID1/THRA/NR1D1/PER2/APC/CD36/EDNRB/TLR4/IRF4/RB1/IGF1R/TNFRSF11A/PDGFC/OGT/LCN2/NOTCH1/IL18/FOXO1/GJA1/ADIPOR1/OMA1/SYK/RBPJ/ADRB2/KSR2/CEBPB/LEP/DDIT3/OXTR/ADIPOQ/TRPV1/TNF/TNF/EBF2/TNF/TNF/TNF/TNF/TNF/TNF/PGAM5/SQSTM1 | 60 |
| GO:0030834 | regulation of actin filament depolymerization | 21/3662 | 47/15509 | 0.00118415 | 0.00541652 | 0.0032574 | SCIN/SPTB/WDR1/ADD2/ACTN2/ADD1/MTPN/CAPZA1/DSTN/RDX/GSN/PLEKHH2/DMTN/SPTBN4/SPTA1/SPTBN2/FLII/SPTAN1/IQANK1/PDXP/TWF2 | 21 |
| GO:0140353 | lipid export from cell | 21/3662 | 47/15509 | 0.00118415 | 0.00541652 | 0.0032574 | CRY1/KCNQ1/P2RX7/MAP2K6/IL1A/KDM5B/SPP1/CRHR1/CRY2/INHBA/ABCC4/IL1B/CYP19A1/TNFRSF11A/REN/BMP6/GDF9/LEP/FZD4/PTPN11/MIF | 21 |
| GO:1904407 | positive regulation of nitric oxide metabolic process | 20/3662 | 44/15509 | 0.00118575 | 0.00541981 | 0.00325938 | HSP90AB1/IFNG/PKD2/CLU/PTK2B/IL1B/ASS1/CD36/TLR4/DDAH1/TRPV1/TNF/TNF/TNF/TNF/TNF/TNF/TNF/TNF/HBB | 20 |
| GO:0030833 | regulation of actin filament polymerization | 45/3662 | 125/15509 | 0.00118822 | 0.00542712 | 0.00326377 | SCIN/CYFIP2/RHOA/SPTB/ADD2/ADD1/HCK/COTL1/PYCARD/MTPN/CSF3/ARPC3/DBN1/CAPZA1/PTK2B/CCR7/CDC42EP1/ARPC1B/DBNL/CCL21/RDX/BBS4/SLIT2/ARHGAP18/GSN/CDC42EP2/DMTN/SPTBN4/ALOX15/ARPC5/CDC42EP3/SPTA1/PRKCD/RICTOR/PRKCE/CCL11/SPTBN2/FLII/GRB2/SPTAN1/MTOR/IQANK1/TMSB4X/ARPC1A/TWF2 | 45 |
| GO:0003206 | cardiac chamber morphogenesis | 42/3662 | 115/15509 | 0.0012314 | 0.00562018 | 0.00337988 | PKP2/FGFR2/LRP2/FKBP1A/DSP/BMP7/SMAD7/TGFB1/GSK3A/TGFBR1/ENG/GATA3/BMPR1A/NSD2/WNT5A/HES1/FHL2/TNNT2/NRP2/TEK/SOX4/BMP2/TNNI3/NOTCH2/SMAD6/SMAD4/CCN1/SLIT2/NOTCH1/POU4F1/ADAMTS1/TNNI1/RBM15/TGFBR2/HEYL/NOS3/RBPJ/ZFPM2/NKX2-5/NOG/SLIT3/PARVA | 42 |
| GO:0042552 | myelination | 49/3662 | 139/15509 | 0.00125218 | 0.00571082 | 0.00343438 | TMEM98/CD9/CNTN1/HGF/TNFRSF1B/HEXB/SIRT2/ARHGEF10/ERCC2/PTN/CNTNAP1/CTSC/ZPR1/EIF2B2/CLU/CXCR4/EGR2/MYRF/RARA/WASF3/TSPAN2/ITGAX/SOD1/ANK2/TNFRSF21/NTRK2/PARD3/SKI/B4GALT5/SLC25A46/ORMDL3/EIF2AK3/RARG/DAG1/KCNJ10/PLEC/CNTN2/POU3F2/MBP/MTOR/TNF/TNF/TNF/TNF/TNF/TNF/TNF/TNF/PTEN | 49 |
| GO:0098869 | cellular oxidant detoxification | 36/3662 | 95/15509 | 0.00125516 | 0.00572021 | 0.00344004 | MPO/PTGS1/BMP7/GSR/PARK7/PRDX1/PRDX6/UBIAD1/CAT/APOE/PXDN/SESN2/CD36/SOD1/GSTO1/FANCC/FABP1/ALB/NOS3/TP53INP1/GPX4/NXN/PRDX2/NQO1/TXNRD1/SELENOT/GPX3/LTC4S/HBE1/HBD/HBB/HP/SRXN1/TPO/GSTT1/LTC4S | 36 |
| GO:0006094 | gluconeogenesis | 28/3662 | 69/15509 | 0.00126755 | 0.00577243 | 0.00347144 | CRY1/SIRT6/SLC25A1/PCK2/SLC39A14/GPI/ALDOC/KAT2B/LEPR/SESN2/G6PC1/PER2/OGT/SOGA1/FOXO1/RANBP2/ATF3/NNMT/GPD1/MST1/LEP/PTPN2/ERFE/ADIPOQ/SLC25A10/USP7/WDR5/GPI | 28 |
| GO:0009791 | post-embryonic development | 32/3662 | 82/15509 | 0.00129878 | 0.00591031 | 0.00355436 | BAK1/ALX4/PRDM1/FGFR2/APOB/ATRX/BAX/ABL1/ERCC2/TGFBR1/GATA3/CDH23/CCDC47/ASH1L/KDM5B/SERP1/PLAGL2/BCL11B/KDR/IREB2/CYP1A2/CSRNP1/MMUT/ARID5B/ITPR1/BCL2L11/NR4A2/SMAD2/IGF2R/MTOR/GIGYF2/TBCE | 32 |
| GO:1903051 | negative regulation of proteolysis involved in protein catabolic process | 27/3662 | 66/15509 | 0.00133072 | 0.00605122 | 0.0036391 | HFE/HIPK2/CSNK2A2/BAG6/HSP90AB1/USP14/N4BP1/SGTA/PDCL3/PARK7/USP9X/TLK2/OGT/EIF3H/ALAD/USP25/RYBP/SHH/EFNA1/USP7/SVIP/BAG6/BAG6/BAG6/BAG6/BAG6/F8A1 | 27 |
| GO:0072659 | protein localization to plasma membrane | 84/3662 | 264/15509 | 0.00133489 | 0.00606573 | 0.00364782 | SLC4A1/ITGA3/ANK1/CDH1/EPHA3/PKP2/ATP2B4/ROCK1/VPS35/ATP6AP1/PICALM/NSF/ACTB/ACTN2/EFR3B/RAB10/TMED2/HECTD1/PPIL2/SEC23A/ARFRP1/CSK/RAB11A/EHD4/TGFB1/RANGRF/CD81/KRT18/IFNG/TMEM59/VAMP8/LRP1/ACSL3/PHAF1/LAMA5/PPFIA1/FLOT2/EPHB2/STXBP1/KIF13A/RDX/PREPL/EPHA2/RAB13/STAC/ARL6IP5/ANK2/PIK3R1/TPBG/EGFR/ITGB1/MMP14/APPL1/RER1/LDLRAP1/SPTBN4/AP2M1/ZDHHC3/GPER1/CDK5/TTC8/AMN/CDH2/KIF5B/PRKCE/BCL2L1/BSG/PDZK1/PACS1/ADIPOQ/CIB1/STAC3/CLN3/TNF/TNF/TNF/TNF/TNF/TNF/TNF/TNF/PIGW/LRP6/SQSTM1 | 84 |
| GO:0046879 | hormone secretion | 87/3662 | 275/15509 | 0.00134307 | 0.00609843 | 0.00366749 | BAD/CD38/CRY1/BTK/HFE/CASR/NNAT/KCNQ1/SIRT6/OPRK1/OXCT1/RAPGEF4/OSM/PCK2/SFRP1/TFR2/GATA3/PPP3CB/PSMD9/IFNG/PPARD/SNX4/PASK/PARK7/KDM5B/VAMP8/SPP1/CRHR1/SNX19/SERP1/CRY2/INHBA/SOX4/IL1B/NR1D1/LIF/PER2/HNF1A/GLUL/IL6/IL1RN/CCN3/CYP19A1/SMAD4/ENSA/REN/EPHA5/SLC16A2/CAMK2G/GLUD1/TCF7L2/FOXO1/GJA1/BMP6/INHBB/AIMP1/SLC9B2/GDF9/GPER1/TRPV6/CCDC186/PRKCE/FGG/FGA/BRSK2/LEP/FZD4/SMAD2/PTPN11/ADIPOQ/MAFA/PRKN/KCNJ11/PIM3/SELENOT/TNF/TNF/TNF/TNF/TNF/TNF/TNF/TNF/RASL10B/CCL5/CCL5/TRPV6 | 87 |
| GO:0007252 | I-kappaB phosphorylation | 14/3662 | 27/15509 | 0.0013488 | 0.00610653 | 0.00367236 | ERC1/TLR4/TLR3/CX3CR1/TLR7/TNF/TNF/CHUK/TNF/TNF/TNF/TNF/TNF/TNF | 14 |
| GO:0010971 | positive regulation of G2/M transition of mitotic cell cycle | 14/3662 | 27/15509 | 0.0013488 | 0.00610653 | 0.00367236 | CDC7/CDC25B/RAB11A/CCND1/FBXO5/HSPA2/CCNB1/APP/DTL/DBF4B/RRM1/CDK1/RCC2/PBX1 | 14 |
| GO:0035767 | endothelial cell chemotaxis | 14/3662 | 27/15509 | 0.0013488 | 0.00610653 | 0.00367236 | FGFR1/PRKD2/MET/HSPB1/SMOC2/NR4A1/KDR/CCN3/THBS1/FGF2/RAB13/NOTCH1/CXCL13/TMSB4X | 14 |
| GO:0045822 | negative regulation of heart contraction | 14/3662 | 27/15509 | 0.0013488 | 0.00610653 | 0.00367236 | PIK3CG/PDE4D/SPTBN4/ATP1A1/ATP2A2/TRPV1/TNF/TNF/TNF/TNF/TNF/TNF/TNF/TNF | 14 |
| GO:0051702 | biological process involved in interaction with symbiont | 38/3662 | 102/15509 | 0.00135042 | 0.00610942 | 0.0036741 | LTF/YTHDC2/CDC42/CCNK/SMARCB1/CTSG/VAPA/HSPA8/FN1/HDAC1/ARG1/TARDBP/APOE/SFTPD/HMGA2/EEF1A1/PF4/SAP30/MBL2/PSMC3/CX3CR1/PAIP1/CFL1/JUN/F2/CSF1R/PRKN/CARD9/IGF2R/ELANE/ZBED1/CCL5/CCL5/CCL4/CCL4/SMARCB1/ELANE/CCL4 | 38 |
| GO:1902115 | regulation of organelle assembly | 62/3662 | 185/15509 | 0.0013625 | 0.00615959 | 0.00370427 | IFT88/PHF23/SDCCAG8/SYNE2/RNF4/RHOA/SPAG5/VDAC3/GSK3B/CHMP5/SH3GLB1/KCTD17/HCK/CHMP4B/IL5/KAT2B/SNX4/SDC1/ELAPOR1/CNOT1/BECN1/STYXL1/CHMP1A/PRKAA1/TBC1D14/LCP1/ODF2/NUMA1/RDX/BBS4/SMAD4/ADAMTS16/PLK2/MSN/C9orf72/GSN/ARHGAP35/CSF2/ATMIN/PDCD6IP/NPTX1/CEP135/CHMP6/TMEM39A/MAPK15/NPM1/CDK10/DRG1/IL1RAP/SRC/RNF5/TNF/TNF/TNF/TNF/TNF/TNF/TNF/TNF/PIP4K2B/SEPTIN9/SPICE1 | 62 |
| GO:0010544 | negative regulation of platelet activation | 11/3662 | 19/15509 | 0.00137846 | 0.00621447 | 0.00373727 | CD9/PDGFB/SH2B3/APOE/PDGFRA/SERPINE2/ADAMTS18/PRKCD/NOS3/FGG/F2 | 11 |
| GO:0033005 | positive regulation of mast cell activation | 11/3662 | 19/15509 | 0.00137846 | 0.00621447 | 0.00373727 | GAB2/IL4R/GATA1/IL4/SNX4/VAMP8/NR4A3/NECTIN2/STXBP1/SYK/CRLF2 | 11 |
| GO:0060973 | cell migration involved in heart development | 11/3662 | 19/15509 | 0.00137846 | 0.00621447 | 0.00373727 | SNAI2/CDC42/BMP7/NDRG4/ENG/FOLR1/BVES/PDGFRB/FLRT3/NOTCH1/PITX2 | 11 |
| GO:0043280 | positive regulation of cysteine-type endopeptidase activity involved in apoptotic process | 43/3662 | 119/15509 | 0.00138586 | 0.00621447 | 0.00373727 | BAD/CASP10/FAS/BAK1/NGFR/RHOA/BAX/PYCARD/PDCD5/NOD1/CASP2/HSPE1/FASLG/TNFSF10/ANP32B/MTCH1/BCL2L10/PMAIP1/CCN1/ARL6IP5/GSN/BCL2L11/NODAL/GPER1/SYK/VCP/LGALS9/EIF2AK3/F2R/CARD9/HMGB1/DAPK1/MAP3K5/TNF/TNF/FIS1/TNF/TNF/TNF/TNF/TNF/TNF/PDCD6 | 43 |
| GO:0002291 | T cell activation via T cell receptor contact with antigen bound to MHC molecule on antigen presenting cell | 9/3662 | 14/15509 | 0.00138667 | 0.00621447 | 0.00373727 | ITGAL/ICAM1/LILRB1/CD81/LGALS9/LILRB1/LILRB1/LILRB1/LILRB1 | 9 |
| GO:0032741 | positive regulation of interleukin-18 production | 9/3662 | 14/15509 | 0.00138667 | 0.00621447 | 0.00373727 | GBP5/TNF/TNF/TNF/TNF/TNF/TNF/TNF/TNF | 9 |
| GO:0035507 | regulation of myosin-light-chain-phosphatase activity | 9/3662 | 14/15509 | 0.00138667 | 0.00621447 | 0.00373727 | ROCK1/TNF/TNF/TNF/TNF/TNF/TNF/TNF/TNF | 9 |
| GO:0046007 | negative regulation of activated T cell proliferation | 9/3662 | 14/15509 | 0.00138667 | 0.00621447 | 0.00373727 | FOXP3/ARG1/CASP3/LGALS9/LILRB4/PDCD1LG2/LILRB4/LILRB4/LILRB4 | 9 |
| GO:0072350 | tricarboxylic acid metabolic process | 9/3662 | 14/15509 | 0.00138667 | 0.00621447 | 0.00373727 | CS/ACO2/IDH3B/ASS1/ACLY/IREB2/GLUD1/IDH3A/IDH2 | 9 |
| GO:1903223 | positive regulation of oxidative stress-induced neuron death | 9/3662 | 14/15509 | 0.00138667 | 0.00621447 | 0.00373727 | TLR4/TNF/TNF/TNF/TNF/TNF/TNF/TNF/TNF | 9 |
| GO:1903721 | positive regulation of I-kappaB phosphorylation | 9/3662 | 14/15509 | 0.00138667 | 0.00621447 | 0.00373727 | CX3CR1/TNF/TNF/TNF/TNF/TNF/TNF/TNF/TNF | 9 |
| GO:2001204 | regulation of osteoclast development | 9/3662 | 14/15509 | 0.00138667 | 0.00621447 | 0.00373727 | TYROBP/LTF/LILRB1/NOTCH2/SLC9B2/LILRB1/LILRB1/LILRB1/LILRB1 | 9 |
| GO:0003170 | heart valve development | 26/3662 | 63/15509 | 0.0013929 | 0.00622886 | 0.00374593 | SNAI2/TNFRSF1B/PRDM1/TIE1/ROCK1/HECTD1/TGFB1/GATA3/BMPR1A/SOX4/BMP2/NOTCH2/SMAD6/RB1/SMAD4/CCN1/SLIT2/NOTCH1/TGFBR2/HEYL/NOS3/RBPJ/EFNA1/NKX2-5/SLIT3/MTOR | 26 |
| GO:0035019 | somatic stem cell population maintenance | 26/3662 | 63/15509 | 0.0013929 | 0.00622886 | 0.00374593 | MED17/SPI1/SMC1A/TP63/MED15/BMP7/SFRP1/BMPR1A/HES1/BCL9/SOX4/LIF/MED6/TAF5L/CUL4A/ZFP36L2/KLF10/NODAL/KIT/SKI/TAF6L/MED30/RBPJ/LIG4/NOG/BCL9L | 26 |
| GO:2000134 | negative regulation of G1/S transition of mitotic cell cycle | 26/3662 | 63/15509 | 0.0013929 | 0.00622886 | 0.00374593 | FHL1/CASP2/EZH2/CCL2/CCND1/PKD2/INHBA/CDKN1A/APC/RB1/CTDSP1/PLK2/PRMT2/RPL26/BRD7/WEE1/RFWD3/TRIAP1/CTDSP2/CACNB4/CHEK2/MUC1/KANK2/GIGYF2/PRKDC/PTEN | 26 |
| GO:0030593 | neutrophil chemotaxis | 37/3662 | 99/15509 | 0.00145113 | 0.00648458 | 0.00389971 | CD74/DNM1L/CCL22/CCL17/PIK3CG/C1QBP/CCL2/MDK/CCL20/CSF3R/IL1B/CCR7/RAC2/CCL21/SLIT2/CXCL13/ITGB2/CXCR1/PF4/SYK/NOD2/CXCL8/CCL11/BSG/CCL19/CXCR2/PDE4B/PPIA/DPP4/CCL5/CCL5/CCL4/CCL18/CCL4/CCL4/CCL18/CCL18 | 37 |
| GO:0032418 | lysosome localization | 30/3662 | 76/15509 | 0.00146574 | 0.00654043 | 0.0039333 | SPAG9/BTK/GAB2/C12orf4/STXBP2/IL4R/LAT2/MYH9/GATA1/KXD1/PIK3CG/RNF167/IL4/SNX4/VAMP8/NR4A3/RAC2/ARL8B/STXBP1/DEF8/SNAPIN/CPLX2/KIT/SYK/HPS6/BORCS7/LGALS9/KIF5B/MAP6/KLC2 | 30 |
| GO:1990849 | vacuolar localization | 30/3662 | 76/15509 | 0.00146574 | 0.00654043 | 0.0039333 | SPAG9/BTK/GAB2/C12orf4/STXBP2/IL4R/LAT2/MYH9/GATA1/KXD1/PIK3CG/RNF167/IL4/SNX4/VAMP8/NR4A3/RAC2/ARL8B/STXBP1/DEF8/SNAPIN/CPLX2/KIT/SYK/HPS6/BORCS7/LGALS9/KIF5B/MAP6/KLC2 | 30 |
| GO:0006473 | protein acetylation | 68/3662 | 207/15509 | 0.00149015 | 0.00664458 | 0.00399594 | NFYA/KMT2E/MED24/BAZ1B/SNAI2/FOXP3/NFYC/SPI1/MBD3/ACTB/GSK3B/ZMPSTE24/ATXN7L3/BRPF3/BAG6/SMARCB1/JADE3/GATA3/NAA40/ZNF451/KAT2B/SF3B1/PARK7/DR1/NAA50/MORF4L2/SOX4/DEK/YEATS4/LIF/PRKAA1/MYBBP1A/WBP2/TAF5L/EPC2/IRF4/ATAT1/BRCA2/SMAD4/OGT/KAT14/FOXO1/MBIP/SMARCA5/BRPF1/CTBP1/TAF6L/PYGO2/NAA15/BRD7/SETD5/TADA3/HCFC1/KAT5/MSL2/TAF7/MUC1/NOC2L/WDR5/TRRAP/BAG6/BAG6/BAG6/BAG6/BAG6/SMARCB1/TADA2A/PCGF2 | 68 |
| GO:0055123 | digestive system development | 49/3662 | 140/15509 | 0.00149185 | 0.00664739 | 0.00399762 | CPS1/ALX4/KCNQ1/PRDM1/FGFR2/TP63/GLI2/CHD8/SFRP1/HOXA5/CCKBR/NPHP3/WNT5A/HES1/ID2/SFRP5/NKX2-2/ALDH1A2/ASS1/PDGFRA/AHI1/EDNRB/HLX/RB1/CYP1A1/PDGFC/EGFR/NOTCH1/NODAL/KIT/TGFBR2/SHH/SLC4A2/CXCL8/SMAD2/FOXL1/TYMS/OXTR/YIPF6/EPHB3/SRC/TNF/TNF/TNF/TNF/TNF/TNF/TNF/TNF | 49 |
| GO:0072676 | lymphocyte migration | 42/3662 | 116/15509 | 0.00149634 | 0.0066626 | 0.00400677 | ITGAL/RHOA/TBX21/ICAM1/ABL1/CCL22/CCL17/PYCARD/IL27RA/PIK3CG/GATA3/CXCL12/CCL2/NEDD9/WNT5A/CCL20/ZAP70/ITGA4/PADI2/PTK2B/CCR7/CCL21/APP/ABL2/MSN/CXCL13/FADD/S1PR1/CCL11/CCL19/CYP7B1/PLEC/FUT4/ITGB3/CCL5/CCL5/CCL4/CCL18/CCL4/CCL4/CCL18/CCL18 | 42 |
| GO:0002221 | pattern recognition receptor signaling pathway | 57/3662 | 168/15509 | 0.00150767 | 0.00670338 | 0.0040313 | BTK/LTF/BIRC3/CYBA/PUM2/WDFY1/ESR1/NFKBIA/CD40/RIOK3/TLR8/MEFV/PYCARD/NOD1/C1QBP/MAP2K6/TNFAIP3/NR1D1/IRF3/TRAF3/AP3B1/PTPN22/CD36/TLR4/IRF4/DDX60/SLC15A4/ARRB2/APPL1/NLRX1/CLPB/GFI1/MAPKAPK2/TLR3/MBL2/NOD2/TNIP2/CD14/PRKCE/RELA/LACC1/IRAK1/HMGB1/TLR7/TNF/TNF/TNF/TNF/TNF/TNF/TNF/TNF/NAIP/LSM14A/NAIP/NAIP/ITCH | 57 |
| GO:0006839 | mitochondrial transport | 57/3662 | 168/15509 | 0.00150767 | 0.00670338 | 0.0040313 | BAD/AGK/TOMM34/BAK1/VPS35/CSNK2A2/LMAN1/GSK3B/SLC25A24/BAX/TMEM14A/SH3GLB1/TIMM13/SAMM50/GZMB/TIMM9/SLC25A14/PDCD5/GSK3A/MAPK8/PPIF/GRPEL1/MFN2/RAC2/BCL2L2/TIMM10B/PRKAA1/ABCB10/NMT1/PMAIP1/SAE1/IMMP1L/TIMM8B/BAG3/BCL2L11/THEM4/BAP1/SLC25A46/MFF/NPTX1/BCL2L1/TOMM20/CNP/ATG13/TOMM5/SLC25A10/PRKN/UBE2L3/FZD9/UBL5/HSPA1L/HSPA1L/FIS1/HSPA1L/HSPA1L/HSPA1L/TIMM23 | 57 |
| GO:0035924 | cellular response to vascular endothelial growth factor stimulus | 24/3662 | 57/15509 | 0.00150978 | 0.00670795 | 0.00403405 | DCN/FLT4/ATP2B4/FLT1/PRKD2/HSPB1/MAPK14/SMOC2/IL12B/PDGFRB/NRP2/PGF/FLT3/NR4A1/KDR/PDGFRA/SPRY2/NOTCH1/VEGFC/VCAM1/MAPKAPK2/RELA/ERN1/PTP4A3 | 24 |
| GO:0006109 | regulation of carbohydrate metabolic process | 55/3662 | 161/15509 | 0.00151431 | 0.00672328 | 0.00404326 | BAD/SLC4A1/CRY1/IGF1/PDK3/SIRT6/DUSP12/GSK3B/ZMPSTE24/P2RX7/PDGFB/TGFB1/GSK3A/IFNG/KAT2B/PASK/LEPR/PPP1R3C/PTK2B/CD244/DYRK2/CBFA2T3/SESN2/PRKAA1/KHK/EGF/PMAIP1/APP/ARNT/IGFBP3/OGT/SOGA1/FOXO1/RANBP2/ADIPOR1/SLC2A6/GPER1/NNMT/GPD1/DDIT4/PTAFR/PRKCE/PGAM1/MST1/LEP/PTPN2/ERFE/ADIPOQ/PHLDA2/PRKN/USP7/WDR5/SRC/MTOR/EIF6 | 55 |
| GO:0043543 | protein acylation | 79/3662 | 247/15509 | 0.00155046 | 0.00687886 | 0.00413682 | NFYA/KMT2E/MED24/BAZ1B/SNAI2/ZDHHC6/FOXP3/NFYC/SPI1/MBD3/ACTB/GSK3B/ZMPSTE24/ATXN7L3/DLD/BRPF3/BAG6/SMARCB1/JADE3/GATA3/NAA40/ZNF451/KAT2B/SF3B1/PARK7/DR1/NAA50/MORF4L2/SOX4/DEK/YEATS4/LIF/PRKAA1/MYBBP1A/WBP2/TAF5L/GLUL/EPC2/ZDHHC4/NMT1/IRF4/ATAT1/PPM1B/BRCA2/SMAD4/OGT/KAT14/FOXO1/MBIP/NMT2/SMARCA5/BRPF1/CTBP1/ZDHHC12/TAF6L/PYGO2/ZDHHC3/NAA15/BRD7/SETD5/TADA3/HCFC1/KAT5/MSL2/ZDHHC21/TAF7/MUC1/NOC2L/WDR5/TRRAP/ZDHHC18/BAG6/BAG6/BAG6/BAG6/BAG6/SMARCB1/TADA2A/PCGF2 | 79 |
| GO:0015807 | L-amino acid transport | 29/3662 | 73/15509 | 0.00155334 | 0.00688179 | 0.00413859 | SLC11A1/SLC7A8/SLC25A15/SLC38A7/SLC7A6/SLC1A5/ARG1/PER2/SERINC3/SLC7A1/SLC47A1/ARL6IP5/ITGB1/SLC38A10/SFXN1/SLC43A2/SLC3A2/SLC38A9/KCNJ10/CLN3/SLC25A29/TNF/TNF/TNF/TNF/TNF/TNF/TNF/TNF | 29 |
| GO:0070988 | demethylation | 29/3662 | 73/15509 | 0.00155334 | 0.00688179 | 0.00413859 | KDM1A/KDM4A/KDM2B/ALKBH5/CYP2D6/APEX1/CYP3A5/GATA3/AICDA/KDM3A/KDM5B/KDM3B/USP9X/TET1/TDG/CYP1A2/CYP3A4/RIOX1/RIOX2/JMJD1C/KDM2A/USP7/TET3/PHF2/CYP2D6/CYP2D6/CYP2D6/CYP2D6/CYP2D6 | 29 |
| GO:0055008 | cardiac muscle tissue morphogenesis | 23/3662 | 54/15509 | 0.00156156 | 0.00690833 | 0.00415455 | PKP2/FGFR2/LRP2/FKBP1A/DSP/SMAD7/TGFB1/TGFBR1/ENG/BMPR1A/WNT5A/TNNT2/BMP2/TNNI3/SMAD4/NOTCH1/POU4F1/TNNI1/RBPJ/ZFPM2/S1PR1/NKX2-5/NOG | 23 |
| GO:0060425 | lung morphogenesis | 23/3662 | 54/15509 | 0.00156156 | 0.00690833 | 0.00415455 | FGFR2/CDC42/LAMA1/HOXA5/LIF/AP3B1/KRAS/SPRY2/NKX2-1/NODAL/TGFBR2/SHH/DAG1/NOG/WNT7B/TNF/TNF/TNF/TNF/TNF/TNF/TNF/TNF | 23 |
| GO:0043062 | extracellular structure organization | 94/3662 | 302/15509 | 0.00156334 | 0.00691126 | 0.00415631 | NOX1/TNFRSF1B/COL23A1/TIE1/FBLN1/ITGA8/ADAMTS2/MMP2/NID2/ABL1/MMP11/CTSG/MMP9/FERMT1/LAMA1/ERCC2/TGFB1/HAS1/DNAJB6/TGFBR1/ENG/KAZALD1/SMOC2/NPHP3/TEX14/FMOD/RECK/LRP1/BMP2/COLGALT1/PXDN/COL5A1/MYH11/LOXL2/PDGFRA/LAMC1/LCP1/IL6/ADAMTS7/MMP7/CYP1B1/COL2A1/RB1/ADAMTS17/FURIN/ADAMTS18/FKBP10/APP/CCN1/ADAMTS16/NOTCH1/GAS2/SERPINH1/ITGB1/ABI3BP/ADAMTS1/ADAMTSL3/MMP14/ADAMTS4/RUNX1/ADAMTS13/OLFML2B/MELTF/EGFLAM/TNFRSF11B/BMP1/ANTXR1/LAMB2/DAG1/ANXA2/COL18A1/TMPRSS6/THSD4/COL14A1/MMP1/COL27A1/COL13A1/SLC2A10/ELANE/COL4A6/DPP4/COL11A2/TNF/TNF/TNF/TNF/TNF/TNF/TNF/TNF/ITGB3/MYH11/ELANE/ADAMTS13 | 94 |
| GO:0001893 | maternal placenta development | 16/3662 | 33/15509 | 0.0015702 | 0.00693171 | 0.00416861 | PRDM1/DAZAP1/TMED2/PTN/CYP27B1/VDR/PPARD/ASH1L/SPP1/LIF/MEN1/PARP1/NODAL/STC1/BSG/EPOR | 16 |
| GO:0042634 | regulation of hair cycle | 16/3662 | 33/15509 | 0.0015702 | 0.00693171 | 0.00416861 | CDH3/NGFR/FERMT1/WNT5A/NUMA1/SMAD4/MYSM1/TERT/TNF/TNF/TNF/TNF/TNF/TNF/TNF/TNF | 16 |
| GO:0010821 | regulation of mitochondrion organization | 46/3662 | 130/15509 | 0.00158799 | 0.00700522 | 0.00421282 | BAD/DCN/IGF1/HGF/ZDHHC6/BAK1/VPS35/CSNK2A2/GSK3B/BAX/DNM1L/TMEM14A/GZMB/MMP9/TSC2/PYCARD/PDCD5/GSK3A/MAPK8/PPIF/PARK7/CLU/IAPP/TNFSF10/KDR/BCL2L2/HRK/NMT1/ARRB2/PMAIP1/BCL2L11/LMNA/OMA1/GPER1/FXN/MFF/PRELID1/TRIAP1/BCL2L1/MIEF2/PRKN/FZD9/FIS1/PISD/PGAM5/SQSTM1 | 46 |
| GO:0060537 | muscle tissue development | 112/3662 | 369/15509 | 0.00158912 | 0.00700523 | 0.00421282 | IFRD1/IGF1/BARX2/PKP2/ERBB3/MYLK/MAP2K4/FGFR2/RHOA/SIRT2/PITX1/CDC42/SIRT6/ACTN2/ITGA8/TP73/LRP2/ZMPSTE24/NOX4/FKBP1A/MYL6/DSP/ABL1/BMP7/SMAD7/NDRG4/NPRL3/EYA1/TGFB1/MYH14/HAMP/GSK3A/MTPN/TGFBR1/ENG/PPP3CB/BMPR1A/DKK1/RPS6KB1/DDX5/CNTNAP1/HLF/MAPK14/BVES/SMAD5/PDGFRB/WNT5A/FHL2/ID2/BCL9/TNNT2/PKD2/EGR1/EGR2/NR4A1/OBSL1/BMP2/PRMT1/HOXD9/ALDH1A2/SOX15/TNNI3/RARA/PRKAA1/MYH11/KRAS/NOTCH2/PDGFRA/HLX/FGF2/RB1/ARRB2/SMAD4/GTF3C5/NOTCH1/ITGB1/POU4F1/GJA1/SKI/TNNI1/RUNX1/BTG2/LMNA/MAML1/SELENON/ATF3/PDLIM5/POGLUT1/TGFBR2/HEYL/SAP30/SHH/CDK5/FRS2/RBPJ/ZFPM2/CDK1/FOS/S1PR1/PLEC/CALR/SLC8A1/NKX2-5/NOG/STAC3/BCL9L/P2RX2/ARID2/PAX5/MTOR/MYH11/PTEN | 112 |
| GO:0003229 | ventricular cardiac muscle tissue development | 22/3662 | 51/15509 | 0.00160645 | 0.00706656 | 0.00424971 | PKP2/FGFR2/LRP2/ZMPSTE24/FKBP1A/DSP/SMAD7/TGFB1/TGFBR1/ENG/BMPR1A/ID2/TNNT2/TNNI3/SMAD4/NOTCH1/POU4F1/TNNI1/RBPJ/ZFPM2/NKX2-5/NOG | 22 |
| GO:0042306 | regulation of protein import into nucleus | 22/3662 | 51/15509 | 0.00160645 | 0.00706656 | 0.00424971 | CDH1/IPO5/HYAL2/SIRT6/MAVS/HSP90AB1/FERMT1/TGFB1/ZPR1/IFNG/MAPK14/TARDBP/CD36/MDFIC/PIK3R1/BAG3/PRKCD/SHH/CHP2/PKIG/CDK1/LEP | 22 |
| GO:0071320 | cellular response to cAMP | 22/3662 | 51/15509 | 0.00160645 | 0.00706656 | 0.00424971 | KDM1A/CPS1/HSPA5/KCNQ1/APEX1/GATA1/PIK3CG/AHR/RAPGEF1/PKD2/ASS1/FDX1/CYP1B1/APP/DMTN/STC1/INHBB/GPD1/PTAFR/ADIPOQ/SLC8A1/ZFP36L1 | 22 |
| GO:0003176 | aortic valve development | 17/3662 | 36/15509 | 0.00163089 | 0.00715883 | 0.0043052 | SNAI2/TNFRSF1B/TIE1/ROCK1/TGFB1/GATA3/BMP2/SMAD6/RB1/SLIT2/NOTCH1/HEYL/NOS3/RBPJ/EFNA1/NKX2-5/SLIT3 | 17 |
| GO:0010922 | positive regulation of phosphatase activity | 17/3662 | 36/15509 | 0.00163089 | 0.00715883 | 0.0043052 | ROCK1/PTPRC/PPP1R15A/HSP90AB1/CD33/IFNG/PDGFRB/PTPA/BMP2/CALM2/GNA12/PPP1R15B/CALM3/CHP2/MAGI2/MTOR/PTPRC | 17 |
| GO:0044060 | regulation of endocrine process | 17/3662 | 36/15509 | 0.00163089 | 0.00715883 | 0.0043052 | CRY1/OPRK1/KDM5B/SPP1/CRHR1/CRY2/INHBA/CYP19A1/SMAD4/REN/GJA1/BMP6/INHBB/GDF9/LEP/PTPN11/F2R | 17 |
| GO:0019915 | lipid storage | 32/3662 | 83/15509 | 0.00164201 | 0.00718177 | 0.00431899 | CRY1/HEXB/SOAT1/APOB/NFKBIA/SQLE/PPARD/CRY2/IL1B/C3/APOE/CD36/IL6/ITGAV/OSBPL11/ZFYVE1/STAT5B/RNF213/LEP/PTPN2/LPL/GM2A/TNF/TNF/TNF/TNF/TNF/TNF/TNF/TNF/PISD/ITGB3 | 32 |
| GO:0001954 | positive regulation of cell-matrix adhesion | 21/3662 | 48/15509 | 0.00164213 | 0.00718177 | 0.00431899 | ROCK1/GSK3B/CEACAM6/ABL1/FERMT1/SFRP1/TEK/PTK2B/CCR7/RRAS/KDR/CD36/CCL21/WNT4/DISC1/PLEKHA2/LIMS1/DAG1/CSF1/CIB1/ITGB3 | 21 |
| GO:0043507 | positive regulation of JUN kinase activity | 21/3662 | 48/15509 | 0.00164213 | 0.00718177 | 0.00431899 | AXIN1/DKK1/FZD10/WNT5A/PTK2B/MAP3K12/TNFRSF11A/DVL3/SYK/CCL19/FZD4/ERN1/MAP3K5/TNF/TNF/TNF/TNF/TNF/TNF/TNF/TNF | 21 |
| GO:0045058 | T cell selection | 21/3662 | 48/15509 | 0.00164213 | 0.00718177 | 0.00431899 | CD4/CD74/FOXP3/RHOA/TBX21/PTPRC/IL12RB1/GATA3/IL12B/ZAP70/CCR7/BCL11B/IL6/IRF4/IL6R/SHH/SYK/PTPN2/CD28/MTOR/PTPRC | 21 |
| GO:1901991 | negative regulation of mitotic cell cycle phase transition | 54/3662 | 158/15509 | 0.00164249 | 0.00718177 | 0.00431899 | FHL1/NDC80/ZW10/BIRC5/CDC6/RBBP8/NBN/CASP2/EZH2/CCL2/CCND1/FBXO5/CCNG1/RAD50/CDC20/PKD2/TEX14/INHBA/CDKN1A/CCNB1/CDCA8/APC/NABP2/RB1/DTL/INTS3/CTDSP1/PLK2/SPC25/ZFP36L2/PRMT2/BRSK1/MRNIP/RPL26/BRD7/WEE1/RFWD3/BUB1/AVEN/CDK1/TRIAP1/NABP1/ZWILCH/CTDSP2/AURKB/CACNB4/CHEK2/FOXO4/MUC1/ZFP36L1/KANK2/GIGYF2/PRKDC/PTEN | 54 |
| GO:0050766 | positive regulation of phagocytosis | 28/3662 | 70/15509 | 0.00164307 | 0.00718177 | 0.00431899 | BTK/SLC11A1/CYBA/FCGR2B/PTPRC/PYCARD/CCL2/IFNG/IL1B/C3/SFTPD/CD36/SOD1/IL2RG/MERTK/MBL2/NOD2/CALR/CD47/TNF/TNF/TNF/TNF/TNF/TNF/TNF/TNF/PTPRC | 28 |
| GO:0010799 | regulation of peptidyl-threonine phosphorylation | 18/3662 | 39/15509 | 0.00166414 | 0.00724831 | 0.00435901 | SIRT2/UBE2K/BMP7/SMAD7/AXIN1/TGFB1/GSK3A/WNT5A/CHI3L1/SPRY2/EGF/APP/CALM2/PARD3/DMTN/CALM3/DDIT4/SPRED2 | 18 |
| GO:0030261 | chromosome condensation | 18/3662 | 39/15509 | 0.00166414 | 0.00724831 | 0.00435901 | BAZ1B/ACIN1/SMC4/H1-3/CHMP1A/TOP2A/NUSAP1/NCAPG2/HMGA2/SMARCA5/H3-3A/GPER1/H1-4/CDK1/BANF1/KMT5A/H1-2/H1-0 | 18 |
| GO:0045687 | positive regulation of glial cell differentiation | 18/3662 | 39/15509 | 0.00166414 | 0.00724831 | 0.00435901 | TNFRSF1B/TP73/TGFB1/PTN/MDK/HES1/ID2/HDAC1/CXCR4/EGR2/NKX2-2/BMP2/LIF/SERPINE2/NOTCH1/SHH/DAG1/MTOR | 18 |
| GO:0070232 | regulation of T cell apoptotic process | 18/3662 | 39/15509 | 0.00166414 | 0.00724831 | 0.00435901 | ST3GAL1/ARG2/P2RX7/PRKD2/JAK3/WNT5A/GPAM/BCL11B/BCL2L11/TSC22D3/RAG1/FADD/LGALS9/PRELID1/EFNA1/PTCRA/CCL5/CCL5 | 18 |
| GO:0090317 | negative regulation of intracellular protein transport | 18/3662 | 39/15509 | 0.00166414 | 0.00724831 | 0.00435901 | SP100/DERL2/LMAN1/SIRT6/RANGAP1/FERMT1/PARK7/CD36/MDFIC/BAG3/DMTN/CDK5/PKIG/YOD1/ADIPOQ/SVIP/UBE2J1/GDI1 | 18 |
| GO:0071621 | granulocyte chemotaxis | 43/3662 | 120/15509 | 0.0016741 | 0.00726753 | 0.00437057 | CD74/DNM1L/CCL22/CCL17/PIK3CG/C1QBP/CCL2/MDK/IL4/CCL20/CSF3R/IL1B/CCR7/RAC2/CCL21/THBS1/SLIT2/CXCL13/ITGB2/CXCR1/PF4/SYK/NOD2/PTK2/CXCL8/SCG2/CCL11/BSG/CCL19/CXCR2/CSF1R/CSF1/PDE4B/PPIA/DPP4/CCL5/CCL5/CCL4/CCL18/CCL4/CCL4/CCL18/CCL18 | 43 |
| GO:0001937 | negative regulation of endothelial cell proliferation | 19/3662 | 42/15509 | 0.00167442 | 0.00726753 | 0.00437057 | NGFR/APOH/FLT1/TGFBR1/CCL2/IL12B/STAT1/APOE/THBS1/AIMP1/SCG2/TNF/TNF/TNF/TNF/TNF/TNF/TNF/TNF | 19 |
| GO:0051180 | vitamin transport | 19/3662 | 42/15509 | 0.00167442 | 0.00726753 | 0.00437057 | NPC1L1/SLC2A3/SLC46A1/LRP2/SLC23A2/ABCC1/FOLR1/SLC2A1/SLC19A2/ABCG2/CBLIF/SLC2A6/AMN/SLC2A14/SLC19A1/TCN2/SLC52A2/SLC2A10/ABCC1 | 19 |
| GO:1903214 | regulation of protein targeting to mitochondrion | 19/3662 | 42/15509 | 0.00167442 | 0.00726753 | 0.00437057 | CSNK2A2/LMAN1/SH3GLB1/PDCD5/GSK3A/RAC2/PRKAA1/SAE1/BAG3/BAP1/ATG13/PRKN/UBE2L3/UBL5/HSPA1L/HSPA1L/HSPA1L/HSPA1L/HSPA1L | 19 |
| GO:1990089 | response to nerve growth factor | 19/3662 | 42/15509 | 0.00167442 | 0.00726753 | 0.00437057 | TAC1/HSPA5/CSTF2/RAPGEF1/CALCA/HES1/FOXO3/ID1/NGF/DYNC1LI2/EIF4A3/CSNK1D/APP/NTRK2/BDNF/CIB1/MAGI2/TRPV1/NTRK1 | 19 |
| GO:0007369 | gastrulation | 63/3662 | 190/15509 | 0.00168567 | 0.00729177 | 0.00438514 | HOXA11/ITGA3/PAF1/LAMA3/FGFR2/PRKACA/ITGA8/MMP2/DLD/MMP9/BMP7/ARFRP1/AXIN1/EYA1/SFRP1/GPI/DVL1/BMPR1A/DKK1/WNT3/WNT5B/MACROH2A1/NPHP3/WNT5A/ITGA4/FN1/ZBTB17/TGIF2/NR4A3/INHBA/TWSG1/COL5A1/IL10/IL1RN/DUSP5/ITGAV/ARMC5/SMAD4/EPHA2/HMGA2/ITGB1/GJA1/NODAL/MMP14/DUSP2/ITGB2/POGLUT1/TGFBR2/FRS2/DAG1/SMAD2/GRB2/ADIPOQ/SETD2/NOG/NF2/MBP/TXNRD1/ITGB3/WNT3/WNT3/GPI/PRKACA | 63 |
| GO:0003159 | morphogenesis of an endothelium | 12/3662 | 22/15509 | 0.00168706 | 0.00729177 | 0.00438514 | RHOA/PRKD2/CXCR4/CCM2/ITGAX/RHOB/RBPJ/CSNK2B/CSNK2B/CSNK2B/CSNK2B/CSNK2B | 12 |
| GO:0043302 | positive regulation of leukocyte degranulation | 12/3662 | 22/15509 | 0.00168706 | 0.00729177 | 0.00438514 | GAB2/IL4R/GATA1/IL4/SNX4/VAMP8/STXBP1/ITGB2/SYK/PTAFR/ITGAM/CD177 | 12 |
| GO:0060065 | uterus development | 12/3662 | 22/15509 | 0.00168706 | 0.00729177 | 0.00438514 | HOXA11/HOXA9/ESR1/GATA3/WNT5A/ASH1L/KDM5B/CYP19A1/GREB1L/SMAD4/SRC/HOXA10 | 12 |
| GO:0061154 | endothelial tube morphogenesis | 12/3662 | 22/15509 | 0.00168706 | 0.00729177 | 0.00438514 | RHOA/PRKD2/CXCR4/CCM2/ITGAX/RHOB/RBPJ/CSNK2B/CSNK2B/CSNK2B/CSNK2B/CSNK2B | 12 |
| GO:0098712 | L-glutamate import across plasma membrane | 12/3662 | 22/15509 | 0.00168706 | 0.00729177 | 0.00438514 | PER2/ARL6IP5/ITGB1/KCNJ10/TNF/TNF/TNF/TNF/TNF/TNF/TNF/TNF | 12 |
| GO:0033143 | regulation of intracellular steroid hormone receptor signaling pathway | 27/3662 | 67/15509 | 0.00173425 | 0.00749052 | 0.00450467 | KDM1A/CRY1/RNF14/UFL1/RHOA/TP63/PIAS2/SFRP1/DDX5/PARK7/HDAC1/CRY2/PKN1/CNOT1/WBP2/CARM1/PARP1/CNOT9/NODAL/PRMT2/HEYL/TRIM68/CYP7B1/CALR/SRC/KANK2/PAGR1 | 27 |
| GO:0051225 | spindle assembly | 40/3662 | 110/15509 | 0.00174349 | 0.00752519 | 0.00452552 | RNF4/RHOA/SMC1A/MLH1/SPAG5/NDC80/PIBF1/CHMP5/TPX2/BIRC5/KIF4A/MYBL2/CHMP4B/RAB11A/ARHGEF10/BCCIP/SMC3/FBXO5/CDC20/CHMP1A/CDCA8/NUMA1/KIF23/HAUS2/CSNK1D/MAP9/MAPRE2/GOLGA2/CHMP6/AURKB/MAPK15/CEP63/CHEK2/DRG1/TUBB/CCDC69/HAUS3/KIFC1/LSM14A/SPICE1 | 40 |
| GO:0051053 | negative regulation of DNA metabolic process | 47/3662 | 134/15509 | 0.00175058 | 0.00755051 | 0.00454074 | PARP3/FOXP3/SMG6/MLH1/XRCC5/HNRNPC/CDC6/MSH2/TFIP11/NBN/GATA3/RECQL5/FBXO5/RAD50/BCL6/XRN1/PDS5A/SHLD2/H1-3/CDKN1A/AUNIP/POT1/NDFIP1/MEN1/HNRNPA1/SMARCAL1/BRCA2/PIF1/PARP1/RADX/HMGA2/S100A11/RNF169/ZNF91/NUDT16L1/H1-4/EXOSC10/DCP2/RMI2/MAGEF1/ADIPOQ/H1-2/H1-0/SRC/TEN1/RTEL1/TINF2 | 47 |
| GO:0030509 | BMP signaling pathway | 51/3662 | 148/15509 | 0.00178079 | 0.00767377 | 0.00461487 | ITGA3/HFE/HIPK2/LRP2/ABL1/BMP7/SMAD7/SFRP1/TGFB1/SFRP4/ENG/BMPR1A/DKK1/DDX5/SMAD5/WNT5A/HES1/SFRP5/EGR1/USP9X/RUNX2/BMP2/KDR/TWSG1/GDF15/NOTCH2/NUMA1/SORL1/SMAD6/TOB1/RNF165/SMAD4/CCN1/NOTCH1/CRIM1/BMP6/NODAL/SKI/GDF9/ELAPOR2/HTRA1/RBPJ/RGMB/SMAD2/RGMA/NOG/TMPRSS6/FAM83G/TRIM33/CRIM1/ZNF8 | 51 |
| GO:0046890 | regulation of lipid biosynthetic process | 53/3662 | 155/15509 | 0.00178163 | 0.00767377 | 0.00461487 | MBTPS2/SNAI2/CD74/H6PD/DDX20/ACADVL/PIBF1/APOB/PDGFB/ASAH1/CYP27B1/IFNG/PDE8B/IL1A/EGR1/ORMDL2/RAB38/ACSL3/IL1B/C3/BMP2/NR1D1/APOE/PRKAA1/IGF1R/ARMC5/ASXL3/SOD1/CCN1/ERLIN2/BMP6/WNT4/GFI1/CAPN2/ATP1A1/PRKCD/GPER1/ABCA3/ORMDL3/KAT5/LEP/KLHL25/AKR1C3/MTOR/TNF/TNF/TNF/TNF/TNF/TNF/TNF/TNF/EIF6 | 53 |
| GO:0010769 | regulation of cell morphogenesis involved in differentiation | 34/3662 | 90/15509 | 0.00179472 | 0.00771407 | 0.00463911 | PAFAH1B1/PKP2/CDC42/ST6GAL1/FBLN1/ABL1/OLFM4/C1QBP/MDK/CORO1C/NEDD9/DBN1/MPL/OBSL1/EPHB2/DBNL/ACTR2/DMTN/TBC1D24/MELTF/PTK2/LIMS1/FGG/FGA/RCC2/CALR/CNTN2/SS18L1/CIB1/SPRY4/GPRASP3/PRKDC/CUX1/ITGB3 | 34 |
| GO:0050886 | endocrine process | 34/3662 | 90/15509 | 0.00179472 | 0.00771407 | 0.00463911 | NOX1/CRY1/CYBA/KCNQ1/RHOA/OPRK1/CTSG/GATA3/KDM5B/SPP1/CRHR1/CRY2/INHBA/IL1B/KRAS/EDNRB/CYP19A1/ENPEP/SMAD4/REN/CORIN/GJA1/BMP6/INHBB/GDF9/NOS3/TRPV6/LEP/FZD4/PTPN11/OXTR/F2R/RASL10B/TRPV6 | 34 |
| GO:1905818 | regulation of chromosome separation | 34/3662 | 90/15509 | 0.00179472 | 0.00771407 | 0.00463911 | CDC27/ARID1B/CSNK2A2/ACTB/NDC80/ZW10/ANAPC5/BIRC5/CDC6/BCL7C/SMARCB1/SMARCD2/BCL7A/FBXO5/SMC4/CDC20/ARID1A/TEX14/CCNB1/CDCA8/APC/NUMA1/CENPE/RB1/NCAPG2/SPC25/BRD7/BUB1/ZWILCH/AURKB/MAPK15/PLSCR1/ARID2/SMARCB1 | 34 |
| GO:0001838 | embryonic epithelial tube formation | 42/3662 | 117/15509 | 0.00180976 | 0.0077733 | 0.00467473 | PRKACA/TULP3/LRP2/TMED2/KDM2B/HECTD1/ABL1/CECR2/MTHFD1/BMP7/TSC2/SFRP1/TGFB1/DVL1/GATA3/FOLR1/NPHP3/WNT5A/MTHFD1L/SOX4/RARA/BBS4/NODAL/SKI/ARHGAP35/DVL3/WNT4/VANGL2/CASP3/SEMA4C/RARG/GLMN/SETD2/RGMA/NOG/BRD2/TCTN1/BRD2/BRD2/BRD2/BRD2/PRKACA | 42 |
| GO:0045911 | positive regulation of DNA recombination | 26/3662 | 64/15509 | 0.00182602 | 0.00783771 | 0.00471346 | TBX21/ACTB/MLH1/PTPRC/FUS/MSH2/CD40/RBBP8/ERCC2/TGFB1/EXOSC3/NSD2/IL4/SHLD2/MORF4L2/YEATS4/EPC2/ACTR2/PARP1/MRNIP/TNFSF13/KAT5/CD28/ARID2/TRRAP/PTPRC | 26 |
| GO:0002357 | defense response to tumor cell | 8/3662 | 12/15509 | 0.00186631 | 0.0079501 | 0.00478105 | DLEC1/SPI1/TNFRSF10B/RBMS3/PRDX2/RELA/PRF1/DAPK1 | 8 |
| GO:0006983 | ER overload response | 8/3662 | 12/15509 | 0.00186631 | 0.0079501 | 0.00478105 | HSPA5/GSK3B/CCDC47/TMCO1/BCL2L11/PPP1R15B/EIF2AK3/DDIT3 | 8 |
| GO:0009235 | cobalamin metabolic process | 8/3662 | 12/15509 | 0.00186631 | 0.0079501 | 0.00478105 | ABCC1/MTR/CBLIF/MMAB/AMN/MMADHC/TCN2/ABCC1 | 8 |
| GO:0010835 | regulation of protein ADP-ribosylation | 8/3662 | 12/15509 | 0.00186631 | 0.0079501 | 0.00478105 | HPF1/ADNP/IFNG/KAT2B/WARS1/SPINDOC/BANF1/TINF2 | 8 |
| GO:0032268 | regulation of cellular protein metabolic process | 8/3662 | 12/15509 | 0.00186631 | 0.0079501 | 0.00478105 | VPS35/BIRC5/BIRC7/UBL7/APP/NAIP/NAIP/NAIP | 8 |
| GO:0033690 | positive regulation of osteoblast proliferation | 8/3662 | 12/15509 | 0.00186631 | 0.0079501 | 0.00478105 | LTF/ABL1/GATA1/BMP2/ITGAV/IGF1R/CCN1/ITGB3 | 8 |
| GO:0051573 | negative regulation of histone H3-K9 methylation | 8/3662 | 12/15509 | 0.00186631 | 0.0079501 | 0.00478105 | KDM1A/KDM4A/DNMT3B/SMARCB1/KDM3A/DNMT1/PAX5/SMARCB1 | 8 |
| GO:0061046 | regulation of branching involved in lung morphogenesis | 8/3662 | 12/15509 | 0.00186631 | 0.0079501 | 0.00478105 | TNF/TNF/TNF/TNF/TNF/TNF/TNF/TNF | 8 |
| GO:0070431 | nucleotide-binding oligomerization domain containing 2 signaling pathway | 8/3662 | 12/15509 | 0.00186631 | 0.0079501 | 0.00478105 | NFKBIA/TNFAIP3/PTPN22/TLR4/SLC15A4/NOD2/RELA/LACC1 | 8 |
| GO:1900103 | positive regulation of endoplasmic reticulum unfolded protein response | 8/3662 | 12/15509 | 0.00186631 | 0.0079501 | 0.00478105 | BAK1/BAX/XBP1/TMEM33/PIK3R1/BCL2L11/PTPN2/ERN1 | 8 |
| GO:1902947 | regulation of tau-protein kinase activity | 8/3662 | 12/15509 | 0.00186631 | 0.0079501 | 0.00478105 | HGF/HSP90AB1/DKK1/IFNG/EGR1/CLU/SORL1/RB1 | 8 |
| GO:0010829 | negative regulation of glucose transmembrane transport | 13/3662 | 25/15509 | 0.00193257 | 0.00819294 | 0.00492709 | SIRT6/GSK3A/IL1B/PEA15/LEP/TNF/TNF/TNF/TNF/TNF/TNF/TNF/TNF | 13 |
| GO:0032891 | negative regulation of organic acid transport | 13/3662 | 25/15509 | 0.00193257 | 0.00819294 | 0.00492709 | THBS1/ARL6IP5/SLC43A2/LEP/TNF/TNF/FIS1/TNF/TNF/TNF/TNF/TNF/TNF | 13 |
| GO:0033137 | negative regulation of peptidyl-serine phosphorylation | 13/3662 | 25/15509 | 0.00193257 | 0.00819294 | 0.00492709 | HGF/BAK1/BAX/RASSF2/SMAD7/DKK1/PDE4D/GADD45A/CNKSR3/DMTN/DDIT4/INPP5J/PTEN | 13 |
| GO:0045048 | protein insertion into ER membrane | 13/3662 | 25/15509 | 0.00193257 | 0.00819294 | 0.00492709 | SEC61A1/BAG6/UBL4A/SGTA/CCDC47/EMC3/EMC4/EMC10/BAG6/BAG6/BAG6/BAG6/BAG6 | 13 |
| GO:0045830 | positive regulation of isotype switching | 13/3662 | 25/15509 | 0.00193257 | 0.00819294 | 0.00492709 | TBX21/MLH1/PTPRC/MSH2/CD40/TGFB1/EXOSC3/NSD2/IL4/SHLD2/TNFSF13/CD28/PTPRC | 13 |
| GO:0060512 | prostate gland morphogenesis | 13/3662 | 25/15509 | 0.00193257 | 0.00819294 | 0.00492709 | FGFR2/TP63/MMP2/ESR1/BMP7/SFRP1/WNT5A/NOTCH1/SHH/FRS2/CYP7B1/RARG/NOG | 13 |
| GO:0070206 | protein trimerization | 13/3662 | 25/15509 | 0.00193257 | 0.00819294 | 0.00492709 | CD74/SLC1A5/ASIC1/PXDN/HLA-G/HLA-G/HLA-G/HLA-G/HLA-G/HLA-G/HLA-G/HLA-G/MIF | 13 |
| GO:0010459 | negative regulation of heart rate | 10/3662 | 17/15509 | 0.00194605 | 0.00823879 | 0.00495467 | SPTBN4/TRPV1/TNF/TNF/TNF/TNF/TNF/TNF/TNF/TNF | 10 |
| GO:0045653 | negative regulation of megakaryocyte differentiation | 10/3662 | 17/15509 | 0.00194605 | 0.00823879 | 0.00495467 | MYB/PRMT1/GABPA/PF4/CIB1/H4C15/H4C14/H4C12/H4C5/H4C4 | 10 |
| GO:0031333 | negative regulation of protein-containing complex assembly | 45/3662 | 128/15509 | 0.00205422 | 0.00869083 | 0.00522651 | SCIN/HSPA5/SIRT2/VPS35/SPTB/CDC42/ADD2/GSK3B/ADD1/TFIP11/RIOK3/MEFV/MTPN/DKK1/CRYAB/PARK7/CAPZA1/STMN1/CLU/IAPP/EML2/THRA/STXBP1/SORL1/RDX/SMAD6/BBS4/TBCD/SLIT2/GSN/DMTN/SPTBN4/SPTA1/PRKCD/SPTBN2/FLII/CTNNBIP1/INPP5J/HMGB1/SRC/SPTAN1/SVIP/IQANK1/TMSB4X/TWF2 | 45 |
| GO:0006970 | response to osmotic stress | 32/3662 | 84/15509 | 0.00206094 | 0.00871329 | 0.00524002 | BAD/MYLK/XRCC5/ABCB1/BAX/HSP90AB1/MLC1/NFAT5/PYCARD/SLC2A1/PKD2/PTK2B/PKN1/SLC25A23/EPO/TSC22D3/ICOSLG/AQP5/CASP3/TLR3/LETM1/ZFP36L1/CLN3/MTOR/TNF/TNF/TNF/TNF/TNF/TNF/TNF/TNF | 32 |
| GO:0006767 | water-soluble vitamin metabolic process | 23/3662 | 55/15509 | 0.00209199 | 0.00883857 | 0.00531536 | SLC2A3/SLC46A1/MCCC1/SLC23A2/ABCC1/PNPO/FOLR1/MTR/SLC2A1/SLC19A2/CBLIF/MMAB/GSTO1/AMN/NNMT/MMADHC/SLC19A1/SHMT1/TCN2/SLC52A2/PDXP/THTPA/ABCC1 | 23 |
| GO:0007411 | axon guidance | 72/3662 | 224/15509 | 0.0021089 | 0.00887991 | 0.00534022 | CNTN1/EPHA3/LAMA3/NGFR/NTN1/EPHA8/GLI2/NOTCH3/PLXNA2/EPHA6/DPYSL2/BMP7/LAMA1/SCN1B/DVL1/GATA3/CXCL12/UNC5B/WNT3/EFNB3/WNT5A/NRP2/EGR2/FLRT3/BCL11B/RAC2/CHN1/LAMA5/EPHB2/NOTCH2/NKX2-1/TUBB2B/RNF165/SMAD4/APP/EPHA2/SLIT2/EPHA5/NOTCH1/NCAM1/POU4F2/DPYSL5/ISL2/ARHGAP35/SHH/CDK5/TTC8/RHOH/SEMA4C/EFNA1/PTK2/SEMA3E/KIF5B/LAMB2/BSG/DAG1/BDNF/CDK5R1/CDH4/CSF1R/EPHB3/NOG/CNTN2/SLIT3/DCC/NTRK1/TMEFF1/EFNA4/TUBB3/EPHB6/WNT3/WNT3 | 72 |
| GO:0071695 | anatomical structure maturation | 72/3662 | 224/15509 | 0.0021089 | 0.00887991 | 0.00534022 | KDM1A/BTK/MBTPS2/LTF/IGF1/CDH3/RHOA/CBFB/FGFR3/SIRT2/EPHA8/PRKACA/PGR/TUT7/MMP2/DLD/CDC25B/FERMT1/XYLT1/ERCC2/LYL1/HOXA5/GATA3/ZBTB16/FBXO5/WNT5A/HES1/EPAS1/FOXO3/PTBP3/PTK2B/RECK/SEMG1/RUNX2/C3/BMP2/KDR/ALDH1A2/EPO/EDNRB/ADAMTS7/CCL21/MTCH1/IL21/BRCA2/RB1/APP/REN/NR4A2/B4GALT5/SPTBN4/H3-3A/BAP1/EPB42/RBPJ/CX3CR1/S1PR1/FGG/PDE3A/CCL19/DAG1/LEP/DDIT3/CDK5R1/TYMS/FAM20C/RFLNB/CNTN2/L3MBTL3/CEBPA/GH1/PRKACA | 72 |
| GO:0001885 | endothelial cell development | 28/3662 | 71/15509 | 0.00211049 | 0.00887991 | 0.00534022 | FOXP3/ROCK1/ADD1/ICAM1/PPP1R16B/TJP1/MET/RAPGEF1/PDE4D/IL1B/EDNRB/CCM2/RDX/MSN/STC1/ZDHHC21/PLCB1/COL18A1/TNF/TNF/TNF/TNF/TNF/TNF/TNF/TNF/PECAM1/TJP1 | 28 |
| GO:0019319 | hexose biosynthetic process | 28/3662 | 71/15509 | 0.00211049 | 0.00887991 | 0.00534022 | CRY1/SIRT6/SLC25A1/PCK2/SLC39A14/GPI/ALDOC/KAT2B/LEPR/SESN2/G6PC1/PER2/OGT/SOGA1/FOXO1/RANBP2/ATF3/NNMT/GPD1/MST1/LEP/PTPN2/ERFE/ADIPOQ/SLC25A10/USP7/WDR5/GPI | 28 |
| GO:0030198 | extracellular matrix organization | 93/3662 | 301/15509 | 0.00211343 | 0.00887991 | 0.00534022 | NOX1/TNFRSF1B/COL23A1/TIE1/FBLN1/ITGA8/ADAMTS2/MMP2/NID2/ABL1/MMP11/CTSG/MMP9/FERMT1/LAMA1/ERCC2/TGFB1/HAS1/DNAJB6/TGFBR1/ENG/KAZALD1/SMOC2/NPHP3/FMOD/RECK/LRP1/BMP2/COLGALT1/PXDN/COL5A1/MYH11/LOXL2/PDGFRA/LAMC1/LCP1/IL6/ADAMTS7/MMP7/CYP1B1/COL2A1/RB1/ADAMTS17/FURIN/ADAMTS18/FKBP10/APP/CCN1/ADAMTS16/NOTCH1/GAS2/SERPINH1/ITGB1/ABI3BP/ADAMTS1/ADAMTSL3/MMP14/ADAMTS4/RUNX1/ADAMTS13/OLFML2B/MELTF/EGFLAM/TNFRSF11B/BMP1/ANTXR1/LAMB2/DAG1/ANXA2/COL18A1/TMPRSS6/THSD4/COL14A1/MMP1/COL27A1/COL13A1/SLC2A10/ELANE/COL4A6/DPP4/COL11A2/TNF/TNF/TNF/TNF/TNF/TNF/TNF/TNF/ITGB3/MYH11/ELANE/ADAMTS13 | 93 |
| GO:0045446 | endothelial cell differentiation | 40/3662 | 111/15509 | 0.00211421 | 0.00887991 | 0.00534022 | FOXP3/TIE1/ROCK1/ADD1/ICAM1/PPP1R16B/TJP1/MET/EDF1/RAPGEF1/PDE4D/CXCR4/IL1B/ID1/KDR/BTG1/EDNRB/CCM2/RDX/SMAD4/MSN/NOTCH1/ZEB1/BMP6/STC1/RBPJ/S1PR1/ZDHHC21/PLCB1/COL18A1/TNF/TNF/TNF/TNF/TNF/TNF/TNF/TNF/PECAM1/TJP1 | 40 |
| GO:0002313 | mature B cell differentiation involved in immune response | 14/3662 | 28/15509 | 0.00211611 | 0.00887991 | 0.00534022 | ST3GAL1/SPI1/FCGR2B/XBP1/POU2AF1/BCL6/PTK2B/NOTCH2/IL6/IL10/IL21/IRF8/RAG2/CR1 | 14 |
| GO:0042026 | protein refolding | 14/3662 | 28/15509 | 0.00211611 | 0.00887991 | 0.00534022 | HSPA5/FKBP1A/SNRNP70/HSPB1/CRYAB/HSPA8/HSPA9/HSPA2/HSPA1L/HSPA1L/HSPA1L/HSPA1L/HSPA1L/B2M | 14 |
| GO:0051788 | response to misfolded protein | 14/3662 | 28/15509 | 0.00211611 | 0.00887991 | 0.00534022 | ATXN3/BAG6/UGGT2/CLU/AKIRIN2/DERL1/DNAJB12/VCP/RNF5/BAG6/BAG6/BAG6/BAG6/BAG6 | 14 |
| GO:1903523 | negative regulation of blood circulation | 14/3662 | 28/15509 | 0.00211611 | 0.00887991 | 0.00534022 | PIK3CG/PDE4D/SPTBN4/ATP1A1/ATP2A2/TRPV1/TNF/TNF/TNF/TNF/TNF/TNF/TNF/TNF | 14 |
| GO:0006282 | regulation of DNA repair | 60/3662 | 181/15509 | 0.00215406 | 0.00902968 | 0.00543029 | KDM1A/PARP3/ARID1B/RAD51/FAM168A/TMEM161A/ACTB/SIRT6/ATXN7L3/FUS/BCL7C/SMARCB1/TFIP11/RBBP8/EYA1/RECQL5/SMARCD2/NSD2/BCL7A/FOXM1/EYA4/KAT2B/INO80D/ARID1A/SLF2/SHLD2/MORF4L2/DEK/YEATS4/AUNIP/POT1/TAF5L/EPC2/ACTR2/CUL4A/PARP1/EGFR/RADX/PPP4C/HMGA2/CCDC117/MRNIP/TAF6L/BRD7/RNF169/NUDT16L1/MGMT/TADA3/KAT5/RMI2/MAGEF1/TAF7/SETD2/H2AX/ARID2/HMGB1/TRRAP/PRKDC/RTEL1/SMARCB1 | 60 |
| GO:0007611 | learning or memory | 78/3662 | 246/15509 | 0.00215471 | 0.00902968 | 0.00543029 | ITGA3/PAFAH1B1/MAPK8IP2/UBA6/RASGRF1/PICALM/ITGA8/OPRK1/ABL1/ADNP/NDRG4/GPI/PTN/PPP3CB/DKK1/RPS6KB1/B3GAT1/MDK/ASIC1/SLC11A2/NEDD9/PDE8B/CHST10/PAIP2/EGR2/THRA/APOE/SYT11/EPHB2/KRAS/NGF/ACTR2/EIF4A3/APP/ARL6IP5/PLK2/TPBG/EGFR/VLDLR/NTRK2/EIF4EBP2/ITGB1/KIT/BTG2/BRSK1/ZNF385A/CAMK2N1/CASP3/ADCY1/CDK5/RAG1/CX3CR1/RGS14/FOS/CCL11/CEBPB/FOSL1/BDNF/GRIN1/OXTR/PLCB1/NOG/BTBD9/CNTN2/PRKN/CLN3/FZD9/MME/GM2A/SRC/SYNGAP1/NTRK1/TAFA2/GPRASP3/SHANK3/B2M/GPI/PTEN | 78 |
| GO:0003179 | heart valve morphogenesis | 22/3662 | 52/15509 | 0.00217152 | 0.00908784 | 0.00546527 | SNAI2/TIE1/ROCK1/TGFB1/GATA3/BMPR1A/SOX4/BMP2/NOTCH2/SMAD6/RB1/SMAD4/CCN1/SLIT2/NOTCH1/TGFBR2/HEYL/NOS3/EFNA1/NKX2-5/SLIT3/MTOR | 22 |
| GO:0010761 | fibroblast migration | 22/3662 | 52/15509 | 0.00217152 | 0.00908784 | 0.00546527 | HYAL2/TGFB1/HAS1/ACTA2/CORO1C/GNA13/AKAP12/CCN3/THBS1/FGF2/GNA12/ITGB1/ARID5B/APPL1/DMTN/PTK2/PRKCE/PLEC/RCC2/SLC8A1/CLN3/ITGB3 | 22 |
| GO:0006626 | protein targeting to mitochondrion | 34/3662 | 91/15509 | 0.00222529 | 0.00930658 | 0.00559681 | AGK/TOMM34/CSNK2A2/LMAN1/SH3GLB1/TIMM13/SAMM50/TIMM9/PDCD5/GSK3A/GRPEL1/MFN2/RAC2/TIMM10B/PRKAA1/SAE1/IMMP1L/TIMM8B/BAG3/BAP1/MFF/TOMM20/ATG13/TOMM5/PRKN/UBE2L3/UBL5/HSPA1L/HSPA1L/FIS1/HSPA1L/HSPA1L/HSPA1L/TIMM23 | 34 |
| GO:0009914 | hormone transport | 88/3662 | 283/15509 | 0.00222981 | 0.0093192 | 0.0056044 | BAD/CD38/CRY1/BTK/HFE/CASR/NNAT/KCNQ1/SIRT6/OPRK1/OXCT1/RAPGEF4/SLC7A8/OSM/PCK2/SFRP1/TFR2/GATA3/PPP3CB/PSMD9/IFNG/PPARD/SNX4/PASK/PARK7/KDM5B/VAMP8/SPP1/CRHR1/SNX19/SERP1/CRY2/INHBA/SOX4/IL1B/NR1D1/LIF/PER2/HNF1A/GLUL/IL6/IL1RN/CCN3/CYP19A1/SMAD4/ENSA/REN/EPHA5/SLC16A2/CAMK2G/GLUD1/TCF7L2/FOXO1/GJA1/BMP6/INHBB/AIMP1/SLC9B2/GDF9/GPER1/TRPV6/CCDC186/PRKCE/FGG/FGA/BRSK2/LEP/FZD4/SMAD2/PTPN11/ADIPOQ/MAFA/PRKN/KCNJ11/PIM3/SELENOT/TNF/TNF/TNF/TNF/TNF/TNF/TNF/TNF/RASL10B/CCL5/CCL5/TRPV6 | 88 |
| GO:0048644 | muscle organ morphogenesis | 27/3662 | 68/15509 | 0.00223845 | 0.00934901 | 0.00562233 | PKP2/MYLK/FGFR2/LRP2/FKBP1A/DSP/SMAD7/TGFB1/TGFBR1/ENG/BMPR1A/WNT5A/TNNT2/SERP1/BMP2/LIF/TNNI3/SMAD4/NOTCH1/ARID5B/POU4F1/TNNI1/RBPJ/ZFPM2/S1PR1/NKX2-5/NOG | 27 |
| GO:0048662 | negative regulation of smooth muscle cell proliferation | 21/3662 | 49/15509 | 0.00224234 | 0.00935115 | 0.00562362 | RHOA/NDRG4/IFNG/PPARD/IL12B/MFN2/TNFAIP3/GNA13/CDKN1A/BMP2/APOE/IL10/GNA12/IGFBP3/GPER1/NOS3/NDRG2/CTNNBIP1/ADIPOQ/RBM10/PTEN | 21 |
| GO:1900017 | positive regulation of cytokine production involved in inflammatory response | 15/3662 | 31/15509 | 0.00224349 | 0.00935115 | 0.00562362 | IL17A/IL6/TLR4/GBP5/APPL1/NOD2/CARD9/TNF/TNF/TNF/TNF/TNF/TNF/TNF/TNF | 15 |
| GO:1903959 | regulation of anion transmembrane transport | 15/3662 | 31/15509 | 0.00224349 | 0.00935115 | 0.00562362 | ABCB1/ARG1/PER2/ARL6IP5/ITGB1/SLC43A2/PTAFR/TNF/TNF/TNF/TNF/TNF/TNF/TNF/TNF | 15 |
| GO:0016049 | cell growth | 128/3662 | 433/15509 | 0.00227889 | 0.00949233 | 0.00570852 | CD38/IFRD1/PAFAH1B1/SPAG9/IGF1/FHL1/CDH1/CYBA/CYFIP2/NTN1/MAP2K4/RHOA/HYAL2/RASGRP2/CDC42/DERL2/GSK3B/SLC23A2/KDM2B/DPYSL2/HSP90AB1/ABL1/ADNP/SMAD7/RBBP7/NUBP1/SFRP1/URI1/TGFB1/DDX49/HAMP/GSK3A/MTPN/BRAT1/TGFBR1/DVL1/CXCL12/PPP3CB/KAZALD1/WNT3/CRYAB/EIF4G2/CYP27B1/PPARD/HBEGF/PPP2CA/DBN1/BCL6/WNT5A/CISH/TTL/ITGA4/FN1/NRP2/SPP1/PTK2B/CXCR4/INHBA/USP9X/CDKN1A/FLRT3/APOE/SESN2/BTG1/PSRC1/NGF/SERPINE2/DBNL/NCBP1/CCN3/IGFBPL1/KIAA0319/PLCE1/CLSTN3/RB1/ST8SIA2/SMAD4/APP/CRABP2/SYT2/SLIT2/EGFR/IGFBP3/C9orf72/EI24/ITGB1/POU4F2/GJA1/MMP14/ADIPOR1/PRMT2/DISC1/FRZB/H3-3A/PDLIM5/TGFBR2/BAP1/RICTOR/CDK5/FXN/GNG4/CDKN2AIP/SEMA4C/SEMA3E/LPAR3/SLC25A33/LAMB2/RARG/BDNF/CDH4/F2/NPM1/SLIT3/CIB1/PRKN/PRR5/TEAD1/DCC/ATAD3A/MTOR/GDI1/SIPA1/NDUFS3/CPNE1/TWF2/WNT3/WNT3/ITCH | 128 |
| GO:0006383 | transcription by RNA polymerase III | 20/3662 | 46/15509 | 0.0023011 | 0.00955878 | 0.00574848 | BAZ1B/SNAPC1/CHD8/ELL/SF3B1/POLR3GL/INHBA/DEK/ICE2/MYBBP1A/POLR3F/BDP1/GTF3C5/SMARCA5/POLR3K/POLR3D/POLR1C/BRF1/MTOR/ZNF345 | 20 |
| GO:0030850 | prostate gland development | 20/3662 | 46/15509 | 0.0023011 | 0.00955878 | 0.00574848 | HOXA11/FGFR2/TP63/HOXA9/MMP2/ESR1/BMP7/SFRP1/WNT5A/RARA/CYP19A1/NOTCH1/SHH/FRS2/CYP7B1/RARG/PLAG1/NOG/HOXA10/PTEN | 20 |
| GO:0032814 | regulation of natural killer cell activation | 20/3662 | 46/15509 | 0.0023011 | 0.00955878 | 0.00574848 | TYROBP/PRDM1/PIBF1/IL12B/PTPN22/IL18/STAT5B/LEP/MICA/BLOC1S3/HLA-E/HLA-E/HLA-E/HLA-E/HLA-E/MICA/MICA/HLA-E/MICA/HLA-E | 20 |
| GO:0035272 | exocrine system development | 20/3662 | 46/15509 | 0.0023011 | 0.00955878 | 0.00574848 | SNAI2/HGF/FGFR2/BMP7/LAMA1/TGFB1/TWSG1/LAMA5/EGFR/SHH/DAG1/TGM2/TNF/TNF/TNF/TNF/TNF/TNF/TNF/TNF | 20 |
| GO:0006875 | cellular metal ion homeostasis | 115/3662 | 384/15509 | 0.00230256 | 0.00955878 | 0.00574848 | HFE/SLC11A1/BAK1/CASR/HEXB/HERPUD1/CYBA/ATP2B4/AP3D1/ATP6AP1/PRKACA/SLC46A1/PTPRC/FTL/BAX/FKBP1A/P2RX7/SLC22A17/ABL1/KCTD17/CD40/NUBP1/SLC39A14/HAMP/TFR2/CXCL12/CDH23/CCDC47/HPX/CALCA/SLC11A2/VDR/IFNG/PDE4D/WNT5A/ATP6V1A/IL1A/SLC30A3/FASLG/PKD2/PTK2B/KCNJ2/TMTC4/SLC25A23/CCR7/TNNI3/APOE/NDFIP1/C19orf12/IMMT/AP3B1/ISCU/IREB2/ATP6V1G1/CCL21/FGF2/TMBIM6/SMAD4/SOD1/APP/SYPL2/TMCO1/CALM2/ANK2/LCN2/GSTO1/ITPR1/BMP6/SLC24A2/STEAP2/ALAS2/STC1/CALM3/CCR5/CYB561A3/SELENON/SCNN1D/SLC30A7/DISC1/ATP1A1/GPER1/FXN/STIM1/FTH1/LETM1/PRKCE/CCL11/CCL19/ATP2A2/DDIT3/CD19/GRINA/ERFE/CALR/F2/F2R/SLC8A1/SMDT1/TMPRSS6/TMEM203/CLN3/FZD9/TRPV1/ELANE/TGM2/FIS1/KCTD7/TMEM199/ITGB3/PTPRC/CCL5/CCL5/ELANE/RASA3/PRKACA | 115 |
| GO:0071241 | cellular response to inorganic substance | 66/3662 | 203/15509 | 0.00230803 | 0.00957507 | 0.00575828 | BAD/HFE/CDH1/HSPA5/RAD51/RASGRP2/ATRX/SLC25A24/ADD1/MMP9/GSK3A/TFR2/MAPK8/PPIF/WNT5A/MTR/PKD2/SLC25A23/FOSB/BECN1/PRKAA1/SYT11/TFAP2A/CARF/CYP1A1/CYP1A2/EIF4A3/SOD1/APP/ADCY10/KCNH1/PARP1/SYT2/CCNA2/EGFR/ALAD/FOXO1/BMP6/DMTN/ALOX15/INHBB/SHH/ADCY1/CYBB/CHP2/FOS/NPTX1/EIF2AK3/LIG4/JUN/KCNJ10/CALR/NQO1/PRKN/AKR1C3/CACNA1H/DDI2/DAXX/DAXX/CHUK/CPNE1/DAXX/DAXX/DAXX/CEBPA/B2M | 66 |
| GO:0002335 | mature B cell differentiation | 16/3662 | 34/15509 | 0.00232234 | 0.00960873 | 0.00577852 | ST3GAL1/SPI1/FCGR2B/XBP1/POU2AF1/BCL6/PTK2B/NOTCH2/IL6/IL10/IL21/IRF8/IL2RG/RAG2/CD19/CR1 | 16 |
| GO:0009651 | response to salt stress | 16/3662 | 34/15509 | 0.00232234 | 0.00960873 | 0.00577852 | XRCC5/BAX/HSP90AB1/PTK2B/SLC25A23/EPO/LETM1/ZFP36L1/TNF/TNF/TNF/TNF/TNF/TNF/TNF/TNF | 16 |
| GO:0044786 | cell cycle DNA replication | 16/3662 | 34/15509 | 0.00232234 | 0.00960873 | 0.00577852 | UPF1/DBF4/RAD51/ZMPSTE24/ATRX/CDC7/GINS1/POLA1/LIG1/ZPR1/AICDA/FBXO5/BCL6/BRCA2/DBF4B/RTEL1 | 16 |
| GO:0097421 | liver regeneration | 16/3662 | 34/15509 | 0.00232234 | 0.00960873 | 0.00577852 | CSNK2A2/HAMP/EZH2/CCND1/IL6/IL10/CEBPB/TYMS/TNF/TNF/TNF/TNF/TNF/TNF/TNF/TNF | 16 |
| GO:0016574 | histone ubiquitination | 19/3662 | 43/15509 | 0.00234376 | 0.00969088 | 0.00582792 | KDM1A/PAF1/RAD51/UBE2A/ATXN7L3/KDM2B/PHC1/SKP1/PARK7/DDB2/BRCA2/RNF20/CUL4B/RYBP/RAG1/SUZ12/PCGF5/UHRF1/PCGF2 | 19 |
| GO:0032570 | response to progesterone | 18/3662 | 40/15509 | 0.00236548 | 0.00976114 | 0.00587018 | BAD/CD38/GPI/TGFB1/FOSB/NKX2-2/WBP2/THBS1/CYP1B1/IGF1R/FOS/FOSL1/TYMS/OXTR/SRC/MBP/TXNIP/GPI | 18 |
| GO:0042908 | xenobiotic transport | 18/3662 | 40/15509 | 0.00236548 | 0.00976114 | 0.00587018 | ABCC2/ATP8B1/ABCB1/ABCC1/ABCC3/TMEM30A/SLC29A1/SLC2A1/ABCG2/ABCC4/SLC47A1/GJA1/ABCA3/SLC19A1/PDZK1/SLC22A1/SLC22A5/ABCC1 | 18 |
| GO:1905314 | semi-lunar valve development | 18/3662 | 40/15509 | 0.00236548 | 0.00976114 | 0.00587018 | SNAI2/TNFRSF1B/TIE1/ROCK1/TGFB1/GATA3/BMP2/NOTCH2/SMAD6/RB1/SLIT2/NOTCH1/HEYL/NOS3/RBPJ/EFNA1/NKX2-5/SLIT3 | 18 |
| GO:1902882 | regulation of response to oxidative stress | 33/3662 | 88/15509 | 0.00239152 | 0.00986205 | 0.00593087 | NOX1/HGF/AIFM2/ABL1/BMP7/MET/HSPB1/MACROH2A1/PARK7/FOXO3/NR4A3/TRAP1/SESN2/CD36/IL10/TLR4/MEAK7/SOD1/PARP1/NONO/SESN3/TBC1D24/SELENON/PRKN/PPIA/TNF/TNF/TNF/TNF/TNF/TNF/TNF/TNF | 33 |
| GO:0097485 | neuron projection guidance | 72/3662 | 225/15509 | 0.00239745 | 0.0098783 | 0.00594063 | CNTN1/EPHA3/LAMA3/NGFR/NTN1/EPHA8/GLI2/NOTCH3/PLXNA2/EPHA6/DPYSL2/BMP7/LAMA1/SCN1B/DVL1/GATA3/CXCL12/UNC5B/WNT3/EFNB3/WNT5A/NRP2/EGR2/FLRT3/BCL11B/RAC2/CHN1/LAMA5/EPHB2/NOTCH2/NKX2-1/TUBB2B/RNF165/SMAD4/APP/EPHA2/SLIT2/EPHA5/NOTCH1/NCAM1/POU4F2/DPYSL5/ISL2/ARHGAP35/SHH/CDK5/TTC8/RHOH/SEMA4C/EFNA1/PTK2/SEMA3E/KIF5B/LAMB2/BSG/DAG1/BDNF/CDK5R1/CDH4/CSF1R/EPHB3/NOG/CNTN2/SLIT3/DCC/NTRK1/TMEFF1/EFNA4/TUBB3/EPHB6/WNT3/WNT3 | 72 |
| GO:0007498 | mesoderm development | 43/3662 | 122/15509 | 0.00241056 | 0.0098783 | 0.00594063 | HOXA11/ITGA3/BTK/TIE1/FGFR2/PRKACA/RPS6KA6/TP63/ITGA8/BMP7/HCK/AXIN1/EYA1/GPI/BMPR1A/DKK1/WNT3/PPP2CA/WNT5A/INHBA/TWSG1/ARMC5/SMAD4/EPHA2/HMGA2/ITGB1/POU4F1/GJA1/NODAL/POGLUT1/SHH/ZFPM2/SMAD2/SETD2/NOG/ZFP36L1/NF2/TXNRD1/ITGB3/WNT3/WNT3/GPI/PRKACA | 43 |
| GO:0002320 | lymphoid progenitor cell differentiation | 11/3662 | 20/15509 | 0.00241299 | 0.0098783 | 0.00594063 | SPI1/ZNHIT1/GATA3/HES1/FLT3/SOX4/NOTCH1/KIT/SHH/LIG4/PRKDC | 11 |
| GO:0032928 | regulation of superoxide anion generation | 11/3662 | 20/15509 | 0.00241299 | 0.0098783 | 0.00594063 | TYROBP/CYBA/ACP5/TGFB1/SOD1/ITGB2/PRKCD/SYK/ITGAM/CD177/AATF | 11 |
| GO:0035584 | calcium-mediated signaling using intracellular calcium source | 11/3662 | 20/15509 | 0.00241299 | 0.0098783 | 0.00594063 | PRKACA/PTPRC/CCL20/KDR/DMTN/VCAM1/SELP/STIMATE/FIS1/PTPRC/PRKACA | 11 |
| GO:0045649 | regulation of macrophage differentiation | 11/3662 | 20/15509 | 0.00241299 | 0.0098783 | 0.00594063 | TGFB1/ID2/INHBA/LIF/RB1/PRKCA/PF4/FADD/PTPN2/ADIPOQ/CSF1 | 11 |
| GO:0051238 | sequestering of metal ion | 11/3662 | 20/15509 | 0.00241299 | 0.0098783 | 0.00594063 | CIAPIN1/CPS1/AP3D1/LMAN1/FTL/FCER2/SLC30A3/COX17/LCN2/SLC30A7/FTH1 | 11 |
| GO:0090713 | immunological memory process | 11/3662 | 20/15509 | 0.00241299 | 0.0098783 | 0.00594063 | ST3GAL1/IL12RB1/CD81/IL12B/BCL6/CD160/HLA-DRA/HLA-DRA/HLA-DRA/HLA-DRA/HLA-DRA | 11 |
| GO:0097049 | motor neuron apoptotic process | 11/3662 | 20/15509 | 0.00241299 | 0.0098783 | 0.00594063 | FAS/ERBB3/MAP2K4/RHOA/ROCK1/BAX/ZPR1/CNTFR/MAP3K12/FADD/NEFL | 11 |
| GO:1902992 | negative regulation of amyloid precursor protein catabolic process | 11/3662 | 20/15509 | 0.00241299 | 0.0098783 | 0.00594063 | IGF1/ROCK1/PICALM/CLU/PIN1/APOE/FLOT2/RTN3/SORL1/RTN1/NTRK2 | 11 |
| GO:2001026 | regulation of endothelial cell chemotaxis | 11/3662 | 20/15509 | 0.00241299 | 0.0098783 | 0.00594063 | FGFR1/PRKD2/MET/HSPB1/SMOC2/KDR/THBS1/FGF2/NOTCH1/CXCL13/TMSB4X | 11 |
| GO:0042594 | response to starvation | 62/3662 | 189/15509 | 0.00243051 | 0.00994342 | 0.0059798 | HFE/CPS1/RRAGD/FAS/CLEC16A/HSPA5/EIF2AK2/ASNS/OXCT1/SEH1L/GCN1/COMT/SH3GLB1/XBP1/PCK2/NPRL3/SFRP1/HAMP/MAPK8/RNF167/HSPA8/ELAPOR1/SLC2A1/FOXO3/CDKN1A/MAX/BECN1/ATG14/ZFP36/SESN2/PRKAA1/MYBBP1A/HNRNPA1/GLUL/TTC5/GABARAPL1/IGF1R/TNFRSF11A/PMAIP1/SESN3/FOXO1/KLF10/WIPI2/BRSK1/WNT4/ATF3/INHBB/ALB/ZFYVE1/FOS/PPM1D/EIF2AK3/KAT5/BRSK2/DDIT3/SSTR2/GAS2L1/AKR1C3/MAP3K5/ATG7/MTOR/ADSL | 62 |
| GO:0001894 | tissue homeostasis | 78/3662 | 247/15509 | 0.0024336 | 0.00994949 | 0.00598345 | CD38/USH1C/PROM1/LTF/CDH3/ACTB/NOX4/BAX/P2RX7/LYZ/CHMP4B/GATA1/ACP5/CSK/TJP1/IL7/HAMP/HSPB1/CDH23/CALCA/IL17A/NPHP3/EPAS1/SLC2A1/PRDX1/TNFAIP3/SPP1/PTK2B/IAPP/USP45/KDR/SFTPD/KRAS/LAMC1/IL6/TLR4/COL2A1/RB1/BBS4/DEF8/TNFRSF11A/SOD1/NOTCH1/CDHR1/ITGB1/GJA1/PRKCA/DRAM2/CLDN12/ALB/BAP1/TNFRSF11B/NOS3/SYK/NOD2/ABCA3/NKIRAS2/INPP5D/ADRB2/S1PR1/IQCB1/GPR137/PTPN11/BBS10/F2R/CSF1R/CSF1/SRC/SLC22A5/NKIRAS1/MBP/GIGYF2/ITGB3/PECAM1/B2M/AKT3/TJP1/INPP5D | 78 |
| GO:0002829 | negative regulation of type 2 immune response | 7/3662 | 10/15509 | 0.00245233 | 0.00996038 | 0.00599 | TBX21/ARG2/IL27RA/BCL6/ARG1/NDFIP1/HLX | 7 |
| GO:0009698 | phenylpropanoid metabolic process | 7/3662 | 10/15509 | 0.00245233 | 0.00996038 | 0.00599 | CYP2D6/CYP1A1/CYP2D6/CYP2D6/CYP2D6/CYP2D6/CYP2D6 | 7 |
| GO:0009804 | coumarin metabolic process | 7/3662 | 10/15509 | 0.00245233 | 0.00996038 | 0.00599 | CYP2D6/CYP1A1/CYP2D6/CYP2D6/CYP2D6/CYP2D6/CYP2D6 | 7 |
| GO:0033212 | iron import into cell | 7/3662 | 10/15509 | 0.00245233 | 0.00996038 | 0.00599 | HFE/SLC39A14/TFR2/SLC11A2/IFNG/ISCU/STEAP2 | 7 |
| GO:0050689 | negative regulation of defense response to virus by host | 7/3662 | 10/15509 | 0.00245233 | 0.00996038 | 0.00599 | TARBP2/MICB/MICB/MICB/MICB/MICB/MICB | 7 |
| GO:0070099 | regulation of chemokine-mediated signaling pathway | 7/3662 | 10/15509 | 0.00245233 | 0.00996038 | 0.00599 | SH2B3/PADI2/RNF113A/SLIT2/SLIT3/CCL5/CCL5 | 7 |
| GO:1903935 | response to sodium arsenite | 7/3662 | 10/15509 | 0.00245233 | 0.00996038 | 0.00599 | HNRNPA1/DAXX/DAXX/DAXX/DAXX/DAXX/NEFL | 7 |
| GO:1905907 | negative regulation of amyloid fibril formation | 7/3662 | 10/15509 | 0.00245233 | 0.00996038 | 0.00599 | CRYAB/PFDN1/CLU/IAPP/PFDN5/APOE/PFDN6 | 7 |
| GO:2001186 | negative regulation of CD8-positive, alpha-beta T cell activation | 7/3662 | 10/15509 | 0.00245233 | 0.00996038 | 0.00599 | HFE/LILRB1/SOCS1/LILRB1/LILRB1/LILRB1/LILRB1 | 7 |
| GO:2001188 | regulation of T cell activation via T cell receptor contact with antigen bound to MHC molecule on antigen presenting cell | 7/3662 | 10/15509 | 0.00245233 | 0.00996038 | 0.00599 | LILRB1/CD81/LGALS9/LILRB1/LILRB1/LILRB1/LILRB1 | 7 |
| GO:0000377 | RNA splicing, via transesterification reactions with bulged adenosine as nucleophile | 82/3662 | 262/15509 | 0.0025301 | 0.0102628 | 0.00617187 | KDM1A/PTBP1/ZCCHC8/SNRNP40/DDX20/DAZAP1/MBNL3/DDX1/SF3B2/RBM41/HNRNPC/CWF19L1/CIRBP/SNRPD3/TFIP11/SNU13/RBFOX2/PNN/PRPF6/SNRNP70/YJU2/CASC3/C1QBP/DDX5/EFTUD2/HSPA8/SRSF9/FAM172A/NCL/SF3B1/SRSF7/SRSF4/PRPF3/PTBP2/PRDX6/COIL/SMU1/SNRPC/RNF113A/HNRNPR/RALY/RBM42/AAR2/PRMT7/RBM17/SRPK2/HNRNPA1/SRSF1/PRPF4/NCBP1/DBR1/SCAF11/SNRPF/DHX38/EIF4A3/SF3B4/SNRPG/WTAP/LUC7L2/RBMX/CWC15/MBNL1/CWC27/RBM15/SNRPD1/SRRM2/USP39/HNRNPH1/ZRSR2/HNRNPA3/SMN1/LARP7/NPM1/RBM10/RNPC3/UBL5/LSM2/RBM15B/SRSF8/RBM8A/SRSF1/PRPF8 | 82 |
| GO:0000398 | mRNA splicing, via spliceosome | 82/3662 | 262/15509 | 0.0025301 | 0.0102628 | 0.00617187 | KDM1A/PTBP1/ZCCHC8/SNRNP40/DDX20/DAZAP1/MBNL3/DDX1/SF3B2/RBM41/HNRNPC/CWF19L1/CIRBP/SNRPD3/TFIP11/SNU13/RBFOX2/PNN/PRPF6/SNRNP70/YJU2/CASC3/C1QBP/DDX5/EFTUD2/HSPA8/SRSF9/FAM172A/NCL/SF3B1/SRSF7/SRSF4/PRPF3/PTBP2/PRDX6/COIL/SMU1/SNRPC/RNF113A/HNRNPR/RALY/RBM42/AAR2/PRMT7/RBM17/SRPK2/HNRNPA1/SRSF1/PRPF4/NCBP1/DBR1/SCAF11/SNRPF/DHX38/EIF4A3/SF3B4/SNRPG/WTAP/LUC7L2/RBMX/CWC15/MBNL1/CWC27/RBM15/SNRPD1/SRRM2/USP39/HNRNPH1/ZRSR2/HNRNPA3/SMN1/LARP7/NPM1/RBM10/RNPC3/UBL5/LSM2/RBM15B/SRSF8/RBM8A/SRSF1/PRPF8 | 82 |
| GO:0090288 | negative regulation of cellular response to growth factor stimulus | 35/3662 | 95/15509 | 0.00254455 | 0.0103146 | 0.00620305 | DCN/ATP2B4/NGFR/HIPK2/LRP2/ABL1/SMAD7/SFRP1/GATA3/DKK1/IL12B/IL4/WNT5A/TWSG1/SPRY2/SORL1/THBS1/SMAD6/FGF2/TOB1/SLIT2/NOTCH1/CRIM1/HHEX/CXCL13/SKI/WNT4/HTRA1/NOG/HGS/TMPRSS6/SPRY4/TRIM33/PDCD6/CRIM1 | 35 |
| GO:0010811 | positive regulation of cell-substrate adhesion | 40/3662 | 112/15509 | 0.0025513 | 0.0103353 | 0.00621545 | ITGA3/ROCK1/CDC42/GSK3B/CEACAM6/ABL1/PDGFB/FERMT1/OLFM4/SFRP1/C1QBP/MDK/NEDD9/FN1/TEK/PTK2B/CCR7/RRAS/KDR/CD36/CCL21/CCN1/ABI3BP/DMTN/COL26A1/ALOX15/WNT4/DISC1/EDIL3/EGFLAM/PLEKHA2/LIMS1/PRKCE/FGG/FGA/DAG1/CALR/CSF1/CIB1/ITGB3 | 40 |
| GO:0044270 | cellular nitrogen compound catabolic process | 120/3662 | 404/15509 | 0.00256335 | 0.0103773 | 0.00624073 | UPF1/SLC11A1/RNH1/ABCC2/RNASET2/TNFRSF1B/ZCCHC8/EDC4/PUM2/NTHL1/PDE4A/ELAVL1/ROCK1/SMG6/MLH1/TUT7/BAX/XRN2/FUS/ALKBH5/HNRNPC/AGO1/ACOT7/CIRBP/CECR2/CYP2D6/ZC3H14/APEX1/ABCC1/POP1/RNASEH2A/DDX49/GSK3A/SMG9/CYP3A5/AMBP/EXOSC3/TRDMT1/LARP4B/CASC3/DDX5/ZPR1/SLCO1B3/AICDA/MAPK14/PDE8B/PDE4D/XRN1/NT5C1A/SLIRP/NRDE2/TARDBP/CNOT1/ITPA/ZFP36/ZC3H4/DKC1/GRSF1/NT5E/IL6/TTC5/NCBP1/TET1/TDG/NUDT7/TOB1/EIF4A3/POLR2D/CNOT9/ZFP36L2/CARHSP1/PRKCA/CNOT11/ZC3H18/BTG2/PDE9A/CYP3A4/MAPKAPK2/PRKCD/FASTK/VCP/NUDT5/HINT1/PDE7B/EXOSC10/PAIP1/SUCLG2/DCP2/CNP/ANGEL2/PDE12/ERN1/DCTPP1/NPM1/RBM10/PDE4B/ZFP36L1/YTHDF3/TET3/SECISBP2/DPYD/ENTPD4/ENTPD7/PNP/SMG5/GIGYF2/DXO/LSM2/NUDT19/GAS5/PDXP/RBM8A/NUDT3/CYP2D6/CYP2D6/TAF15/ABCC1/CYP2D6/CYP2D6/CYP2D6 | 120 |
| GO:0046883 | regulation of hormone secretion | 71/3662 | 222/15509 | 0.0025987 | 0.0105135 | 0.00632265 | BAD/CD38/CRY1/HFE/CASR/NNAT/SIRT6/OPRK1/OXCT1/OSM/PCK2/SFRP1/TFR2/PPP3CB/PSMD9/IFNG/PPARD/SNX4/PASK/KDM5B/VAMP8/SPP1/CRHR1/SERP1/CRY2/INHBA/SOX4/IL1B/NR1D1/LIF/PER2/GLUL/IL6/CCN3/CYP19A1/SMAD4/ENSA/REN/EPHA5/GLUD1/TCF7L2/FOXO1/GJA1/BMP6/INHBB/AIMP1/SLC9B2/GDF9/GPER1/PRKCE/FGG/FGA/BRSK2/LEP/PTPN11/ADIPOQ/PRKN/KCNJ11/PIM3/SELENOT/TNF/TNF/TNF/TNF/TNF/TNF/TNF/TNF/RASL10B/CCL5/CCL5 | 71 |
| GO:0006302 | double-strand break repair | 83/3662 | 266/15509 | 0.00262577 | 0.0106161 | 0.00638435 | KDM1A/IFFO1/PPP5C/PARP3/ARID1B/RAD51/HPF1/ACTB/MLH1/SIRT6/XRCC5/DDX1/RAD54L/FUS/MSH2/CDC7/BCL7C/SMARCB1/TFIP11/ACTR5/RBBP8/POLA1/EYA1/NBN/DNTT/RECQL5/SMARCD2/NSD2/BCL7A/FOXM1/RAD50/ARID1A/SLF2/SHLD2/POLM/MORF4L2/DEK/AP5S1/YEATS4/AUNIP/POT1/BRME1/EPC2/ACTR2/SMARCAL1/NABP2/BRCA2/INTS3/PARP1/RADX/PAXX/PPP4C/HMGA2/EME1/MRNIP/VCP/BRD7/RNF169/MCM7/NUDT16L1/RFWD3/MGMT/KAT5/KDM2A/NABP1/LIG4/RMI2/MAGEF1/RMI1/SETD2/CHEK2/CIB1/H2AX/ARID2/HMGB1/TRRAP/DCLRE1A/ZSWIM7/PRKDC/RTEL1/SMARCB1/FAN1/TOP3A | 83 |
| GO:0043547 | positive regulation of GTPase activity | 80/3662 | 255/15509 | 0.00263564 | 0.0106428 | 0.00640042 | RABGAP1/TBC1D22A/RASGRF1/ZC3H15/TBC1D25/RASGRP2/PICALM/RAP1GAP/GSK3B/GMIP/RAPGEF4/RANGAP1/CD40/CCL22/CCL17/TSC2/SFRP1/ARHGEF10/SYDE1/EZH2/RAPGEF1/CCL2/CORO1C/FZD10/NEDD9/WNT5A/CCL20/SIPA1L2/PTK2B/TBC1D15/CCR7/PIN1/CHN1/FOXJ1/DOCK6/TBC1D14/TBC1D8B/CCL21/EPHA2/PKP4/MMUT/C9orf72/ITGB1/ASAP2/CXCL13/AGAP1/ARHGAP27/ABR/ARHGAP35/DVL3/WNT4/MAPRE2/SLC27A4/TBC1D2B/RGS14/LIMS1/S1PR1/CCL11/CCL19/HRAS/RCC2/ARHGAP45/F2R/RGMA/PRTN3/TBC1D9B/SIPA1L1/NTRK1/TGM2/SIPA1/CCL5/CCL5/TBC1D3/CCL4/CCL18/CCL4/PRTN3/CCL4/CCL18/CCL18 | 80 |
| GO:0033013 | tetrapyrrole metabolic process | 24/3662 | 59/15509 | 0.00263581 | 0.0106428 | 0.00640042 | ALAS1/ABCC2/SLC46A1/TMEM14A/ABCC1/AMBP/HPX/SLC11A2/SLCO1B3/MTR/CBLIF/ABCB10/IREB2/MMAB/CYP1A1/CYP1A2/ALAD/ALAS2/SPTA1/FXN/AMN/MMADHC/TCN2/ABCC1 | 24 |
| GO:0050804 | modulation of chemical synaptic transmission | 117/3662 | 393/15509 | 0.00264464 | 0.0106715 | 0.00641767 | CD38/MAPK8IP2/TYROBP/CDH1/RASGRF1/PRKACA/GSK3B/ERC1/ACHE/PSMC5/ABL1/ADNP/NALCN/PLAT/PTN/DVL1/PPP3CB/DKK1/RNF167/CCL2/MPP2/ASIC1/DBN1/DLGAP3/RIMS3/CDC20/PCDH17/PAIP2/PTK2B/EGR2/STAU1/IL1B/PNKD/YWHAH/APOE/AKAP12/RARA/SYT11/EPHB2/KRAS/NGF/GLUL/SERPINE2/STXBP1/TUBB2B/PREPL/CLSTN3/ARRB2/EIF4A3/APP/SNAPIN/PLK2/CPLX2/NTRK2/EIF4EBP2/GRIK4/ITGB1/DGKE/SLC24A2/KIT/TPRG1L/ABR/CALM3/ZDHHC12/BRSK1/TBC1D24/DISC1/ZDHHC3/ADCY1/GPER1/CDK5/NSMF/PXK/CX3CR1/RGS14/ADRB2/CDH2/KIF5B/PRKCE/NPTX1/ATP2A2/HRAS/KCTD13/BDNF/GRIN1/KCNJ10/OXTR/ADIPOQ/ADGRB1/CACNB4/PLCB1/NOG/BTBD9/CNTN2/PRKN/DCC/CLN3/CNR2/MME/SRC/SYNGAP1/SIPA1L1/NTRK1/TNF/TNF/NPTXR/TNF/TNF/TNF/TNF/TNF/TNF/SHISA8/SHANK3/SQSTM1/PTEN/PRKACA | 117 |
| GO:0008202 | steroid metabolic process | 90/3662 | 292/15509 | 0.00266583 | 0.01075 | 0.00646488 | PON1/OSBPL7/MBTPS2/NPC1L1/SNAI2/H6PD/SOAT1/DDX20/ACADVL/LRP2/ATP8B1/APOB/ESR1/CYP2D6/CYB5R3/DHRS2/SQLE/ASAH1/CYP3A5/SC5D/MVK/CYP27B1/IFNG/PPARD/PDE8B/IL4/IL1A/SNX17/CHST10/HDLBP/LEPR/NR5A2/SPP1/EGR1/EPHX2/CAT/BMP2/NR1D1/YWHAH/APOE/CYP2E1/ACLY/G6PC1/PRKAA1/HSD17B4/PDGFRA/EDNRB/FDX1/CYP19A1/CYP1B1/IGF1R/CYP1A1/CYP1A2/ARMC5/SOD1/APP/LBR/ERLIN2/VLDLR/BMP6/KIT/LDLRAP1/CYP3A4/WNT4/GFI1/ATP1A1/SHH/CYP2C19/CYP7B1/ARV1/STAT5B/LEP/PBX1/AKR1C3/CACNA1H/CYP2B6/TNF/TNF/TNF/TNF/TNF/TNF/TNF/TNF/CEBPA/CYP2D6/CYP2D6/CYP2D6/CYP2D6/CYP2D6 | 90 |
| GO:0001522 | pseudouridine synthesis | 9/3662 | 15/15509 | 0.00274196 | 0.0110141 | 0.00662366 | TSR3/PUS3/PUS7L/DKC1/PUS10/RPUSD4/TRUB1/PUS1/NOP10 | 9 |
| GO:0003198 | epithelial to mesenchymal transition involved in endocardial cushion formation | 9/3662 | 15/15509 | 0.00274196 | 0.0110141 | 0.00662366 | SNAI2/TGFBR1/ENG/SMAD4/NOTCH1/TGFBR2/HEYL/RBPJ/NOG | 9 |
| GO:0006337 | nucleosome disassembly | 9/3662 | 15/15509 | 0.00274196 | 0.0110141 | 0.00662366 | SUPT16H/SMARCB1/SMARCD2/ARID1A/HMGA1/SSRP1/H2AC25/ARID2/SMARCB1 | 9 |
| GO:1900222 | negative regulation of amyloid-beta clearance | 9/3662 | 15/15509 | 0.00274196 | 0.0110141 | 0.00662366 | IFNG/TNF/TNF/TNF/TNF/TNF/TNF/TNF/TNF | 9 |
| GO:1903719 | regulation of I-kappaB phosphorylation | 9/3662 | 15/15509 | 0.00274196 | 0.0110141 | 0.00662366 | CX3CR1/TNF/TNF/TNF/TNF/TNF/TNF/TNF/TNF | 9 |
| GO:2000671 | regulation of motor neuron apoptotic process | 9/3662 | 15/15509 | 0.00274196 | 0.0110141 | 0.00662366 | ERBB3/MAP2K4/RHOA/ROCK1/BAX/ZPR1/CNTFR/MAP3K12/NEFL | 9 |
| GO:0019730 | antimicrobial humoral response | 39/3662 | 109/15509 | 0.00276053 | 0.0110743 | 0.00665987 | LTF/SLC11A1/LYZ/CTSG/IL17A/GNLY/SEMG1/H2BC11/SFTPD/CXCL13/PF4/NOD2/CXCL8/FGA/F2/H2BC21/PRTN3/ELANE/HMGN2/RPL39/HLA-E/HLA-E/HLA-A/HLA-A/HLA-A/HLA-A/HLA-E/HLA-A/HLA-A/HLA-E/HLA-E/HLA-A/HLA-E/HLA-A/HLA-E/H2BC6/H2BC7/ELANE/PRTN3 | 39 |
| GO:1990748 | cellular detoxification | 39/3662 | 109/15509 | 0.00276053 | 0.0110743 | 0.00665987 | MPO/PTGS1/BMP7/GSR/PARK7/PRDX1/PRDX6/MTARC2/ABCG2/UBIAD1/CAT/APOE/PXDN/SESN2/GSTM1/CD36/SOD1/GSTO1/FANCC/FABP1/ALB/NOS3/TP53INP1/GPX4/NXN/PRDX2/NQO1/TXNRD1/SELENOT/GPX3/LTC4S/HBE1/HBD/HBB/HP/SRXN1/TPO/GSTT1/LTC4S | 39 |
| GO:0033119 | negative regulation of RNA splicing | 12/3662 | 23/15509 | 0.00277493 | 0.0111033 | 0.00667733 | PTBP1/C1QBP/SRSF9/SRSF7/SRSF4/PTBP2/PTBP3/RBM42/TMBIM6/RBMX/NPM1/RBM10 | 12 |
| GO:0033630 | positive regulation of cell adhesion mediated by integrin | 12/3662 | 23/15509 | 0.00277493 | 0.0111033 | 0.00667733 | FERMT1/PIEZO1/LIF/PODXL/CCL21/CXCL13/SYK/ADAM9/CIB1/ITGB3/CCL5/CCL5 | 12 |
| GO:0051570 | regulation of histone H3-K9 methylation | 12/3662 | 23/15509 | 0.00277493 | 0.0111033 | 0.00667733 | KDM1A/KDM4A/ATRX/DNMT3B/SMARCB1/KDM3A/MYB/PRDM12/DNMT1/LMNA/PAX5/SMARCB1 | 12 |
| GO:0070207 | protein homotrimerization | 12/3662 | 23/15509 | 0.00277493 | 0.0111033 | 0.00667733 | SLC1A5/ASIC1/PXDN/HLA-G/HLA-G/HLA-G/HLA-G/HLA-G/HLA-G/HLA-G/HLA-G/MIF | 12 |
| GO:0046034 | ATP metabolic process | 62/3662 | 190/15509 | 0.00279129 | 0.0111616 | 0.00671237 | BAD/AK2/SLC4A1/IGF1/PKM/SIRT6/DNM1L/P2RX7/GPI/TGFB1/AK1/ENO3/ALDOC/NDUFC1/HSPA8/IFNG/IL4/ATP6V1A/ATP5PB/NDUFA8/CBFA2T3/PRKAA1/NT5E/OLA1/APP/ARNT/PKLR/PARP1/NDUFS6/OGT/ATP6V1B2/NDUFB9/NDUFC2/AK5/ATP5MC3/NDUFS2/NDUFV3/SLC2A6/AK4/VCP/NUDT5/LDHC/ATP5MG/GPD1/NDUFV1/DDIT4/NDUFS5/ATP5ME/PGAM1/ATP5MK/DNAJC30/ND6/MTOR/TMSB4X/ND4L/NDUFS3/FIS1/ATP5MF/EIF6/PKLR/GPI/LDHA | 62 |
| GO:0048844 | artery morphogenesis | 27/3662 | 69/15509 | 0.0028626 | 0.011432 | 0.00687499 | PRDM1/MYLK/NOTCH3/LRP2/APOB/SMAD7/NPRL3/EYA1/TGFBR1/ENG/BMPR1A/ZMIZ1/FOLR1/MDK/PDGFRB/HES1/PRRX1/PKD2/LRP1/SOX4/APOE/FKBP10/NOTCH1/RBPJ/NOG/ARID2/AKT3 | 27 |
| GO:2000736 | regulation of stem cell differentiation | 27/3662 | 69/15509 | 0.0028626 | 0.011432 | 0.00687499 | EIF2AK2/MBD3/SIRT6/GSK3B/ABL1/OSM/RBBP7/PTN/EZH2/CHD4/HSPA9/HES1/KDM3A/HDAC1/ZFP36/PDGFRA/FGF2/NOTCH1/ZFP36L2/RBBP4/CDK12/GATAD2A/KAT5/NKX2-5/NELFB/PRKDC/ITCH | 27 |
| GO:0099177 | regulation of trans-synaptic signaling | 117/3662 | 394/15509 | 0.00290278 | 0.011585 | 0.006967 | CD38/MAPK8IP2/TYROBP/CDH1/RASGRF1/PRKACA/GSK3B/ERC1/ACHE/PSMC5/ABL1/ADNP/NALCN/PLAT/PTN/DVL1/PPP3CB/DKK1/RNF167/CCL2/MPP2/ASIC1/DBN1/DLGAP3/RIMS3/CDC20/PCDH17/PAIP2/PTK2B/EGR2/STAU1/IL1B/PNKD/YWHAH/APOE/AKAP12/RARA/SYT11/EPHB2/KRAS/NGF/GLUL/SERPINE2/STXBP1/TUBB2B/PREPL/CLSTN3/ARRB2/EIF4A3/APP/SNAPIN/PLK2/CPLX2/NTRK2/EIF4EBP2/GRIK4/ITGB1/DGKE/SLC24A2/KIT/TPRG1L/ABR/CALM3/ZDHHC12/BRSK1/TBC1D24/DISC1/ZDHHC3/ADCY1/GPER1/CDK5/NSMF/PXK/CX3CR1/RGS14/ADRB2/CDH2/KIF5B/PRKCE/NPTX1/ATP2A2/HRAS/KCTD13/BDNF/GRIN1/KCNJ10/OXTR/ADIPOQ/ADGRB1/CACNB4/PLCB1/NOG/BTBD9/CNTN2/PRKN/DCC/CLN3/CNR2/MME/SRC/SYNGAP1/SIPA1L1/NTRK1/TNF/TNF/NPTXR/TNF/TNF/TNF/TNF/TNF/TNF/SHISA8/SHANK3/SQSTM1/PTEN/PRKACA | 117 |
| GO:0045229 | external encapsulating structure organization | 93/3662 | 304/15509 | 0.00292367 | 0.0116608 | 0.00701261 | NOX1/TNFRSF1B/COL23A1/TIE1/FBLN1/ITGA8/ADAMTS2/MMP2/NID2/ABL1/MMP11/CTSG/MMP9/FERMT1/LAMA1/ERCC2/TGFB1/HAS1/DNAJB6/TGFBR1/ENG/KAZALD1/SMOC2/NPHP3/FMOD/RECK/LRP1/BMP2/COLGALT1/PXDN/COL5A1/MYH11/LOXL2/PDGFRA/LAMC1/LCP1/IL6/ADAMTS7/MMP7/CYP1B1/COL2A1/RB1/ADAMTS17/FURIN/ADAMTS18/FKBP10/APP/CCN1/ADAMTS16/NOTCH1/GAS2/SERPINH1/ITGB1/ABI3BP/ADAMTS1/ADAMTSL3/MMP14/ADAMTS4/RUNX1/ADAMTS13/OLFML2B/MELTF/EGFLAM/TNFRSF11B/BMP1/ANTXR1/LAMB2/DAG1/ANXA2/COL18A1/TMPRSS6/THSD4/COL14A1/MMP1/COL27A1/COL13A1/SLC2A10/ELANE/COL4A6/DPP4/COL11A2/TNF/TNF/TNF/TNF/TNF/TNF/TNF/TNF/ITGB3/MYH11/ELANE/ADAMTS13 | 93 |
| GO:0010862 | positive regulation of pathway-restricted SMAD protein phosphorylation | 21/3662 | 50/15509 | 0.00301764 | 0.0120279 | 0.00723336 | HFE/BMP7/TGFB1/TGFBR1/ENG/BMPR1A/INHBA/BMP2/TWSG1/GDF15/SMAD4/BMP6/NODAL/INHBB/TGFBR2/GDF9/CSNK2B/CSNK2B/CSNK2B/CSNK2B/CSNK2B | 21 |
| GO:0002523 | leukocyte migration involved in inflammatory response | 13/3662 | 26/15509 | 0.00303686 | 0.0120579 | 0.00725144 | SELE/PTN/MDK/ELANE/TNF/TNF/TNF/TNF/TNF/TNF/TNF/TNF/ELANE | 13 |
| GO:0032682 | negative regulation of chemokine production | 13/3662 | 26/15509 | 0.00303686 | 0.0120579 | 0.00725144 | ARG2/MEFV/IL6/IL10/EPHA2/LGALS9/SIGIRR/LILRB4/ELANE/LILRB4/ELANE/LILRB4/LILRB4 | 13 |
| GO:0035929 | steroid hormone secretion | 13/3662 | 26/15509 | 0.00303686 | 0.0120579 | 0.00725144 | CRY1/KCNQ1/KDM5B/SPP1/CRHR1/CRY2/INHBA/CYP19A1/REN/BMP6/GDF9/FZD4/PTPN11 | 13 |
| GO:0048710 | regulation of astrocyte differentiation | 13/3662 | 26/15509 | 0.00303686 | 0.0120579 | 0.00725144 | KDM4A/HES1/ID2/BMP2/NR1D1/LIF/SERPINE2/IL6/NOTCH1/SHH/F2/NOG/CNTN2 | 13 |
| GO:0071218 | cellular response to misfolded protein | 13/3662 | 26/15509 | 0.00303686 | 0.0120579 | 0.00725144 | ATXN3/BAG6/UGGT2/AKIRIN2/DERL1/DNAJB12/VCP/RNF5/BAG6/BAG6/BAG6/BAG6/BAG6 | 13 |
| GO:1905508 | protein localization to microtubule organizing center | 13/3662 | 26/15509 | 0.00303686 | 0.0120579 | 0.00725144 | SPAG5/PCM1/GSK3B/PIBF1/NSFL1C/PARD6A/APC/NUMA1/BBS4/CSNK1D/CEP131/BICD1/DISC1 | 13 |
| GO:0021700 | developmental maturation | 84/3662 | 271/15509 | 0.00304777 | 0.0120935 | 0.00727284 | KDM1A/BTK/MBTPS2/LTF/IGF1/CDH3/AP3D1/RHOA/CBFB/FGFR3/SIRT2/EPHA8/PRKACA/PICALM/PGR/TUT7/MMP2/DLD/CDC25B/FERMT1/XYLT1/ERCC2/LYL1/HOXA5/GATA3/ZBTB16/FBXO5/WNT5A/HES1/EPAS1/CDC20/RAB32/FOXO3/PTBP3/SNX19/PTK2B/RECK/RAB38/SEMG1/RUNX2/C3/BMP2/KDR/ALDH1A2/EPO/EDNRB/ADAMTS7/STXBP1/CCL21/MTCH1/IL21/BRCA2/RB1/APP/SNAPIN/REN/NR4A2/B4GALT5/SPTBN4/DISC1/H3-3A/BAP1/EPB42/RBPJ/CX3CR1/S1PR1/FGG/PDE3A/CCL19/DAG1/LEP/DDIT3/CDK5R1/TYMS/FAM20C/RFLNB/CNTN2/BLOC1S3/L3MBTL3/CEBPA/GH1/NEFL/PTEN/PRKACA | 84 |
| GO:0048639 | positive regulation of developmental growth | 52/3662 | 155/15509 | 0.00308955 | 0.0122514 | 0.00736781 | PAFAH1B1/IGF1/NTN1/FGFR2/SLC23A2/ADNP/SMAD7/IL7/HAMP/CXCL12/BMPR1A/WNT3/RPS6KB1/PPARD/MAPK14/DBN1/FN1/GPAM/SERP1/CXCR4/SOX15/NGF/DBNL/HLX/FGF2/BBS4/CRABP2/SYT2/NOTCH1/POU4F2/SPTBN4/DISC1/TGFBR2/RBPJ/ZFPM2/CDK1/LPAR3/STAT5B/LEP/RAG2/BDNF/CDH4/PLCB1/CSF1/POU3F2/PRKN/ZP3/GDI1/TWF2/GH1/WNT3/WNT3 | 52 |
| GO:0032479 | regulation of type I interferon production | 35/3662 | 96/15509 | 0.00311027 | 0.0123179 | 0.00740776 | DHX33/MAVS/RIOK3/POLA1/TLR8/PYCARD/LILRB1/STAT1/IRF3/IRF5/TRAF3/POLR3F/PTPN22/IL10/TLR4/PPM1B/IRF8/NLRX1/TLR3/SYK/POLR3D/TRIM56/CD14/BANF1/PTPN11/SETD2/TRAIP/IRAK1/TLR7/CHUK/LILRB1/LILRB1/LILRB1/LILRB1/ITCH | 35 |
| GO:0032606 | type I interferon production | 35/3662 | 96/15509 | 0.00311027 | 0.0123179 | 0.00740776 | DHX33/MAVS/RIOK3/POLA1/TLR8/PYCARD/LILRB1/STAT1/IRF3/IRF5/TRAF3/POLR3F/PTPN22/IL10/TLR4/PPM1B/IRF8/NLRX1/TLR3/SYK/POLR3D/TRIM56/CD14/BANF1/PTPN11/SETD2/TRAIP/IRAK1/TLR7/CHUK/LILRB1/LILRB1/LILRB1/LILRB1/ITCH | 35 |
| GO:0051147 | regulation of muscle cell differentiation | 42/3662 | 120/15509 | 0.0031159 | 0.0123323 | 0.00741641 | PTBP1/IGF1/FGFR2/XBP1/PDGFB/NFATC2/LAMA1/PIEZO1/OLFM2/TGFB1/HAMP/GSK3A/EZH2/ENG/BMPR1A/DKK1/MAPK14/ID2/MORF4L2/BMP2/DNMT1/AKIRIN2/LAMC1/CCN3/TARBP2/ARRB2/SMAD4/NOTCH1/ZEB1/MMP14/KIT/MAML1/SHH/GPER1/FRS2/LAMB2/BDNF/NKX2-5/SETD3/FOXO4/MTOR/ZBED6 | 42 |
| GO:0009595 | detection of biotic stimulus | 20/3662 | 47/15509 | 0.00312847 | 0.0123662 | 0.00743683 | SRPX/NOD1/TLR4/NOD2/HLA-B/HLA-A/HLA-A/HLA-B/HLA-A/HLA-A/HLA-B/HLA-A/HLA-B/HLA-A/HLA-A/HLA-B/HLA-A/NAIP/NAIP/NAIP | 20 |
| GO:0052372 | modulation by symbiont of entry into host | 20/3662 | 47/15509 | 0.00312847 | 0.0123662 | 0.00743683 | CD4/CD74/MID2/TRIM14/TRIM25/NECTIN2/TRIM5/TRIM22/ITGAV/FURIN/GSN/TRIM68/LGALS9/CXCL8/TRIM8/CIITA/EXOC7/IFITM1/HMGB1/TRIM26 | 20 |
| GO:0010975 | regulation of neuron projection development | 121/3662 | 410/15509 | 0.00313716 | 0.0123927 | 0.00745274 | CD38/KDM1A/ITGA3/IFRD1/PAFAH1B1/MYLIP/CNTN1/HGF/GRN/CDH1/EPHA3/HSPA5/NTN1/RHOA/MARK2/PLXNA2/GSK3B/ABL1/ADNP/BMP7/NDRG4/SFRP1/SCN1B/GSK3A/PTN/EZH2/RAPGEF1/DVL1/GATA3/CXCL12/DKK1/WNT3/EFNB3/MDK/TMEM30A/DBN1/WNT5A/HES1/FN1/PRRX1/P3H1/CDC20/SPP1/PTK2B/OBSL1/ID1/STYXL1/YWHAH/CHN1/APOE/EPO/EPHB2/NGF/LRP4/ITM2C/DBNL/KIAA0319/TUBB2B/ACTR2/ABI2/IGF1R/RETREG3/CARM1/CRABP2/ABL2/SNAPIN/SLIT2/VLDLR/NTRK2/CAMK2G/POU4F2/DPYSL5/ARHGAP35/BRSK1/TBC1D24/GFI1/DISC1/PDLIM5/CDK5/NSMF/SEMA4C/EFNA1/SEMA3E/CDH2/ALK/LPAR3/MAP6/ENC1/KNDC1/CFL1/BRSK2/BDNF/CDK5R1/CDH4/PAK2/CREB3L2/RGMA/EPHB3/CNTN2/SS18L1/POU3F2/CIB1/INPP5J/ROR1/DCC/MAGI2/SYNGAP1/SIPA1L1/DNM3/MBP/NTRK1/GPRASP3/GDI1/TWF2/SHANK3/CUX1/B2M/NEFL/WNT3/WNT3/PTEN | 121 |
| GO:0062013 | positive regulation of small molecule metabolic process | 46/3662 | 134/15509 | 0.00315434 | 0.0124526 | 0.00748878 | IGF1/CD74/P2RX7/IFNG/PPARD/IL4/KAT2B/PARK7/NR4A3/CD244/IL1B/NR1D1/DYRK2/APOE/PRKAA1/PMAIP1/APP/ARNT/FOXO1/NDUFC2/BMP6/LDLRAP1/WNT4/FABP1/GPER1/NOS3/VCP/NNMT/GPD1/PTAFR/PRKCE/PTPN2/ADIPOQ/KLHL25/WDR5/SRC/MTOR/TNF/TMSB4X/TNF/TNF/TNF/TNF/TNF/TNF/TNF | 46 |
| GO:0000375 | RNA splicing, via transesterification reactions | 82/3662 | 264/15509 | 0.00318387 | 0.0125612 | 0.00755407 | KDM1A/PTBP1/ZCCHC8/SNRNP40/DDX20/DAZAP1/MBNL3/DDX1/SF3B2/RBM41/HNRNPC/CWF19L1/CIRBP/SNRPD3/TFIP11/SNU13/RBFOX2/PNN/PRPF6/SNRNP70/YJU2/CASC3/C1QBP/DDX5/EFTUD2/HSPA8/SRSF9/FAM172A/NCL/SF3B1/SRSF7/SRSF4/PRPF3/PTBP2/PRDX6/COIL/SMU1/SNRPC/RNF113A/HNRNPR/RALY/RBM42/AAR2/PRMT7/RBM17/SRPK2/HNRNPA1/SRSF1/PRPF4/NCBP1/DBR1/SCAF11/SNRPF/DHX38/EIF4A3/SF3B4/SNRPG/WTAP/LUC7L2/RBMX/CWC15/MBNL1/CWC27/RBM15/SNRPD1/SRRM2/USP39/HNRNPH1/ZRSR2/HNRNPA3/SMN1/LARP7/NPM1/RBM10/RNPC3/UBL5/LSM2/RBM15B/SRSF8/RBM8A/SRSF1/PRPF8 | 82 |
| GO:0048799 | animal organ maturation | 14/3662 | 29/15509 | 0.0032109 | 0.0126597 | 0.00761334 | MBTPS2/LTF/IGF1/RHOA/FGFR3/XYLT1/GATA3/ZBTB16/BMP2/ALDH1A2/ADAMTS7/LEP/RFLNB/GH1 | 14 |
| GO:0005996 | monosaccharide metabolic process | 73/3662 | 231/15509 | 0.00321293 | 0.0126597 | 0.00761334 | BAD/CRY1/IGF1/H6PD/KCNQ1/SLC2A3/PKM/PDK3/SIRT6/DUSP12/ZMPSTE24/SLC23A2/SLC25A1/PCK2/POFUT1/SLC39A14/GPI/GSK3A/BRAT1/ENO3/ALDOC/PPARD/MAPK14/KAT2B/PFKFB4/LEPR/GALE/SLC2A1/SERP1/DYRK2/SESN2/G6PC1/PER2/PRKAA1/KHK/PMAIP1/GALM/IGFBP3/OGT/GSTO1/SOGA1/DLAT/FOXO1/RANBP2/ADIPOR1/OMA1/ATF3/NUDT5/NNMT/GPD1/MST1/LEP/CHST1/PTPN2/ERFE/ADIPOQ/SLC25A10/GDPGP1/PRKN/KCNJ11/USP7/WDR5/FUT4/SRC/TNF/TNF/TNF/TNF/TNF/TNF/TNF/TNF/GPI | 73 |
| GO:0044380 | protein localization to cytoskeleton | 19/3662 | 44/15509 | 0.00322385 | 0.0126866 | 0.00762951 | SPAG5/PCM1/MID2/GSK3B/PIBF1/NSFL1C/ABL1/PARD6A/DVL1/APC/NUMA1/BBS4/CSNK1D/CEP131/BICD1/DISC1/MAPRE2/FAM83H/GAS2L1 | 19 |
| GO:1901985 | positive regulation of protein acetylation | 19/3662 | 44/15509 | 0.00322385 | 0.0126866 | 0.00762951 | BAZ1B/SNAI2/FOXP3/SMARCB1/GATA3/SF3B1/SOX4/DEK/LIF/PRKAA1/MYBBP1A/WBP2/SMAD4/SMARCA5/BRD7/KAT5/MUC1/SMARCB1/TADA2A | 19 |
| GO:0071634 | regulation of transforming growth factor beta production | 18/3662 | 41/15509 | 0.00329787 | 0.0129532 | 0.00778984 | TYROBP/FOXP3/CDH3/HSP90AB1/FERMT1/LILRB1/BMPR1A/FN1/THBS1/ITGAV/FURIN/SMAD4/LGALS9/CD24/LILRB1/LILRB1/LILRB1/LILRB1 | 18 |
| GO:0072698 | protein localization to microtubule cytoskeleton | 18/3662 | 41/15509 | 0.00329787 | 0.0129532 | 0.00778984 | SPAG5/PCM1/MID2/GSK3B/PIBF1/NSFL1C/ABL1/PARD6A/DVL1/APC/NUMA1/BBS4/CSNK1D/CEP131/BICD1/DISC1/MAPRE2/GAS2L1 | 18 |
| GO:1900087 | positive regulation of G1/S transition of mitotic cell cycle | 18/3662 | 41/15509 | 0.00329787 | 0.0129532 | 0.00778984 | KMT2E/CDC6/APEX1/CCND1/CCND3/RDX/CUL4A/CYP1A1/EGFR/ADAMTS1/LSM11/CUL4B/TERT/RRM1/RRM2/PLCB1/CDK10/TFDP1 | 18 |
| GO:0009267 | cellular response to starvation | 53/3662 | 159/15509 | 0.00330565 | 0.0129724 | 0.00780139 | RRAGD/FAS/CLEC16A/HSPA5/EIF2AK2/ASNS/SEH1L/GCN1/COMT/SH3GLB1/XBP1/NPRL3/SFRP1/MAPK8/RNF167/HSPA8/ELAPOR1/SLC2A1/FOXO3/CDKN1A/MAX/BECN1/ATG14/SESN2/PRKAA1/MYBBP1A/HNRNPA1/GLUL/TTC5/GABARAPL1/IGF1R/TNFRSF11A/PMAIP1/SESN3/FOXO1/KLF10/WIPI2/BRSK1/WNT4/ATF3/INHBB/ALB/ZFYVE1/FOS/PPM1D/EIF2AK3/KAT5/BRSK2/GAS2L1/AKR1C3/MAP3K5/ATG7/MTOR | 53 |
| GO:0019318 | hexose metabolic process | 68/3662 | 213/15509 | 0.00331043 | 0.0129724 | 0.00780139 | BAD/CRY1/IGF1/H6PD/KCNQ1/PKM/PDK3/SIRT6/DUSP12/ZMPSTE24/SLC25A1/PCK2/POFUT1/SLC39A14/GPI/GSK3A/BRAT1/ENO3/ALDOC/PPARD/MAPK14/KAT2B/PFKFB4/LEPR/GALE/SERP1/DYRK2/SESN2/G6PC1/PER2/PRKAA1/KHK/PMAIP1/GALM/IGFBP3/OGT/SOGA1/DLAT/FOXO1/RANBP2/ADIPOR1/OMA1/ATF3/NNMT/GPD1/MST1/LEP/CHST1/PTPN2/ERFE/ADIPOQ/SLC25A10/GDPGP1/PRKN/KCNJ11/USP7/WDR5/FUT4/SRC/TNF/TNF/TNF/TNF/TNF/TNF/TNF/TNF/GPI | 68 |
| GO:0051569 | regulation of histone H3-K4 methylation | 15/3662 | 32/15509 | 0.00331113 | 0.0129724 | 0.00780139 | KDM1A/KMT2E/DNMT3B/GATA3/MACROH2A1/MYB/DNMT1/SKIC8/SMAD4/OGT/GFI1/PYGO2/NNMT/HCFC1/WDR5 | 15 |
| GO:0090151 | establishment of protein localization to mitochondrial membrane | 15/3662 | 32/15509 | 0.00331113 | 0.0129724 | 0.00780139 | AGK/BAX/TIMM13/SAMM50/GZMB/TIMM9/PDCD5/MAPK8/TIMM10B/AP3B1/NMT1/TIMM8B/CALM3/TOMM20/TOMM5 | 15 |
| GO:0051924 | regulation of calcium ion transport | 77/3662 | 246/15509 | 0.00334205 | 0.0130529 | 0.00784976 | CD4/BAK1/CASR/CYBA/VMP1/MYLK/RHOA/PRKACA/P2RX5/BAX/FKBP1A/P2RX7/ABL1/PDGFB/LILRB1/CD33/JAK3/PIK3CG/TSPAN13/CXCL12/PPP3CB/CCL2/PDE4D/PDGFRB/HES1/PKD2/CRHR1/PTK2B/CXCR4/SEMG1/AHNAK/HSPA2/EPO/CACNG6/EGF/TMBIM6/ARRB2/PSEN2/CALM2/STAC/ANK2/CAMK2G/GSTO1/MS4A1/EPB41/STC1/CALM3/SELENON/C4orf3/GPER1/NOS3/CDK5/GEM/STIM1/PRKCE/IL16/GRIN1/CD19/F2/F2R/CACNB4/SLC8A1/PDE4B/STAC3/P2RX2/STIMATE/ITGB3/CCL5/CCL5/LILRB1/CCL4/CCL4/LILRB1/LILRB1/LILRB1/CCL4/PRKACA | 77 |
| GO:0006401 | RNA catabolic process | 74/3662 | 235/15509 | 0.00334696 | 0.0130529 | 0.00784976 | UPF1/SLC11A1/RNH1/RNASET2/TNFRSF1B/ZCCHC8/EDC4/PUM2/ELAVL1/ROCK1/SMG6/MLH1/TUT7/XRN2/FUS/ALKBH5/HNRNPC/AGO1/CIRBP/ZC3H14/APEX1/POP1/RNASEH2A/DDX49/SMG9/EXOSC3/TRDMT1/LARP4B/CASC3/DDX5/ZPR1/MAPK14/XRN1/SLIRP/NRDE2/TARDBP/CNOT1/ZFP36/ZC3H4/DKC1/GRSF1/TTC5/NCBP1/TOB1/EIF4A3/POLR2D/CNOT9/ZFP36L2/CARHSP1/PRKCA/CNOT11/ZC3H18/BTG2/MAPKAPK2/PRKCD/FASTK/EXOSC10/PAIP1/DCP2/ANGEL2/PDE12/ERN1/NPM1/RBM10/ZFP36L1/YTHDF3/SECISBP2/SMG5/GIGYF2/DXO/LSM2/GAS5/RBM8A/TAF15 | 74 |
| GO:0014037 | Schwann cell differentiation | 16/3662 | 35/15509 | 0.00335117 | 0.0130529 | 0.00784976 | ERBB3/SIRT2/ARHGEF10/CNTNAP1/EGR2/SOD1/NTRK2/PARD3/SKI/SLC25A46/CDK5/CDK1/LAMB2/DAG1/PLEC/POU3F2 | 16 |
| GO:0036336 | dendritic cell migration | 16/3662 | 35/15509 | 0.00335117 | 0.0130529 | 0.00784976 | SPI1/CDC42/PIK3CG/C1QBP/CXCR4/CCR7/CCL21/CCR5/CXCR1/LGALS9/CCL19/CALR/CXCR2/HMGB1/CCL5/CCL5 | 16 |
| GO:0043243 | positive regulation of protein-containing complex disassembly | 16/3662 | 35/15509 | 0.00335117 | 0.0130529 | 0.00784976 | SPAST/WDR1/ACTN2/DSTN/IGF1R/FYCO1/ADRB2/TNF/TNF/TNF/TNF/TNF/TNF/TNF/TNF/PDXP | 16 |
| GO:0048821 | erythrocyte development | 16/3662 | 35/15509 | 0.00335117 | 0.0130529 | 0.00784976 | SLC4A1/ALAS1/GATA1/ERCC2/SLC11A2/SH2B3/RHAG/BCL6/PTBP3/EPO/ABCB10/ALAS2/DMTN/BAP1/EPB42/L3MBTL3 | 16 |
| GO:0051693 | actin filament capping | 16/3662 | 35/15509 | 0.00335117 | 0.0130529 | 0.00784976 | SCIN/SPTB/ADD2/ADD1/MTPN/CAPZA1/RDX/GSN/DMTN/SPTBN4/SPTA1/SPTBN2/FLII/SPTAN1/IQANK1/TWF2 | 16 |
| GO:0060441 | epithelial tube branching involved in lung morphogenesis | 16/3662 | 35/15509 | 0.00335117 | 0.0130529 | 0.00784976 | FGFR2/LAMA1/HOXA5/KRAS/SPRY2/NKX2-1/SHH/DAG1/TNF/TNF/TNF/TNF/TNF/TNF/TNF/TNF | 16 |
| GO:0001837 | epithelial to mesenchymal transition | 51/3662 | 152/15509 | 0.00335482 | 0.0130529 | 0.00784976 | WNT16/IGF1/SNAI2/HGF/EPHA3/FGFR2/ROCK1/FGFR1/GSK3B/BMP7/SMAD7/SFRP1/TGFB1/EZH2/TGFBR1/AKNA/ENG/GATA3/DDX5/MDK/PPP2CA/WNT5A/IL1B/BMP2/LOXL2/SPRY2/IL6/NKX2-1/SMAD4/NOTCH1/TCF7L2/HMGA2/ADIPOR1/WNT4/TGFBR2/HEYL/RBPJ/EFNA1/PTK2/DAG1/SMAD2/RFLNB/NOG/ZNF703/BCL9L/SPRED2/MTOR/MCRIP1/PDCD6/LRP6/PTEN | 51 |
| GO:0051048 | negative regulation of secretion | 51/3662 | 152/15509 | 0.00335482 | 0.0130529 | 0.00784976 | RHBDF1/CRY1/CD74/TNFRSF1B/ATP9A/ERBB3/SPI1/FCGR2B/OPRK1/OSM/SFRP1/LILRB1/PSMD9/ASIC1/IL12B/VAMP8/CRY2/INHBA/IL1B/PNKD/LIF/APOE/SYT11/CCN3/EGF/NOTCH1/FOXO1/GJA1/INHBB/LGALS9/LEP/PTPN11/OXTR/ADIPOQ/F2R/ADRA2C/PRKN/KCNJ11/PIM3/TNF/TNF/TNF/TNF/TNF/TNF/TNF/TNF/LILRB1/LILRB1/LILRB1/LILRB1 | 51 |
| GO:0071453 | cellular response to oxygen levels | 51/3662 | 152/15509 | 0.00335482 | 0.0130529 | 0.00784976 | BAD/NOX1/FAS/CASR/HIPK2/PDK3/SIRT2/ATP6AP1/BMP7/SFRP1/PPARD/SLC29A1/ATP6V1A/EPAS1/MPL/FOXO3/DNMT3A/EGR1/HP1BP3/GNGT1/AJUBA/PRKAA1/ATP6V1G1/TMBIM6/PMAIP1/CCNA2/NOTCH1/FOXO1/POU4F2/DDAH1/NDUFS2/STC1/LMNA/AK4/FABP1/TERT/CYBB/AQP3/HIF1AN/RBPJ/FOS/PRKCE/SLC8A1/IRAK1/ZFP36L1/SRC/ATG7/MTOR/TMEM199/LOC102724560/PTEN | 51 |
| GO:0048709 | oligodendrocyte differentiation | 34/3662 | 93/15509 | 0.00335784 | 0.0130564 | 0.00785188 | TMEM98/CNTN1/TNFRSF1B/WDR1/TP73/CSK/ERCC2/PTN/CNTNAP1/MDK/HES1/HDAC1/EIF2B2/CLU/CXCR4/MYRF/NKX2-2/WASF3/TSPAN2/NKX2-1/DUSP10/TNFRSF21/NTRK2/NOTCH1/B4GALT5/SHH/CDK5/DAG1/CNP/KCNJ10/SUZ12/CNTN2/MTOR/PTEN | 34 |
| GO:0003231 | cardiac ventricle development | 41/3662 | 117/15509 | 0.00337835 | 0.0131279 | 0.0078949 | PKP2/PRDM1/FGFR2/LRP2/ZMPSTE24/FKBP1A/HECTD1/DSP/SMAD7/NPRL3/TGFB1/GSK3A/TGFBR1/ENG/GATA3/BMPR1A/NSD2/WNT5A/HES1/TNNT2/SOX4/TNNI3/SMAD6/GREB1L/SMAD4/CCN1/SLIT2/NOTCH1/POU4F1/TNNI1/RBM15/TGFBR2/HEYL/NOS3/FRS2/DCTN5/RBPJ/ZFPM2/NKX2-5/NOG/SLIT3 | 41 |
| GO:0007422 | peripheral nervous system development | 28/3662 | 73/15509 | 0.0033927 | 0.0131672 | 0.00791851 | RUNX3/ERBB3/SIRT2/ALDH3A2/ARHGEF10/CNTNAP1/EGR2/HOXD9/NGF/EDNRB/SOD1/NTRK2/PARD3/POU4F1/SKI/RUNX1/ISL2/SLC25A46/CDK5/CDK1/LAMB2/DAG1/BDNF/PLEC/ADGRB1/POU3F2/SLC5A3/TBCE | 28 |
| GO:2001021 | negative regulation of response to DNA damage stimulus | 28/3662 | 73/15509 | 0.0033927 | 0.0131672 | 0.00791851 | KDM1A/SNAI2/CD74/CD44/TMEM161A/TFIP11/YJU2/CXCL12/RECQL5/FBXO5/CLU/SHLD2/AUNIP/DYRK3/RADX/HMGA2/ZNF385A/RNF169/NUDT16L1/TRIAP1/BCL2L1/RMI2/MAGEF1/PTTG1IP/CHEK2/MUC1/RTEL1/MIF | 28 |
| GO:0002830 | positive regulation of type 2 immune response | 10/3662 | 18/15509 | 0.00345698 | 0.0133581 | 0.00803331 | CD74/IL4R/GATA3/CD81/IL4/CD86/RARA/IL6/IL18/NOD2 | 10 |
| GO:0044154 | histone H3-K14 acetylation | 10/3662 | 18/15509 | 0.00345698 | 0.0133581 | 0.00803331 | BRPF3/GATA3/DR1/WBP2/KAT14/MBIP/BRPF1/TADA3/WDR5/TADA2A | 10 |
| GO:0045342 | MHC class II biosynthetic process | 10/3662 | 18/15509 | 0.00345698 | 0.0133581 | 0.00803331 | SLC11A1/SPI1/XBP1/IFNG/IL4/IL10/TLR4/PF4/TAF7/CIITA | 10 |
| GO:0045624 | positive regulation of T-helper cell differentiation | 10/3662 | 18/15509 | 0.00345698 | 0.0133581 | 0.00803331 | IL4R/IL12RB1/IL12B/CD86/MYB/CD80/RARA/HLX/IL18/CCL19 | 10 |
| GO:0051798 | positive regulation of hair follicle development | 10/3662 | 18/15509 | 0.00345698 | 0.0133581 | 0.00803331 | WNT5A/NUMA1/TNF/TNF/TNF/TNF/TNF/TNF/TNF/TNF | 10 |
| GO:0060008 | Sertoli cell differentiation | 10/3662 | 18/15509 | 0.00345698 | 0.0133581 | 0.00803331 | ARID4B/ATRX/GATA1/IL1A/SDC1/RARA/HSD17B4/RAB13/WNT4/NTRK1 | 10 |
| GO:0070242 | thymocyte apoptotic process | 10/3662 | 18/15509 | 0.00345698 | 0.0133581 | 0.00803331 | BAK1/BAX/JAK3/WNT5A/BCL11B/BCL2L11/RAG1/EFNA1/PTCRA/CHEK2 | 10 |
| GO:0009205 | purine ribonucleoside triphosphate metabolic process | 67/3662 | 210/15509 | 0.00358894 | 0.0138594 | 0.00833477 | BAD/AK2/SLC4A1/IGF1/PKM/RHOA/SIRT6/DNM1L/P2RX7/GPI/TGFB1/AK1/ENO3/ALDOC/NDUFC1/HSPA8/IFNG/IL4/ATP6V1A/ATP5PB/NDUFA8/ITPA/CBFA2T3/PRKAA1/NT5E/OLA1/APP/ARNT/PKLR/PARP1/NDUFS6/OGT/ATP6V1B2/NDUFB9/AK3/NDUFC2/AK5/ATP5MC3/NDUFS2/NDUFV3/SLC2A6/AK4/VCP/NUDT5/LDHC/ATP5MG/GPD1/NDUFV1/DDIT4/NDUFS5/ATP5ME/PGAM1/ATP5MK/DNAJC30/ENTPD7/ND6/MTOR/TMSB4X/ND4L/NDUFS3/FIS1/NME1/ATP5MF/EIF6/PKLR/GPI/LDHA | 67 |
| GO:0051258 | protein polymerization | 79/3662 | 254/15509 | 0.00359611 | 0.0138784 | 0.00834622 | SCIN/TTC17/CYFIP2/RHOA/NAV3/SPTB/NDE1/ADD2/UBE2K/ADD1/DNM1L/TPX2/ABL1/HCK/CHMP4B/COTL1/PYCARD/MTPN/MET/CSF3/RANGRF/ARPC3/FBXO5/DBN1/ARL6/CAPZA1/STMN1/PTK2B/EML2/CCR7/CDC42EP1/ARPC1B/WASF3/PSRC1/DBNL/CCL21/NUMA1/RDX/HAUS2/DIAPH3/SLAIN1/BBS4/CSNK1D/TBCD/SLIT2/ARHGAP18/GSN/CDC42EP2/DMTN/SPTBN4/ALOX15/ARPC5/CDC42EP3/SPTA1/PRKCD/RICTOR/GOLGA2/GPX4/PRKCE/FGG/FGA/CCL11/SPTBN2/CDK5R1/MIEF2/FLII/GRB2/INPP5J/PRKN/DRG1/SPTAN1/MSRB1/MTOR/IQANK1/TMSB4X/ARPC1A/TWF2/NDE1/NEFL | 79 |
| GO:0048704 | embryonic skeletal system morphogenesis | 33/3662 | 90/15509 | 0.00362413 | 0.0139691 | 0.00840079 | HOXA11/ALX4/FGFR2/NDST1/TULP3/HOXA9/MTHFD1/BMP7/EYA1/HOXA5/TGFBR1/HOXB6/PRRX1/MTHFD1L/RUNX2/HOXD3/HOXD9/PDGFRA/TFAP2A/COL2A1/EIF4A3/ZEB1/NODAL/MMP14/TGFBR2/HOXD4/HOXB2/SMAD2/SETD2/NOG/PAX5/HOXA4/PCGF2 | 33 |
| GO:2001251 | negative regulation of chromosome organization | 33/3662 | 90/15509 | 0.00362413 | 0.0139691 | 0.00840079 | BAZ1B/SMG6/NDC80/ATRX/ZW10/BIRC5/HNRNPC/NBN/FBXO5/RAD50/XRN1/CDC20/TEX14/POT1/TOP2A/CCNB1/CDCA8/APC/HNRNPA1/PIF1/PARP1/SPC25/SMARCA5/H3-3A/BUB1/EXOSC10/DCP2/ZWILCH/AURKB/SRC/TEN1/RTEL1/TINF2 | 33 |
| GO:0071300 | cellular response to retinoic acid | 27/3662 | 70/15509 | 0.00362836 | 0.0139767 | 0.00840536 | EPHA3/FGFR2/GSK3B/WNT3/WNT5B/FZD10/WNT5A/PTK2B/ALDH1A2/RARA/ABL2/ZNF35/RARG/LEP/FZD4/WNT7B/TNF/TNF/TNF/TNF/TNF/TNF/TNF/TNF/TWF2/WNT3/WNT3 | 27 |
| GO:0071826 | ribonucleoprotein complex subunit organization | 62/3662 | 192/15509 | 0.00365469 | 0.0140694 | 0.0084611 | EIF4B/DDX20/XRCC5/DDX1/SF3B2/RPL6/AGO1/HSP90AB1/SNRPD3/TFIP11/SNU13/PRPF6/EIF3J/YJU2/EIF3B/EIF4H/EIF3A/NOP2/SRSF9/BRIX1/SF3B1/PRPF3/PTBP2/COIL/SNRPC/EIF2S2/AAR2/ERAL1/PRMT7/SRPK2/SRSF1/NCBP1/SCAF11/SNRPF/TARBP2/SF3B4/DYRK3/SNRPG/POLR2D/ABT1/LUC7L2/RBMX/EIF3H/EIF3M/VCP/RPL10L/SNRPD1/USP39/ZRSR2/KIF5B/SMN1/CLP1/EIF3C/RRP7A/RPL23A/LSM2/PWP2/EIF6/PRKDC/BOP1/SRSF1/PRPF8 | 62 |
| GO:0045664 | regulation of neuron differentiation | 57/3662 | 174/15509 | 0.00366154 | 0.0140783 | 0.00846644 | SPAG9/KDM4A/RHOA/ROCK1/TCF3/NOTCH3/RAP1GAP/FGFR1/TP73/GSK3B/DPYSL2/BMP7/EYA1/SFRP1/ESRP1/CXCL12/DKK1/DDX6/BCL6/HES1/ID2/FOXO3/TGIF2/NKX2-2/BMP2/BCL11B/YWHAH/HOXD3/EPO/CASZ1/RARA/NGF/EDNRB/FGF2/CSNK1D/APP/MEIS1/CTDSP1/NOTCH1/ZEB1/ITGB1/POU4F2/BMP6/ISL2/HEYL/SHH/ALK/BDNF/CDK5R1/CALR/S1PR5/NKX2-5/CNTN2/ADRA2C/PBX1/CPNE1/B2M | 57 |
| GO:1903828 | negative regulation of protein localization | 57/3662 | 174/15509 | 0.00366154 | 0.0140783 | 0.00846644 | TMEM98/RHBDF1/SPI1/SP100/VPS35/DERL2/PICALM/LMAN1/SIRT6/ACTN2/GSK3B/NSFL1C/HECTD1/RANGAP1/FERMT1/NDFIP2/CSK/SFRP1/TGFB1/PSMD9/IL12B/MACROH2A1/TMEM59/PARK7/IL1B/APOE/NDFIP1/PPFIA1/CD36/MDFIC/CCN3/TRIM29/SNX12/FOXO1/BAG3/DMTN/AP2M1/INHBB/CDK5/PKIG/BCL2L1/PTPN11/YOD1/ADIPOQ/F2R/PRKN/LILRB4/KCNJ11/FZD9/SVIP/PIM3/WWP2/UBE2J1/GDI1/LILRB4/LILRB4/LILRB4 | 57 |
| GO:0070828 | heterochromatin organization | 30/3662 | 80/15509 | 0.00368022 | 0.0141414 | 0.00850437 | KDM1A/SIRT2/MBD3/SIRT6/MECOM/AXIN1/DOT1L/EZH2/EZH1/AICDA/FAM172A/HDAC1/DNMT3A/HELLS/HP1BP3/DNMT1/LOXL2/PPHLN1/TET1/RB1/HMGA2/SMARCA5/CTBP1/LMNA/H3-3A/PPM1D/H1-0/HMGB1/PHF2/L3MBTL3 | 30 |
| GO:0044839 | cell cycle G2/M phase transition | 48/3662 | 142/15509 | 0.00368394 | 0.0141469 | 0.00850769 | USH1C/FHL1/NDC80/ABCB1/CDC6/CDC7/CDC25B/RBBP8/RAB11A/NBN/CCND1/FOXM1/FBXO5/CCNG1/RAD50/MACROH2A1/MASTL/CDKN1A/HSPA2/FBXL12/PKMYT1/CCNB1/NABP2/APP/ENSA/DTL/DYRK3/INTS3/CALM2/CCNA2/CALM3/BRSK1/MRNIP/DBF4B/WEE1/RRM1/AVEN/CDK1/PPM1D/NABP1/BRSK2/AURKB/RCC2/NPM1/PLCB1/CHEK2/FOXO4/PBX1 | 48 |
| GO:0031023 | microtubule organizing center organization | 44/3662 | 128/15509 | 0.00371635 | 0.0142537 | 0.00857191 | PAFAH1B1/SDCCAG8/FBXW11/NDE1/PCM1/NDC80/XPO1/CHMP5/NSFL1C/CHMP4B/PARD6A/NUBP1/CEP152/ARHGEF10/CHORDC1/KAT2B/GADD45A/SSX2IP/PKD2/UXT/FOXJ1/CEP85/CHMP1A/ODF2/HAUS2/BCL2L10/BRCA2/BBS4/CEP131/PLK2/BRSK1/CCNL1/MAP9/GOLGA2/PDCD6IP/CDK1/CEP135/NPM1/CEP63/HAUS3/CCNL2/NDE1/CHORDC1/SPICE1 | 44 |
| GO:1903844 | regulation of cellular response to transforming growth factor beta stimulus | 44/3662 | 128/15509 | 0.00371635 | 0.0142537 | 0.00857191 | ITGA3/HSPA5/ARID4B/HIPK2/ITGA8/FKBP1A/GLG1/HSP90AB1/FERMT1/SMAD7/RBBP7/AXIN1/TGFB1/ENG/FOLR1/ZNF451/IL4/HDAC1/BMP2/PIN1/CDKN1C/MEN1/SPRY2/NKX2-1/THBS1/SMAD6/TET1/FBN2/SMAD4/OGT/ZEB1/SKI/RBBP4/SAP30/HTRA1/ZEB2/SMAD2/EID2/ZNF703/BCL9L/TRIM33/SLC2A10/SPRED2/CDKN1C | 44 |
| GO:0032868 | response to insulin | 74/3662 | 236/15509 | 0.00376971 | 0.0144494 | 0.00868961 | CRY1/KCNQ1/PKM/OPRK1/GSK3B/RAB10/XBP1/PCK2/TSC2/SLC39A14/GSK3A/RPS6KB1/MAPK14/CCND3/KAT2B/NCL/STAT1/SRSF4/SLC2A1/EGR1/CRY2/CAT/TNFSF10/EGR2/NCOA5/IL1B/MAX/SESN2/PRKAA1/LPIN3/APC/IL10/SORL1/KHK/RB1/IGF1R/MEAK7/TNFRSF11A/RAB13/PKLR/PARP1/PIK3R1/OGT/EIF4EBP2/SESN3/SOGA1/FOXO1/POU4F2/APPL1/ADIPOR1/SHC1/INHBB/PRKCD/ZNF592/SLC27A4/FOS/SLC25A33/ESRRA/LEP/PTPN2/LPL/GRB2/ERFE/PTPN11/ADIPOQ/FOXO4/SOCS1/ZFP36L1/SRC/MTOR/EIF6/PRKDC/PKLR/PIP4K2B | 74 |
| GO:0060986 | endocrine hormone secretion | 22/3662 | 54/15509 | 0.00381371 | 0.014609 | 0.0087856 | CRY1/KCNQ1/OPRK1/GATA3/KDM5B/SPP1/CRHR1/CRY2/INHBA/IL1B/CYP19A1/SMAD4/REN/GJA1/BMP6/INHBB/GDF9/TRPV6/LEP/FZD4/PTPN11/TRPV6 | 22 |
| GO:0006091 | generation of precursor metabolites and energy | 133/3662 | 458/15509 | 0.00382028 | 0.0146251 | 0.00879531 | SLC4A1/CIAPIN1/IGF1/GLRX2/AIFM2/H6PD/CYBA/PUM2/CS/PHKA1/PKM/RHOA/ACADVL/SIRT6/GSK3B/OXCT1/NOX4/P2RX7/DLD/MSH2/ACO2/DHRS2/IDH3B/PRPS2/SLC25A14/GSR/GYS1/GPI/GSK3A/PPIF/ENO3/ALDOC/NDUFC1/IFNG/PPARD/NNT/IL4/GNPDA1/PASK/PARK7/ATP5PB/LEPR/HMGCL/STBD1/NDUFA8/NR4A3/PPP1R3C/CAT/SLC25A51/SLC25A23/NR1D1/TRAP1/DYRK2/CBFA2T3/COX7B/G6PC1/PER2/PRKAA1/MYBBP1A/LOXL2/CCNB1/ISCU/IREB2/FDX1/CYP19A1/KHK/COX17/GABARAPL1/CYP1A2/APP/ARNT/PKLR/NDUFS6/OGT/NDUFB9/DLAT/NDUFC2/QDPR/ACSS1/NDUFS2/NDUFV3/SLC2A6/AK4/TKT/FXN/CYBB/VCP/ENOX2/IDH3A/ATP5MG/GPD1/NDUFV1/DDIT4/NDUFS5/ATP5ME/PRELID1/CDK1/PGAM1/SLC25A33/SUCLG2/LEP/PDE12/DNAJC30/PLEC/COX5A/ADIPOQ/PHLDA2/IDH2/PPP1R2/SHPK/ND6/CYTB/MTOR/COX3/TNF/TNF/ND4L/NDUFS3/TNF/TNF/TNF/TNF/TNF/TNF/ADSL/ATP5MF/EIF6/IL10RB/CEBPA/THTPA/PKLR/GPI/LDHA | 133 |
| GO:0006457 | protein folding | 63/3662 | 196/15509 | 0.0038412 | 0.0146475 | 0.00880875 | CD74/GRN/HSPA5/DNAJC25/NFYC/LMAN1/FKBP1A/NUDC/HSP90AB1/PPIL2/SNRNP70/PDCD5/DNAJB6/HSPB1/BAG1/PPIF/CCDC47/GRPEL1/CRYAB/HSPA8/CHORDC1/HSPA9/PFDN1/TTC1/PDCL3/HSPE1/WIPF1/P3H1/CLU/FKBP9/PFDN5/TRAP1/HSPA2/HSPBP1/CCT7/TBCD/FKBP10/ANP32E/DNAJB12/BAG3/CWC27/CLGN/RANBP2/PDIA4/PEX19/CCT2/RIC3/PPIC/AHSP/NUDCD2/AHSA2P/CALR/ALG12/PPIA/PFDN6/HSPA1L/HSPA1L/HSPA1L/HSPA1L/HSPA1L/B2M/TBCE/CHORDC1 | 63 |
| GO:0002638 | negative regulation of immunoglobulin production | 8/3662 | 13/15509 | 0.00384975 | 0.0146475 | 0.00880875 | CD22/PARP3/FOXP3/FCGR2B/BCL6/NDFIP1/TMBIM6/CR1 | 8 |
| GO:0006855 | xenobiotic transmembrane transport | 8/3662 | 13/15509 | 0.00384975 | 0.0146475 | 0.00880875 | ABCC2/ATP8B1/ABCC3/TMEM30A/SLC29A1/ABCC4/ABCA3/SLC19A1 | 8 |
| GO:0030214 | hyaluronan catabolic process | 8/3662 | 13/15509 | 0.00384975 | 0.0146475 | 0.00880875 | CD44/HEXB/HYAL2/HMMR/TGFB1/CEMIP2/FGF2/GUSB | 8 |
| GO:0031272 | regulation of pseudopodium assembly | 8/3662 | 13/15509 | 0.00384975 | 0.0146475 | 0.00880875 | CDC42/CCR7/CDC42EP1/APC/CCL21/CDC42EP2/KIT/CDC42EP3 | 8 |
| GO:0031274 | positive regulation of pseudopodium assembly | 8/3662 | 13/15509 | 0.00384975 | 0.0146475 | 0.00880875 | CDC42/CCR7/CDC42EP1/APC/CCL21/CDC42EP2/KIT/CDC42EP3 | 8 |
| GO:0034349 | glial cell apoptotic process | 8/3662 | 13/15509 | 0.00384975 | 0.0146475 | 0.00880875 | CCL2/AKAP12/RB1/TNFRSF21/PRKCA/PRKCD/CASP3/CDK5 | 8 |
| GO:0045064 | T-helper 2 cell differentiation | 8/3662 | 13/15509 | 0.00384975 | 0.0146475 | 0.00880875 | IL4R/GATA3/IL4/BCL6/CD86/RARA/HLX/IL18 | 8 |
| GO:0045760 | positive regulation of action potential | 8/3662 | 13/15509 | 0.00384975 | 0.0146475 | 0.00880875 | TNF/TNF/TNF/TNF/TNF/TNF/TNF/TNF | 8 |
| GO:1905906 | regulation of amyloid fibril formation | 8/3662 | 13/15509 | 0.00384975 | 0.0146475 | 0.00880875 | CRYAB/PFDN1/CLU/IAPP/PFDN5/APOE/APP/PFDN6 | 8 |
| GO:0014855 | striated muscle cell proliferation | 26/3662 | 67/15509 | 0.00387558 | 0.0147367 | 0.0088624 | HGF/FGFR2/TP73/ABL1/NDRG4/TGFBR1/BMPR1A/PPARD/MAPK14/KPNA1/FGF2/NOTCH1/SKI/RUNX1/SELENON/TGFBR2/SHH/RBPJ/ZFPM2/CDK1/FOS/NKX2-5/NOG/ARID2/SRC/PTEN | 26 |
| GO:0043433 | negative regulation of DNA-binding transcription factor activity | 51/3662 | 153/15509 | 0.00389869 | 0.0148155 | 0.00890979 | KDM1A/UFL1/FOXP3/SPI1/SP100/ESR1/NFKBIA/BMP7/SMAD7/SETD6/PYCARD/TAX1BP1/EZH2/SFRP4/HES1/ID2/TNFAIP3/PKD2/SFRP5/CAT/RBCK1/ID1/FOXJ1/TRAF3/MEN1/BHLHE40/IL10/CYP1B1/RB1/ARRB2/HES6/TCF7L2/COMMD7/POU4F2/PRMT2/GFI1/HEYL/BTRC/NOD2/PRDX2/DDIT3/CTNNBIP1/TRAIP/IRAK1/SIGIRR/USP7/TFDP1/WWP2/TMSB4X/CHUK/ITCH | 51 |
| GO:0045333 | cellular respiration | 69/3662 | 218/15509 | 0.00391827 | 0.0148717 | 0.00894356 | AIFM2/PUM2/CS/RHOA/DLD/MSH2/ACO2/IDH3B/SLC25A14/PPIF/NDUFC1/IFNG/NNT/IL4/PARK7/ATP5PB/NDUFA8/NR4A3/CAT/SLC25A51/SLC25A23/TRAP1/CBFA2T3/COX7B/MYBBP1A/CCNB1/ISCU/IREB2/CYP1A2/NDUFS6/NDUFB9/DLAT/NDUFC2/NDUFS2/NDUFV3/AK4/FXN/VCP/IDH3A/ATP5MG/GPD1/NDUFV1/NDUFS5/ATP5ME/PRELID1/CDK1/SLC25A33/SUCLG2/PDE12/DNAJC30/PLEC/COX5A/IDH2/ND6/CYTB/COX3/TNF/TNF/ND4L/NDUFS3/TNF/TNF/TNF/TNF/TNF/TNF/ADSL/ATP5MF/IL10RB | 69 |
| GO:0060560 | developmental growth involved in morphogenesis | 69/3662 | 218/15509 | 0.00391827 | 0.0148717 | 0.00894356 | IFRD1/PAFAH1B1/SPAG9/CDH1/CYFIP2/NTN1/FGFR2/GSK3B/SLC23A2/ESR1/DPYSL2/HSP90AB1/ABL1/ADNP/SFRP1/DVL1/CXCL12/PPP3CB/WNT3/AREG/DBN1/WNT5A/TTL/ITGA4/FN1/KDM5B/NRP2/SPP1/CXCR4/USP9X/FLRT3/APOE/NGF/SPRY2/DBNL/KIAA0319/ST8SIA2/APP/CRABP2/SYT2/SLIT2/C9orf72/NOTCH1/ITGB1/POU4F2/DISC1/TGFBR2/SHH/CDK5/SEMA4C/SEMA3E/S1PR1/LPAR3/LAMB2/CCL11/RARG/BDNF/CDH4/SLIT3/CSF1/PRKN/DCC/MAGI2/WNT7B/GDI1/CPNE1/TWF2/WNT3/WNT3 | 69 |
| GO:0030728 | ovulation | 11/3662 | 21/15509 | 0.00399435 | 0.0150865 | 0.00907276 | IL4R/PGR/MMP2/PLAT/FOXO3/INHBA/GAS2/ADAMTS1/INHBB/NOS3/LEP | 11 |
| GO:0031468 | nuclear membrane reassembly | 11/3662 | 21/15509 | 0.00399435 | 0.0150865 | 0.00907276 | SPAST/SIRT2/CHMP5/NSFL1C/CHMP4B/UBE2I/CHMP1A/REEP3/BANF1/CHMP6/ANKLE2 | 11 |
| GO:0050966 | detection of mechanical stimulus involved in sensory perception of pain | 11/3662 | 21/15509 | 0.00399435 | 0.0150865 | 0.00907276 | CXCL12/CXCR4/NTRK1/TNF/TNF/TNF/TNF/TNF/TNF/TNF/TNF | 11 |
| GO:0051767 | nitric-oxide synthase biosynthetic process | 11/3662 | 21/15509 | 0.00399435 | 0.0150865 | 0.00907276 | MAP2K4/FCER2/JAK3/CCL2/MAP2K6/IFNG/STAT1/KDR/AKAP12/TLR4/NOD2 | 11 |
| GO:0051769 | regulation of nitric-oxide synthase biosynthetic process | 11/3662 | 21/15509 | 0.00399435 | 0.0150865 | 0.00907276 | MAP2K4/FCER2/JAK3/CCL2/MAP2K6/IFNG/STAT1/KDR/AKAP12/TLR4/NOD2 | 11 |
| GO:0071816 | tail-anchored membrane protein insertion into ER membrane | 11/3662 | 21/15509 | 0.00399435 | 0.0150865 | 0.00907276 | BAG6/UBL4A/SGTA/EMC3/EMC4/EMC10/BAG6/BAG6/BAG6/BAG6/BAG6 | 11 |
| GO:1901522 | positive regulation of transcription from RNA polymerase II promoter involved in cellular response to chemical stimulus | 11/3662 | 21/15509 | 0.00399435 | 0.0150865 | 0.00907276 | XBP1/CREB3/SMAD5/CHD6/RUNX2/BMP2/CARF/SMAD4/RBPJ/RELA/JUN | 11 |
| GO:2000819 | regulation of nucleotide-excision repair | 11/3662 | 21/15509 | 0.00399435 | 0.0150865 | 0.00907276 | ARID1B/ACTB/BCL7C/SMARCB1/SMARCD2/BCL7A/ARID1A/CUL4A/BRD7/ARID2/SMARCB1 | 11 |
| GO:0010976 | positive regulation of neuron projection development | 47/3662 | 139/15509 | 0.00400098 | 0.0151024 | 0.0090823 | KDM1A/ITGA3/PAFAH1B1/CNTN1/HGF/GRN/EPHA3/HSPA5/MARK2/ABL1/ADNP/BMP7/NDRG4/SCN1B/PTN/EZH2/RAPGEF1/DVL1/MDK/TMEM30A/DBN1/WNT5A/P3H1/PTK2B/STYXL1/APOE/EPO/EPHB2/DBNL/TUBB2B/ACTR2/IGF1R/RETREG3/ABL2/VLDLR/NTRK2/ARHGAP35/DISC1/ALK/ENC1/BDNF/CREB3L2/ROR1/MAGI2/NTRK1/GPRASP3/TWF2 | 47 |
| GO:0060688 | regulation of morphogenesis of a branching structure | 21/3662 | 51/15509 | 0.00400548 | 0.0151101 | 0.00908697 | SNAI2/HGF/FGFR2/SIRT6/ESR1/ABL1/BMP7/SFRP1/MDK/WNT5A/SHH/NOG/FKBPL/TNF/TNF/TNF/TNF/TNF/TNF/TNF/TNF | 21 |
| GO:0017015 | regulation of transforming growth factor beta receptor signaling pathway | 43/3662 | 125/15509 | 0.00403443 | 0.0152101 | 0.00914709 | ITGA3/HSPA5/ARID4B/HIPK2/ITGA8/FKBP1A/GLG1/HSP90AB1/FERMT1/SMAD7/RBBP7/AXIN1/TGFB1/ENG/FOLR1/ZNF451/HDAC1/BMP2/PIN1/CDKN1C/MEN1/SPRY2/NKX2-1/THBS1/SMAD6/TET1/FBN2/SMAD4/OGT/ZEB1/SKI/RBBP4/SAP30/HTRA1/ZEB2/SMAD2/EID2/ZNF703/BCL9L/TRIM33/SLC2A10/SPRED2/CDKN1C | 43 |
| GO:0000910 | cytokinesis | 54/3662 | 164/15509 | 0.00407099 | 0.0153386 | 0.00922437 | TTC19/SPAST/RHOA/ROCK1/CDC42/CHMP5/BIRC5/KIF4A/CDC6/SH3GLB1/CECR2/MYH9/CDC25B/CHMP4B/RAB11A/SEPTIN4/UNC119/STMN1/TEX14/SEPTIN6/BECN1/PIN1/CHMP1A/CDCA8/APC/KIF13A/NUSAP1/KIF23/ACTR2/ARL3/BRCA2/IGF1R/BBS4/RHOB/CALM2/PKP4/PLK2/CALM3/CXCR5/MAP9/SEPTIN2/PDCD6IP/PRKCE/BCL2L1/CFL1/CHMP6/PLEC/AURKB/SETD2/EXOC7/SEPTIN10/TMEM250/PDXP/SEPTIN9 | 54 |
| GO:1903578 | regulation of ATP metabolic process | 25/3662 | 64/15509 | 0.00413376 | 0.0155656 | 0.00936091 | SLC4A1/IGF1/SIRT6/DNM1L/P2RX7/IFNG/IL4/CBFA2T3/PRKAA1/APP/ARNT/PARP1/OGT/NDUFC2/SLC2A6/AK4/VCP/GPD1/DDIT4/PGAM1/DNAJC30/MTOR/TMSB4X/FIS1/EIF6 | 25 |
| GO:0006775 | fat-soluble vitamin metabolic process | 20/3662 | 48/15509 | 0.00419014 | 0.0157684 | 0.00948281 | NPC1L1/SNAI2/LRP2/CYP27B1/IFNG/PPARD/UBIAD1/ALDH1A2/CYP1A1/CYP3A4/GFI1/NQO1/TNF/TNF/TNF/TNF/TNF/TNF/TNF/TNF | 20 |
| GO:0023061 | signal release | 128/3662 | 440/15509 | 0.00419527 | 0.0157781 | 0.00948865 | BAD/CD38/CRY1/BTK/HFE/CASR/NNAT/KCNQ1/VPS35/STXBP2/SIRT6/OPRK1/GSK3B/OXCT1/P2RX7/RAPGEF4/SNAP29/OSM/PCK2/SFRP1/LILRB1/TFR2/DVL1/GATA3/CXCL12/PPP3CB/MAP2K6/PSMD9/ASIC1/LIN7A/IFNG/PPARD/SNX4/IL1A/PASK/PARK7/RIMS3/KDM5B/VAMP8/SPP1/CRHR1/SNX19/PDZD11/SERP1/CRY2/INHBA/NR4A1/SOX4/ABCC4/IL1B/NR1D1/PNKD/LIF/PER2/SYT11/HNF1A/GLUL/EDNRB/IL6/IL1RN/STXBP1/CCN3/CYP19A1/PREPL/SMAD4/TNFRSF11A/ENSA/SNAPIN/REN/SYT2/EPHA5/CPLX2/SLC16A2/CAMK2G/GLUD1/TCF7L2/FOXO1/GJA1/BMP6/CALM3/BRSK1/INHBB/AIMP1/SLC9B2/GDF9/ADCY1/GPER1/CDK5/SYK/TRPV6/CCDC186/PRKCE/FGG/FGA/ATP2A2/BRSK2/LEP/FZD4/CTBP2/SMAD2/PTPN11/OXTR/ADIPOQ/F2R/CACNB4/MAFA/ADRA2C/PRKN/KCNJ11/PIM3/SELENOT/TNF/TNF/TNF/TNF/TNF/TNF/TNF/TNF/RASL10B/CCL5/CCL5/LILRB1/LILRB1/MIF/TRPV6/LILRB1/LILRB1 | 128 |
| GO:0046323 | glucose import | 28/3662 | 74/15509 | 0.00424873 | 0.0159598 | 0.00959793 | IGF1/SLC2A3/SIRT6/GSK3A/RPS6KB1/MAPK14/SLC2A1/SESN2/HNF1A/PIK3R1/POU4F2/APPL1/PEA15/TERT/SLC27A4/SLC2A14/LEP/ERFE/PTPN11/ADIPOQ/TNF/TNF/TNF/TNF/TNF/TNF/TNF/TNF | 28 |
| GO:0046364 | monosaccharide biosynthetic process | 28/3662 | 74/15509 | 0.00424873 | 0.0159598 | 0.00959793 | CRY1/SIRT6/SLC25A1/PCK2/SLC39A14/GPI/ALDOC/KAT2B/LEPR/SESN2/G6PC1/PER2/OGT/SOGA1/FOXO1/RANBP2/ATF3/NNMT/GPD1/MST1/LEP/PTPN2/ERFE/ADIPOQ/SLC25A10/USP7/WDR5/GPI | 28 |
| GO:1902904 | negative regulation of supramolecular fiber organization | 48/3662 | 143/15509 | 0.00429821 | 0.0161359 | 0.00970382 | SCIN/NAV3/SPTB/ADD2/ADD1/TPX2/TJP1/MTPN/MET/CRYAB/HSPA8/PFDN1/CAPZA1/STMN1/CLU/IAPP/PFDN5/EML2/APOE/PPFIA1/APC/RDX/BBS4/TBCD/SMAD4/SLIT2/PIK3R1/GSN/PLEKHH2/DMTN/SPTBN4/SPTA1/PRKCD/S1PR1/SPTBN2/FLII/PAK2/CIB1/INPP5J/PRKN/GMFB/SPTAN1/IQANK1/PFDN6/TMSB4X/TWF2/SHANK3/TJP1 | 48 |
| GO:0001558 | regulation of cell growth | 109/3662 | 368/15509 | 0.00430331 | 0.0161452 | 0.00970946 | CD38/IFRD1/PAFAH1B1/SPAG9/IGF1/FHL1/CDH1/CYBA/NTN1/RHOA/HYAL2/RASGRP2/CDC42/DERL2/GSK3B/SLC23A2/KDM2B/DPYSL2/ABL1/ADNP/SMAD7/RBBP7/NUBP1/SFRP1/URI1/TGFB1/DDX49/HAMP/GSK3A/MTPN/BRAT1/TGFBR1/CXCL12/KAZALD1/WNT3/CRYAB/EIF4G2/CYP27B1/PPARD/HBEGF/PPP2CA/DBN1/BCL6/WNT5A/CISH/TTL/FN1/SPP1/PTK2B/CXCR4/INHBA/CDKN1A/APOE/SESN2/BTG1/PSRC1/NGF/SERPINE2/DBNL/NCBP1/CCN3/IGFBPL1/KIAA0319/PLCE1/CLSTN3/RB1/SMAD4/CRABP2/SYT2/SLIT2/EGFR/IGFBP3/EI24/POU4F2/GJA1/MMP14/ADIPOR1/DISC1/FRZB/H3-3A/BAP1/RICTOR/CDK5/FXN/GNG4/CDKN2AIP/SEMA4C/SEMA3E/LPAR3/SLC25A33/BDNF/CDH4/F2/NPM1/SLIT3/CIB1/PRKN/PRR5/TEAD1/DCC/ATAD3A/MTOR/GDI1/SIPA1/NDUFS3/TWF2/WNT3/WNT3/ITCH | 109 |
| GO:0016241 | regulation of macroautophagy | 46/3662 | 136/15509 | 0.00434582 | 0.0162949 | 0.00979945 | DCN/ATP6V0A1/CLEC16A/PHF23/TBC1D25/VPS35/PRKACA/SH3GLB1/CHMP4B/TSC2/NOD1/MAPK8/IL4/SNX4/ATP6V1A/ELAPOR1/ATP6V0B/CAPNS1/BECN1/ATG14/KDR/SESN2/ATP6V1G1/ATP6V1B2/C9orf72/SESN3/BAG3/HSPB8/UCHL1/ATP6V1C1/FYCO1/CASP3/CDK5/NOD2/ADRB2/SNX32/TMEM39A/CDK5R1/ERN1/EXOC7/CLN3/MTOR/TRIM13/IKBKG/PIP4K2B/PRKACA | 46 |
| GO:0007098 | centrosome cycle | 40/3662 | 115/15509 | 0.00435919 | 0.0163351 | 0.00982365 | SDCCAG8/NDE1/PCM1/NDC80/XPO1/CHMP5/NSFL1C/CHMP4B/PARD6A/NUBP1/CEP152/ARHGEF10/CHORDC1/KAT2B/GADD45A/SSX2IP/PKD2/UXT/CEP85/CHMP1A/ODF2/HAUS2/BRCA2/BBS4/CEP131/PLK2/BRSK1/CCNL1/MAP9/GOLGA2/PDCD6IP/CDK1/CEP135/NPM1/CEP63/HAUS3/CCNL2/NDE1/CHORDC1/SPICE1 | 40 |
| GO:0030866 | cortical actin cytoskeleton organization | 19/3662 | 45/15509 | 0.00436239 | 0.0163372 | 0.00982491 | ROCK1/LLGL2/EPB41L1/LCP1/RAB13/EPB41/CDK5/PDCD6IP/PLEC/CALR/FMNL1/TNF/TNF/TNF/TNF/TNF/TNF/TNF/TNF | 19 |
| GO:1904292 | regulation of ERAD pathway | 12/3662 | 24/15509 | 0.00436856 | 0.0163504 | 0.00983287 | HERPUD1/ATXN3/BAG6/USP14/SGTA/USP25/SVIP/BAG6/BAG6/BAG6/BAG6/BAG6 | 12 |
| GO:0000086 | G2/M transition of mitotic cell cycle | 44/3662 | 129/15509 | 0.00437436 | 0.0163623 | 0.00983998 | USH1C/FHL1/ABCB1/CDC6/CDC7/CDC25B/RBBP8/RAB11A/NBN/CCND1/FOXM1/FBXO5/CCNG1/RAD50/MASTL/CDKN1A/HSPA2/FBXL12/PKMYT1/CCNB1/NABP2/APP/ENSA/DTL/INTS3/CALM2/CCNA2/CALM3/BRSK1/MRNIP/DBF4B/WEE1/RRM1/AVEN/CDK1/PPM1D/NABP1/BRSK2/AURKB/RCC2/PLCB1/CHEK2/FOXO4/PBX1 | 44 |
| GO:0045669 | positive regulation of osteoblast differentiation | 24/3662 | 61/15509 | 0.00440192 | 0.0164554 | 0.009896 | LTF/IGF1/HGF/TP63/BMP7/BMPR1A/FBXO5/SMAD5/RUNX2/BMP2/IL6/FGF2/FBN2/CCN1/BMP6/IL6R/WNT4/CEBPB/FAM20C/CTNNBIP1/IFITM1/WNT7B/CEBPD/CEBPA | 24 |
| GO:0034109 | homotypic cell-cell adhesion | 33/3662 | 91/15509 | 0.00442003 | 0.0165032 | 0.00992474 | CD9/PKP2/PTPRU/ACTB/DSP/CDHR5/MYH9/CTSG/GATA1/PIK3CG/HSPB1/SH2B3/FN1/MPL/PDGFRA/SERPINE2/IL6/STXBP1/RDX/ADAMTS18/PRKCA/DMTN/JAK1/PRKCD/SYK/FGG/FGA/ZNF703/PPIA/HBB/ITGB3/CCL5/CCL5 | 33 |
| GO:0070167 | regulation of biomineral tissue development | 33/3662 | 91/15509 | 0.00442003 | 0.0165032 | 0.00992474 | LTF/ROCK1/ZMPSTE24/TXLNG/P2RX7/BMP7/GATA1/TGFB1/PTN/BMPR1A/CYP27B1/VDR/FBXO5/PTK2B/SRGN/BMP2/TFAP2A/FBN2/CCN1/NOTCH1/BMP6/WNT4/NOS3/SLC4A2/ADRB2/S1PR1/CEBPB/FAM20C/SLC8A1/RFLNB/NOTUM/FZD9/RXRB | 33 |
| GO:0034470 | ncRNA processing | 111/3662 | 376/15509 | 0.004472 | 0.0166872 | 0.0100354 | TSR3/UTP18/SARS1/ZCCHC8/TRIT1/PUM2/KARS1/RRP15/ELP1/BUD23/DDX1/TUT7/ZMPSTE24/RTRAF/DDX18/XRN2/AARS1/ESR1/AGO1/PES1/SNU13/ZC3H7B/NOP56/RIOK3/PIN4/POP1/ERCC2/FBL/TGFB1/DDX49/EXOSC3/TRDMT1/INTS2/DDX5/PUS3/NOP2/BRIX1/KAT2B/RRP9/EBNA1BP2/NSUN4/UTP20/ZC3H7A/RNF113A/SBDS/DKC1/NOL11/GRSF1/UTP3/MYCN/ELP2/MRPL44/IL6/NCBP1/ALKBH8/THUMPD2/INTS14/TARBP2/PELP1/EIF4A3/METTL25B/INTS3/ABT1/RPL7L1/EGFR/TRPT1/DHX37/TSR2/RPL26/POLR3K/NOL9/PUS10/NSA2/TERT/INTS1/DCAF13/RPUSD4/TRUB1/URM1/MRPL1/DTWD2/ELP5/PA2G4/EXOSC10/CLP1/TRMT112/LARP7/SMAD2/PUS1/IMP3/WDR6/NOP10/RPS17/TRMT2B/RRP7A/RPL10A/SPOUT1/TNF/TNF/QTRT1/TNF/TNF/TNF/TNF/TNF/TNF/PWP2/EIF6/PRKDC/BOP1/EMG1 | 111 |
| GO:0043620 | regulation of DNA-templated transcription in response to stress | 18/3662 | 42/15509 | 0.00451545 | 0.016819 | 0.0101146 | MBTPS2/HSPA5/SIRT2/EPAS1/EGR1/CHD6/TMBIM6/ARNT/BAG3/ATF3/HIF1AN/RBPJ/RGS14/CEBPB/RELA/DDIT3/JUN/MUC1 | 18 |
| GO:0060443 | mammary gland morphogenesis | 18/3662 | 42/15509 | 0.00451545 | 0.016819 | 0.0101146 | NTN1/FGFR2/PGR/BAX/ESR1/AREG/VDR/WNT5A/KDM5B/ARG1/EPHA2/WNT4/TGFBR2/BTRC/CCL11/CSF1R/CSF1/SRC | 18 |
| GO:2000249 | regulation of actin cytoskeleton reorganization | 18/3662 | 42/15509 | 0.00451545 | 0.016819 | 0.0101146 | CDC42/ABL1/HCK/TJP1/CSF3/MDK/TEK/PTK2B/NOTCH2/PDGFRA/ARHGDIA/ABL2/IQGAP2/CDK5/SEMA3E/HRAS/CSF1R/TJP1 | 18 |
| GO:0009150 | purine ribonucleotide metabolic process | 117/3662 | 399/15509 | 0.00455395 | 0.0169522 | 0.0101947 | BAD/AK2/SLC4A1/AASS/IGF1/PDE4A/PKM/RHOA/PDK3/SIRT6/DNM1L/P2RX7/DLD/ACOT7/TECR/SLC25A1/MTHFD1/GMPR2/PRPS2/GPI/TGFB1/GCDH/AK1/ENO3/ALDOC/NDUFC1/HSPA8/MVK/IFNG/PDE8B/PDE4D/IL4/ATP6V1A/ABHD14B/AMPD2/ATP5PB/NT5C1A/NDUFA8/GPAM/ACSL3/MCEE/ITPA/PAICS/PPAT/CBFA2T3/ACLY/PRKAA1/HSD17B4/NT5E/OLA1/NUDT7/APP/EPHA2/ADCY10/ARNT/PKLR/GUK1/PARP1/NDUFS6/OGT/ATP6V1B2/NDUFB9/AK3/DLAT/OXSM/NDUFC2/AK5/ATP5MC3/ACSS1/SLC26A2/NDUFS2/GART/PDE9A/NDUFV3/SLC2A6/AK4/ELOVL7/ACSL6/ADCY1/VCP/NUDT5/LDHC/ATP5MG/GPD1/NDUFV1/DDIT4/NDUFS5/ATP5ME/HINT1/TPST1/PGAM1/PDE7B/SUCLG2/ATP5MK/DNAJC30/CACNB4/PDE4B/ADSS1/ENTPD4/ENTPD7/ND6/MTOR/PNP/TMSB4X/ND4L/NDUFS3/NUDT19/FIS1/NME1/ADSL/ATP5MF/EIF6/PKLR/NUDT3/GPI/GMPR2/LDHA | 117 |
| GO:1902807 | negative regulation of cell cycle G1/S phase transition | 27/3662 | 71/15509 | 0.00455978 | 0.0169637 | 0.0102017 | FHL1/CASP2/EZH2/CCL2/CCND1/PKD2/INHBA/CDKN1A/MEN1/APC/RB1/CTDSP1/PLK2/PRMT2/RPL26/BRD7/WEE1/RFWD3/TRIAP1/CTDSP2/CACNB4/CHEK2/MUC1/KANK2/GIGYF2/PRKDC/PTEN | 27 |
| GO:0002360 | T cell lineage commitment | 13/3662 | 27/15509 | 0.00460434 | 0.0170987 | 0.0102829 | FOXP3/RHOA/TBX21/IL12RB1/IL7/IL12B/IL6/IRF4/IL6R/SHH/RAG2/MTOR/PRKDC | 13 |
| GO:0090322 | regulation of superoxide metabolic process | 13/3662 | 27/15509 | 0.00460434 | 0.0170987 | 0.0102829 | TYROBP/CYBA/BMP7/ACP5/TGFB1/CD36/SOD1/ITGB2/PRKCD/SYK/ITGAM/CD177/AATF | 13 |
| GO:1900101 | regulation of endoplasmic reticulum unfolded protein response | 13/3662 | 27/15509 | 0.00460434 | 0.0170987 | 0.0102829 | UFL1/BAK1/HSPA5/PPP1R15A/BAX/XBP1/BFAR/TMEM33/PIK3R1/BCL2L11/PPP1R15B/PTPN2/ERN1 | 13 |
| GO:0030835 | negative regulation of actin filament depolymerization | 17/3662 | 39/15509 | 0.00464073 | 0.0172132 | 0.0103517 | SCIN/SPTB/ADD2/ADD1/MTPN/CAPZA1/RDX/GSN/PLEKHH2/DMTN/SPTBN4/SPTA1/SPTBN2/FLII/SPTAN1/IQANK1/TWF2 | 17 |
| GO:0071763 | nuclear membrane organization | 17/3662 | 39/15509 | 0.00464073 | 0.0172132 | 0.0103517 | PAFAH1B1/SPAST/SIRT2/CHMP5/NSFL1C/CHMP4B/UBE2I/TARDBP/CHMP1A/TOR1AIP1/PRKCA/GPER1/REEP3/NEMP1/BANF1/CHMP6/ANKLE2 | 17 |
| GO:0050821 | protein stabilization | 59/3662 | 183/15509 | 0.00466944 | 0.0173093 | 0.0104095 | RPAP3/TYROBP/IGF1/GRN/PER3/SEL1L/BAG6/HSP90AB1/POLR2E/RASSF2/SMAD7/URI1/BAG1/DVL1/CRYAB/PFDN1/PDCL3/PARK7/P3H1/CLU/PFDN5/USP9X/SOX4/UXT/PIN1/FLOT2/CCNH/CCT7/STXBP1/ANK2/PIK3R1/BAG3/GNAQ/DVL3/PEX19/PRKCD/NAA15/CCT2/TRIM44/TNIP2/EFNA1/AHSP/OTUD3/HCFC1/CALR/NPM1/CHEK2/PRKN/USP7/PARVA/GLMP/PFDN6/BAG6/ZSWIM7/BAG6/BAG6/BAG6/BAG6/PTEN | 59 |
| GO:0046686 | response to cadmium ion | 23/3662 | 58/15509 | 0.00467855 | 0.0173327 | 0.0104236 | MMP9/GPI/MAPK8/ARG1/CAT/CYP1A2/SOD1/EGFR/ALAD/KIT/TERT/CYBB/CDK1/FOS/JUN/AKR1C3/DAXX/DAXX/CHUK/DAXX/DAXX/DAXX/GPI | 23 |
| GO:0002446 | neutrophil mediated immunity | 16/3662 | 36/15509 | 0.00472739 | 0.0174415 | 0.010489 | KMT2E/SPI1/WDR1/STXBP2/CTSG/ARG1/IL6/ITGB2/SYK/PTAFR/ITGAM/F2/CARD9/ELANE/CD177/ELANE | 16 |
| GO:0009954 | proximal/distal pattern formation | 16/3662 | 36/15509 | 0.00472739 | 0.0174415 | 0.010489 | HOXA11/TP63/GLI2/HOXA9/HOXD9/ALDH1A2/LRP4/NODAL/PBX1/PBX2/PBX2/PBX2/PBX2/PBX2/PBX2/HOXA10 | 16 |
| GO:0014911 | positive regulation of smooth muscle cell migration | 16/3662 | 36/15509 | 0.00472739 | 0.0174415 | 0.010489 | IGF1/PDGFB/RPS6KB1/MDK/PDGFRB/NR4A3/TLR4/CYP1B1/ADAMTS1/S100A11/TERT/FOXO4/SRC/ITGB3/CCL5/CCL5 | 16 |
| GO:0048009 | insulin-like growth factor receptor signaling pathway | 16/3662 | 36/15509 | 0.00472739 | 0.0174415 | 0.010489 | IGF1/CDH3/TSC2/IGFBP2/BMP2/IGF1R/PIK3R1/IGFBP3/CRIM1/ZFAND2B/EIF2AK3/PLCB1/IGF2R/GIGYF2/GH1/CRIM1 | 16 |
| GO:0033260 | nuclear DNA replication | 14/3662 | 30/15509 | 0.0047276 | 0.0174415 | 0.010489 | UPF1/DBF4/RAD51/ZMPSTE24/ATRX/CDC7/GINS1/POLA1/LIG1/AICDA/BCL6/BRCA2/DBF4B/RTEL1 | 14 |
| GO:0045736 | negative regulation of cyclin-dependent protein serine/threonine kinase activity | 14/3662 | 30/15509 | 0.0047276 | 0.0174415 | 0.010489 | IPO5/KAT2B/TNFAIP3/CDKN1A/CDKN1C/MEN1/APC/HHEX/CASP3/HEXIM1/IPO7/CEBPA/CDKN1C/PTEN | 14 |
| GO:1904030 | negative regulation of cyclin-dependent protein kinase activity | 14/3662 | 30/15509 | 0.0047276 | 0.0174415 | 0.010489 | IPO5/KAT2B/TNFAIP3/CDKN1A/CDKN1C/MEN1/APC/HHEX/CASP3/HEXIM1/IPO7/CEBPA/CDKN1C/PTEN | 14 |
| GO:0098754 | detoxification | 43/3662 | 126/15509 | 0.00475122 | 0.0175182 | 0.0105351 | MPO/ABCB1/PTGS1/BMP7/GSR/PARK7/PRDX1/PRDX6/MTARC2/ABCG2/UBIAD1/CAT/APOE/PXDN/SESN2/GSTM1/CD36/SOD1/SLC47A1/GSTO1/FANCC/FABP1/ALB/NOS3/TP53INP1/GPX4/NXN/PRDX2/PDZK1/NQO1/SLC22A5/TXNRD1/SELENOT/GPX3/LTC4S/HBE1/HBD/HBB/HP/SRXN1/TPO/GSTT1/LTC4S | 43 |
| GO:0002431 | Fc receptor mediated stimulatory signaling pathway | 15/3662 | 33/15509 | 0.0047619 | 0.0175367 | 0.0105463 | FCGR2B/PTPRC/ABL1/HCK/CSK/NR4A3/APPL1/PRKCD/SYK/PTK2/PRKCE/PLSCR1/CD47/SRC/PTPRC | 15 |
| GO:0008210 | estrogen metabolic process | 15/3662 | 33/15509 | 0.0047619 | 0.0175367 | 0.0105463 | CYP2D6/CYP3A5/CHST10/HSD17B4/PDGFRA/CYP19A1/CYP1B1/CYP1A1/CYP1A2/CYP3A4/CYP2D6/CYP2D6/CYP2D6/CYP2D6/CYP2D6 | 15 |
| GO:0009199 | ribonucleoside triphosphate metabolic process | 68/3662 | 216/15509 | 0.00479382 | 0.0176437 | 0.0106106 | BAD/AK2/SLC4A1/IGF1/PKM/RHOA/SIRT6/DNM1L/P2RX7/GPI/TGFB1/AK1/ENO3/ALDOC/NDUFC1/HSPA8/IFNG/IL4/ATP6V1A/ATP5PB/NDUFA8/ITPA/CBFA2T3/PRKAA1/NT5E/OLA1/APP/ARNT/PKLR/PARP1/NDUFS6/OGT/ATP6V1B2/NDUFB9/AK3/NDUFC2/AK5/ATP5MC3/NDUFS2/NDUFV3/SLC2A6/AK4/VCP/NUDT5/LDHC/ATP5MG/GPD1/NDUFV1/DDIT4/NDUFS5/ATP5ME/PGAM1/ATP5MK/DNAJC30/ENTPD4/ENTPD7/ND6/MTOR/TMSB4X/ND4L/NDUFS3/FIS1/NME1/ATP5MF/EIF6/PKLR/GPI/LDHA | 68 |
| GO:0009060 | aerobic respiration | 57/3662 | 176/15509 | 0.00481516 | 0.0177118 | 0.0106516 | CS/RHOA/DLD/MSH2/ACO2/IDH3B/SLC25A14/PPIF/NDUFC1/NNT/PARK7/ATP5PB/NDUFA8/CAT/SLC25A51/SLC25A23/CBFA2T3/COX7B/CCNB1/ISCU/IREB2/NDUFS6/NDUFB9/DLAT/NDUFC2/NDUFS2/NDUFV3/AK4/FXN/VCP/IDH3A/ATP5MG/NDUFV1/NDUFS5/ATP5ME/CDK1/SLC25A33/SUCLG2/PDE12/DNAJC30/COX5A/IDH2/ND6/CYTB/COX3/TNF/TNF/ND4L/NDUFS3/TNF/TNF/TNF/TNF/TNF/TNF/ADSL/ATP5MF | 57 |
| GO:0051781 | positive regulation of cell division | 29/3662 | 78/15509 | 0.00490098 | 0.0179954 | 0.0108221 | SPAST/FGFR2/RHOA/SIRT2/CDC42/BIRC5/CDC6/OSM/PDGFB/CDC25B/TGFB1/PTN/MDK/IL1A/PGF/CAT/IL1B/CDCA8/KIF23/FGF2/IGF1R/PKP4/PDGFC/VEGFC/CXCR5/TAL1/SHH/PRKCE/AURKB | 29 |
| GO:0072091 | regulation of stem cell proliferation | 29/3662 | 78/15509 | 0.00490098 | 0.0179954 | 0.0108221 | KDM1A/SNAI2/EIF2AK2/TP63/SIRT6/FBLN1/PTPRC/FERMT1/CCNE1/WNT5A/PRRX1/IRF6/RUNX2/KDR/FGF2/NOTCH1/HMGA2/VEGFC/GJA1/TGFBR2/TERT/SHH/RBPJ/RARG/PBX1/ZFP36L1/NF2/CEBPA/PTPRC | 29 |
| GO:1902099 | regulation of metaphase/anaphase transition of cell cycle | 29/3662 | 78/15509 | 0.00490098 | 0.0179954 | 0.0108221 | CDC27/ARID1B/ACTB/NDC80/ZW10/ANAPC5/BIRC5/CDC6/BCL7C/SMARCB1/SMARCD2/BCL7A/FBXO5/CDC20/ARID1A/TEX14/CCNB1/CDCA8/APC/CENPE/RB1/SPC25/BRD7/BUB1/ZWILCH/AURKB/MAPK15/ARID2/SMARCB1 | 29 |
| GO:0030510 | regulation of BMP signaling pathway | 34/3662 | 95/15509 | 0.00494811 | 0.0180361 | 0.0108466 | ITGA3/HIPK2/LRP2/ABL1/SMAD7/SFRP1/SFRP4/ENG/DKK1/WNT5A/HES1/SFRP5/KDR/TWSG1/NOTCH2/NUMA1/SORL1/SMAD6/TOB1/RNF165/SMAD4/CCN1/NOTCH1/CRIM1/SKI/ELAPOR2/HTRA1/RBPJ/SMAD2/RGMA/NOG/TMPRSS6/TRIM33/CRIM1 | 34 |
| GO:0033138 | positive regulation of peptidyl-serine phosphorylation | 34/3662 | 95/15509 | 0.00494811 | 0.0180361 | 0.0108466 | CD44/FNIP2/ATP2B4/HSP90AB1/OSM/TCL1A/AXIN1/PRKD2/TGFB1/GSK3A/CSF3/IFNG/WNT5A/PARK7/LIF/NGF/SPRY2/IL6/ARRB2/APP/CNOT9/EGFR/NTRK2/BDNF/IFNA1/TNF/TNF/TNF/TNF/TNF/TNF/TNF/TNF/MIF | 34 |
| GO:1901796 | regulation of signal transduction by p53 class mediator | 34/3662 | 95/15509 | 0.00494811 | 0.0180361 | 0.0108466 | KDM1A/SNAI2/CD74/CD44/HIPK2/ZMPSTE24/MAPKAPK5/YJU2/ZNHIT1/DDX5/MAP2K6/NOP2/TRIM24/SOX4/EEF1E1/DYRK2/PMAIP1/DYRK3/ZNF385A/RPL26/TRIAP1/AURKB/NPM1/PTTG1IP/CHEK2/KMT5A/PRKN/MUC1/HEXIM1/USP7/SPRED2/MTOR/BOP1/MIF | 34 |
| GO:0034249 | negative regulation of cellular amide metabolic process | 55/3662 | 169/15509 | 0.0049562 | 0.0180361 | 0.0108466 | UPF1/IGF1/EIF2AK2/ROCK1/MLH1/TUT7/AGO1/CIRBP/GZMB/PCIF1/EXOSC3/DDX6/XRN1/NCL/PAIP2/CLU/TARDBP/ORMDL2/CNOT1/PIN1/ZFP36/APOE/SESN2/RARA/PRKAA1/RTN3/EIF4E2/IREB2/SORL1/RTN1/TOB1/EIF4A3/GRB7/POLR2D/CNOT9/NTRK2/EIF4EBP2/ZFP36L2/CNOT11/BTG2/ENC1/ORMDL3/EIF2AK3/PAIP1/DCP2/PDE12/TYMS/SHMT1/CALR/ZFP36L1/YTHDF3/DAPK1/GIGYF2/EIF6/LSM14A | 55 |
| GO:0050954 | sensory perception of mechanical stimulus | 55/3662 | 169/15509 | 0.0049562 | 0.0180361 | 0.0108466 | USH1C/SNAI2/HEXB/KCNQ1/WDR1/LRP2/ATP8B1/BIRC5/TIMM13/TIMM9/AXIN1/EYA1/MYH14/GSDME/CXCL12/CDH23/EYA4/SOBP/CXCR4/TMTC4/EML2/PAX3/SERPINE2/SPRY2/TFAP2A/COL2A1/SOD1/ESPNL/LRIG1/NDUFB9/TIMM8B/THRB/POU4F2/CCDC50/KIT/SPTBN4/CASP3/FZD4/DDIT3/ROR1/P2RX2/TRPV1/PGAP1/LHFPL5/MBP/NTRK1/COL11A2/TNF/TNF/TNF/TNF/TNF/TNF/TNF/TNF | 55 |
| GO:0001767 | establishment of lymphocyte polarity | 9/3662 | 16/15509 | 0.00496144 | 0.0180361 | 0.0108466 | ABL1/MYH9/CCR7/FLOT2/CCL21/ABL2/SNX27/GSN/CCL19 | 9 |
| GO:0010801 | negative regulation of peptidyl-threonine phosphorylation | 9/3662 | 16/15509 | 0.00496144 | 0.0180361 | 0.0108466 | SIRT2/SMAD7/SPRY2/CALM2/PARD3/DMTN/CALM3/DDIT4/SPRED2 | 9 |
| GO:0030220 | platelet formation | 9/3662 | 16/15509 | 0.00496144 | 0.0180361 | 0.0108466 | WDR1/MYH9/GATA1/MPL/ZNF385A/CASP3/PTPN11/CIB1/PRKDC | 9 |
| GO:0042976 | activation of Janus kinase activity | 9/3662 | 16/15509 | 0.00496144 | 0.0180361 | 0.0108466 | PIBF1/IL12B/IL4/PTK2B/IL6R/SOCS1/GH1/CCL5/CCL5 | 9 |
| GO:0046827 | positive regulation of protein export from nucleus | 9/3662 | 16/15509 | 0.00496144 | 0.0180361 | 0.0108466 | PRKACA/SIRT6/GSK3B/IL1B/XPO4/ANP32B/TCF7L2/BAG3/PRKACA | 9 |
| GO:0070230 | positive regulation of lymphocyte apoptotic process | 9/3662 | 16/15509 | 0.00496144 | 0.0180361 | 0.0108466 | BAX/P2RX7/WNT5A/IL10/BCL2L11/LGALS9/PRELID1/CCL5/CCL5 | 9 |
| GO:0070734 | histone H3-K27 methylation | 9/3662 | 16/15509 | 0.00496144 | 0.0180361 | 0.0108466 | EZH2/GATA3/EZH1/MACROH2A1/PHF19/H1-3/OGT/H1-4/H1-2 | 9 |
| GO:1902236 | negative regulation of endoplasmic reticulum stress-induced intrinsic apoptotic signaling pathway | 9/3662 | 16/15509 | 0.00496144 | 0.0180361 | 0.0108466 | HERPUD1/XBP1/CREB3/PARK7/TMBIM6/BCL2L1/GRINA/PRKN/MAGEA3 | 9 |
| GO:0032608 | interferon-beta production | 22/3662 | 55/15509 | 0.00496152 | 0.0180361 | 0.0108466 | MAVS/RIOK3/TLR8/PYCARD/LILRB1/IRF3/IRF5/TRAF3/POLR3F/TLR4/PPM1B/NLRX1/TLR3/POLR3D/TRIM56/PTPN11/TRAIP/TLR7/LILRB1/LILRB1/LILRB1/LILRB1 | 22 |
| GO:0032648 | regulation of interferon-beta production | 22/3662 | 55/15509 | 0.00496152 | 0.0180361 | 0.0108466 | MAVS/RIOK3/TLR8/PYCARD/LILRB1/IRF3/IRF5/TRAF3/POLR3F/TLR4/PPM1B/NLRX1/TLR3/POLR3D/TRIM56/PTPN11/TRAIP/TLR7/LILRB1/LILRB1/LILRB1/LILRB1 | 22 |
| GO:0048857 | neural nucleus development | 22/3662 | 55/15509 | 0.00496152 | 0.0180361 | 0.0108466 | HSPA5/RHOA/SIRT2/CDC42/ACTB/GNB4/ATP5PB/PADI2/SYNGR3/YWHAH/NKX2-1/FGF2/SYPL2/CALM2/GLUD1/CALM3/NDRG2/CNP/HOXB2/CDK5R1/MBP/NDUFS3 | 22 |
| GO:0050918 | positive chemotaxis | 22/3662 | 55/15509 | 0.00496152 | 0.0180361 | 0.0108466 | HGF/CASR/F7/ANGPT2/PDGFB/TSC2/MET/CXCL12/WNT5A/PGF/KDR/FGF2/VEGFC/CXCL8/S1PR1/SCG2/IL16/CCR4/HMGB1/CCL5/CCL5/MIF | 22 |
| GO:0032271 | regulation of protein polymerization | 58/3662 | 180/15509 | 0.00506764 | 0.018411 | 0.0110721 | SCIN/CYFIP2/RHOA/NAV3/SPTB/ADD2/ADD1/ABL1/HCK/COTL1/PYCARD/MTPN/MET/CSF3/RANGRF/ARPC3/DBN1/CAPZA1/STMN1/PTK2B/EML2/CCR7/CDC42EP1/ARPC1B/PSRC1/DBNL/CCL21/NUMA1/RDX/SLAIN1/BBS4/TBCD/SLIT2/ARHGAP18/GSN/CDC42EP2/DMTN/SPTBN4/ALOX15/ARPC5/CDC42EP3/SPTA1/PRKCD/RICTOR/PRKCE/CCL11/SPTBN2/CDK5R1/FLII/GRB2/INPP5J/DRG1/SPTAN1/MTOR/IQANK1/TMSB4X/ARPC1A/TWF2 | 58 |
| GO:0006119 | oxidative phosphorylation | 44/3662 | 130/15509 | 0.00512918 | 0.0186237 | 0.0112 | RHOA/DLD/MSH2/PPIF/NDUFC1/PARK7/ATP5PB/NDUFA8/SLC25A51/SLC25A23/COX7B/CCNB1/ISCU/NDUFS6/NDUFB9/NDUFC2/NDUFS2/NDUFV3/AK4/FXN/VCP/ATP5MG/NDUFV1/NDUFS5/ATP5ME/CDK1/SLC25A33/PDE12/DNAJC30/COX5A/ND6/CYTB/COX3/TNF/TNF/ND4L/NDUFS3/TNF/TNF/TNF/TNF/TNF/TNF/ATP5MF | 44 |
| GO:0003208 | cardiac ventricle morphogenesis | 25/3662 | 65/15509 | 0.00523646 | 0.018991 | 0.0114208 | PKP2/FGFR2/LRP2/FKBP1A/DSP/SMAD7/TGFB1/GSK3A/TGFBR1/ENG/GATA3/BMPR1A/TNNT2/SOX4/TNNI3/SMAD4/NOTCH1/POU4F1/TNNI1/TGFBR2/HEYL/RBPJ/ZFPM2/NKX2-5/NOG | 25 |
| GO:0030865 | cortical cytoskeleton organization | 25/3662 | 65/15509 | 0.00523646 | 0.018991 | 0.0114208 | PAFAH1B1/RHOA/ROCK1/WDR1/LLGL2/EPB41L1/RAC2/LCP1/RAB13/RHOB/EPB41/CDK5/RHOH/PDCD6IP/PLEC/CALR/FMNL1/TNF/TNF/TNF/TNF/TNF/TNF/TNF/TNF | 25 |
| GO:0070169 | positive regulation of biomineral tissue development | 21/3662 | 52/15509 | 0.00524784 | 0.0190211 | 0.011439 | LTF/P2RX7/BMP7/TGFB1/PTN/BMPR1A/VDR/FBXO5/BMP2/TFAP2A/FBN2/CCN1/BMP6/WNT4/SLC4A2/ADRB2/CEBPB/FAM20C/SLC8A1/FZD9/RXRB | 21 |
| GO:1902475 | L-alpha-amino acid transmembrane transport | 28/3662 | 75/15509 | 0.0052792 | 0.0191236 | 0.0115006 | SLC11A1/SLC7A8/SLC25A15/SLC38A7/SLC7A6/SLC1A5/ARG1/PER2/SLC15A4/SLC7A1/SLC47A1/ARL6IP5/ITGB1/SLC38A10/SLC43A2/SLC3A2/SLC38A9/KCNJ10/CLN3/SLC25A29/TNF/TNF/TNF/TNF/TNF/TNF/TNF/TNF | 28 |
| GO:0001553 | luteinization | 7/3662 | 11/15509 | 0.00537035 | 0.0193745 | 0.0116515 | MMP2/INHBA/PDGFRA/GDF9/STAT5B/FZD4/A2M | 7 |
| GO:0009133 | nucleoside diphosphate biosynthetic process | 7/3662 | 11/15509 | 0.00537035 | 0.0193745 | 0.0116515 | AK2/AK1/GUK1/AK3/AK5/CMPK1/AK4 | 7 |
| GO:0033262 | regulation of nuclear cell cycle DNA replication | 7/3662 | 11/15509 | 0.00537035 | 0.0193745 | 0.0116515 | DBF4/ZMPSTE24/ATRX/CDC7/AICDA/BCL6/DBF4B | 7 |
| GO:0035747 | natural killer cell chemotaxis | 7/3662 | 11/15509 | 0.00537035 | 0.0193745 | 0.0116515 | PIK3CG/CCL2/CCL5/CCL5/CCL4/CCL4/CCL4 | 7 |
| GO:0045815 | epigenetic maintenance of chromatin in transcription-competent conformation | 7/3662 | 11/15509 | 0.00537035 | 0.0193745 | 0.0116515 | ARID1B/MACROH2A1/KAT2B/PADI2/ARID1A/WBP2/PHF2 | 7 |
| GO:1902969 | mitotic DNA replication | 7/3662 | 11/15509 | 0.00537035 | 0.0193745 | 0.0116515 | RAD51/ZMPSTE24/GINS1/POLA1/LIG1/BCL6/BRCA2 | 7 |
| GO:1903826 | L-arginine transmembrane transport | 7/3662 | 11/15509 | 0.00537035 | 0.0193745 | 0.0116515 | SLC11A1/SLC25A15/SLC7A1/SLC47A1/SLC38A9/CLN3/SLC25A29 | 7 |
| GO:0051047 | positive regulation of secretion | 82/3662 | 269/15509 | 0.0054977 | 0.0198224 | 0.0119209 | BAD/CD38/SCIN/HFE/IGF1/GAB2/CASR/CYBA/NNAT/VPS35/IL4R/SIRT6/OPRK1/OXCT1/ACHE/DNM1L/P2RX7/XBP1/PCK2/GATA1/PARD6A/KCNN4/TGFB1/CD33/TFR2/CXCL12/PPP3CB/MAP2K6/PSMD9/IFNG/PPARD/APBB3/IL4/SNX4/IL1A/SDC1/VAMP8/SPP1/SERP1/INHBA/ACSL3/SOX4/IL1B/BMP2/GLUL/EDNRB/STXBP1/TLR4/CYP19A1/SMAD4/TNFRSF11A/GLUD1/TCF7L2/VEGFC/BMP6/ITGB2/INHBB/AIMP1/GPER1/CDK5/SYK/ADAM9/PTAFR/ITGAM/PDCD6IP/PRKCE/FGG/FGA/LEP/PTPN11/OXTR/CACNB4/ANXA2/HGS/ZP3/PPIA/CACNA1H/TRPV1/SELENOT/CD177/RASL10B/MIF | 82 |
| GO:0008584 | male gonad development | 45/3662 | 134/15509 | 0.0055131 | 0.0198664 | 0.0119473 | HOXA11/ARID4B/HOXA9/LRP2/ATRX/BAX/ESR1/MSH2/GATA1/SFRP1/TGFBR1/GATA3/CCND1/PDGFRB/WNT5A/IL1A/SDC1/TNFSF10/INHBA/MEA1/EIF2S2/SOX15/BCL2L2/RARA/HSD17B4/PDGFRA/NKX2-1/CYP1B1/SMAD4/RAB13/REN/ARID5B/DHX37/BCL2L11/MMP14/KIT/WNT4/H3-3A/INHBB/TLR3/ZFPM2/BCL2L1/AKR1C3/NTRK1/HOXA10 | 45 |
| GO:0051055 | negative regulation of lipid biosynthetic process | 20/3662 | 49/15509 | 0.00553345 | 0.019905 | 0.0119705 | SNAI2/ACADVL/PIBF1/PDGFB/CYP27B1/PDE8B/ORMDL2/BMP2/APOE/PRKAA1/ASXL3/SOD1/ERLIN2/WNT4/GFI1/ATP1A1/GPER1/ORMDL3/KLHL25/AKR1C3 | 20 |
| GO:0071622 | regulation of granulocyte chemotaxis | 20/3662 | 49/15509 | 0.00553345 | 0.019905 | 0.0119705 | CD74/DNM1L/C1QBP/MDK/IL4/CCR7/RAC2/CCL21/THBS1/SLIT2/NOD2/PTK2/CXCL8/CCL19/CXCR2/CSF1R/CSF1/DPP4/CCL5/CCL5 | 20 |
| GO:0072599 | establishment of protein localization to endoplasmic reticulum | 20/3662 | 49/15509 | 0.00553345 | 0.019905 | 0.0119705 | HSPA5/HERPUD1/SEC61A1/SEC61A2/RAB10/BAG6/CHMP4B/UBL4A/SGTA/MAN1A1/SPCS1/SRP14/SRPRB/ZFAND2B/SRP68/BAG6/BAG6/BAG6/BAG6/BAG6 | 20 |
| GO:0045069 | regulation of viral genome replication | 30/3662 | 82/15509 | 0.00558054 | 0.0200628 | 0.0120654 | LTF/EIF2AK2/MAVS/N4BP1/AICDA/NR5A2/STAU1/TOP2A/SRPK2/TARBP2/NOTCH1/HMGA2/CXCL8/PDE12/BANF1/TMEM39A/CD28/IFITM1/PLSCR1/PPIA/TNF/TNF/TNF/TNF/TNF/TNF/TNF/TNF/CCL5/CCL5 | 30 |
| GO:0051881 | regulation of mitochondrial membrane potential | 24/3662 | 62/15509 | 0.00560163 | 0.0201152 | 0.0120969 | BAD/DCN/BAK1/BAX/P2RX7/ABL1/TCL1A/SLC25A36/PARK7/KDR/RNF122/PMAIP1/SOD1/PARP1/ARL6IP5/NDUFC2/VCP/PRELID1/BCL2L1/SLC25A33/PRKN/FZD9/TRPV1/SRC | 24 |
| GO:0060415 | muscle tissue morphogenesis | 24/3662 | 62/15509 | 0.00560163 | 0.0201152 | 0.0120969 | PKP2/MYLK/FGFR2/LRP2/FKBP1A/DSP/SMAD7/TGFB1/TGFBR1/ENG/BMPR1A/WNT5A/TNNT2/BMP2/TNNI3/SMAD4/NOTCH1/POU4F1/TNNI1/RBPJ/ZFPM2/S1PR1/NKX2-5/NOG | 24 |
| GO:0031507 | heterochromatin formation | 27/3662 | 72/15509 | 0.00568333 | 0.0203968 | 0.0122663 | KDM1A/SIRT2/MBD3/SIRT6/AXIN1/DOT1L/EZH2/EZH1/AICDA/FAM172A/HDAC1/DNMT3A/HELLS/DNMT1/PPHLN1/TET1/RB1/HMGA2/SMARCA5/CTBP1/LMNA/H3-3A/PPM1D/H1-0/HMGB1/PHF2/L3MBTL3 | 27 |
| GO:1903532 | positive regulation of secretion by cell | 76/3662 | 247/15509 | 0.00568891 | 0.020405 | 0.0122712 | BAD/CD38/HFE/IGF1/GAB2/CASR/NNAT/VPS35/IL4R/SIRT6/OPRK1/OXCT1/ACHE/DNM1L/P2RX7/PCK2/GATA1/PARD6A/KCNN4/TGFB1/CD33/TFR2/CXCL12/PPP3CB/MAP2K6/PSMD9/IFNG/PPARD/APBB3/IL4/SNX4/IL1A/SDC1/VAMP8/SPP1/SERP1/INHBA/SOX4/IL1B/BMP2/GLUL/STXBP1/TLR4/CYP19A1/SMAD4/TNFRSF11A/GLUD1/TCF7L2/VEGFC/BMP6/ITGB2/INHBB/AIMP1/GPER1/CDK5/SYK/ADAM9/PTAFR/ITGAM/PDCD6IP/PRKCE/FGG/FGA/LEP/PTPN11/OXTR/CACNB4/ANXA2/HGS/ZP3/PPIA/CACNA1H/SELENOT/CD177/RASL10B/MIF | 76 |
| GO:0035902 | response to immobilization stress | 10/3662 | 19/15509 | 0.00576644 | 0.0206353 | 0.0124097 | GPI/FOXO3/PTK2B/ACTR2/CYP1A1/REN/FOS/SLC8A1/FOXO4/GPI | 10 |
| GO:0048245 | eosinophil chemotaxis | 10/3662 | 19/15509 | 0.00576644 | 0.0206353 | 0.0124097 | CCL2/IL4/CCL21/SCG2/CCL11/CCL5/CCL5/CCL4/CCL4/CCL4 | 10 |
| GO:0072111 | cell proliferation involved in kidney development | 10/3662 | 19/15509 | 0.00576644 | 0.0206353 | 0.0124097 | PDGFB/BMP7/GATA3/PDGFRB/STAT1/EGR1/BMP2/IL6R/SHH/ITGB3 | 10 |
| GO:0140747 | regulation of ncRNA transcription | 10/3662 | 19/15509 | 0.00576644 | 0.0206353 | 0.0124097 | ATRX/SMARCB1/MACROH2A1/NCL/ZC3H4/NOL11/CC2D1A/LARP7/MTOR/SMARCB1 | 10 |
| GO:1901988 | negative regulation of cell cycle phase transition | 70/3662 | 225/15509 | 0.00581745 | 0.0208058 | 0.0125123 | CRY1/FHL1/USP28/RAD51/NDC80/ZW10/BIRC5/CDC6/MSH2/RBBP8/NBN/DOT1L/CASP2/EZH2/CCL2/CCND1/FBXO5/MAPK14/CCNG1/RAD50/MACROH2A1/CDC20/PKD2/TEX14/INHBA/CDKN1A/MEN1/CCNB1/CDCA8/APC/NABP2/BRCA2/RB1/CUL4A/DTL/INTS3/CTDSP1/PLK2/SPC25/ZFP36L2/XPC/EME1/PRMT2/BRSK1/MRNIP/RPL26/BRD7/WEE1/RFWD3/BUB1/AVEN/CDK1/TRIAP1/RHNO1/NABP1/ZWILCH/CTDSP2/AURKB/PTPN11/CACNB4/CEP63/CHEK2/FOXO4/MUC1/ZFP36L1/H2AX/KANK2/GIGYF2/PRKDC/PTEN | 70 |
| GO:0031396 | regulation of protein ubiquitination | 61/3662 | 192/15509 | 0.00583357 | 0.0208515 | 0.0125397 | KDM1A/CRY1/UFL1/BIRC3/PHF23/HSPA5/HERPUD1/FKBP1A/HSP90AB1/ABL1/BIRC7/SMAD7/NDFIP2/N4BP1/AXIN1/GSK3A/AIMP2/TGFBR1/SEPTIN4/FBXO5/SKP1/PARK7/CDC20/TNFAIP3/MASTL/SOX4/PIN1/NDFIP1/PER2/HSPBP1/PTPN22/SPRY2/DERL1/ARRB2/SPOPL/OGT/RCHY1/CDK5/BTRC/WBP1L/TRIM44/NOD2/NXN/CENPX/PRKCE/GLMN/SVBP/NPM1/ADGRB1/PTTG1IP/PRKN/UBE2L3/PPIA/DAXX/DAXX/DAXX/DAXX/DAXX/PDCD6/SQSTM1/PTEN | 61 |
| GO:0006368 | transcription elongation by RNA polymerase II promoter | 34/3662 | 96/15509 | 0.00595596 | 0.0212767 | 0.0127954 | PAF1/MED24/MED17/MED29/SIRT6/CCNK/SUPT16H/MED15/CBX7/AXIN1/MED25/POLR2I/ELL/EZH2/RECQL5/INTS2/ADRM1/MED6/ELP2/NCBP1/INTS14/SKIC8/INTS3/ERCC3/SHH/MED30/INTS1/CDK12/LARP7/MED16/SETD2/HEXIM1/TCEA1/NELFB | 34 |
| GO:0030111 | regulation of Wnt signaling pathway | 89/3662 | 296/15509 | 0.0059672 | 0.0213046 | 0.0128122 | ITGA3/SNAI2/PTPRU/CDH3/FGFR2/VPS35/GSK3B/ABL1/GSKIP/CHD8/FERMT1/AXIN1/TSC2/SFRP1/TLE5/TGFB1/GSK3A/SFRP4/SPIN1/DKK1/RNF43/WNT3/FOLR1/MDK/WNT5B/MAPK14/PPP2CA/NPHP3/KPNA1/WNT5A/IGFBP2/HDAC1/TNFAIP3/FOXO3/SFRP5/EGR1/RECK/PFDN5/LRP1/SOX4/BMP2/PIN1/APOE/LRP4/APC/MDFIC/PPM1B/FGF2/EGF/CSNK1D/APP/RBMS3/TPBG/EGFR/NOTCH1/TCF7L2/FOXO1/HHEX/GNAQ/WIF1/SKI/DISC1/FRZB/TERT/SHH/VCP/AMER2/BTRC/NXN/RBPJ/ZEB2/CTNND2/CDH2/RNF213/FZD4/DDIT3/FOXL1/CTNNBIP1/NKX2-5/NOG/ZNF703/NOTUM/PRKN/RNF220/FZD9/SRC/NRARP/WNT3/WNT3 | 89 |
| GO:0045576 | mast cell activation | 23/3662 | 59/15509 | 0.00598364 | 0.0213509 | 0.0128401 | BTK/GAB2/C12orf4/STXBP2/IL4R/LAT2/GATA1/PIK3CG/IL4/SNX4/VAMP8/NR4A3/RAC2/NECTIN2/STXBP1/CPLX2/KIT/SYK/RHOH/LGALS9/PLSCR1/CNR2/CRLF2 | 23 |
| GO:0010675 | regulation of cellular carbohydrate metabolic process | 44/3662 | 131/15509 | 0.00599174 | 0.0213676 | 0.0128501 | BAD/SLC4A1/CRY1/IGF1/PDK3/SIRT6/DUSP12/GSK3B/ZMPSTE24/GSK3A/KAT2B/PASK/LEPR/PPP1R3C/PTK2B/CD244/DYRK2/CBFA2T3/SESN2/KHK/PMAIP1/IGFBP3/OGT/SOGA1/FOXO1/RANBP2/ADIPOR1/GPER1/NNMT/DDIT4/PTAFR/PRKCE/PGAM1/MST1/LEP/PTPN2/ERFE/ADIPOQ/PHLDA2/PRKN/USP7/WDR5/SRC/MTOR | 44 |
| GO:0046661 | male sex differentiation | 51/3662 | 156/15509 | 0.00600649 | 0.0214079 | 0.0128743 | HOXA11/ARID4B/HOXA9/LRP2/ATRX/BAX/ESR1/MSH2/GATA1/SFRP1/TGFBR1/GATA3/BMPR1A/CCND1/SMAD5/PDGFRB/WNT5A/IL1A/SDC1/TNFSF10/INHBA/MEA1/EIF2S2/SOX15/BCL2L2/RARA/HSD17B4/PDGFRA/NKX2-1/CYP1B1/GREB1L/SMAD4/RAB13/REN/ARID5B/DHX37/BCL2L11/BMP6/MMP14/KIT/WNT4/H3-3A/INHBB/TLR3/SHH/ZFPM2/BCL2L1/STAT5B/AKR1C3/NTRK1/HOXA10 | 51 |
| GO:1900407 | regulation of cellular response to oxidative stress | 29/3662 | 79/15509 | 0.00602844 | 0.0214737 | 0.0129139 | NOX1/HGF/AIFM2/ABL1/BMP7/MET/HSPB1/PARK7/FOXO3/NR4A3/TRAP1/CD36/IL10/TLR4/MEAK7/SOD1/PARP1/NONO/TBC1D24/PRKN/PPIA/TNF/TNF/TNF/TNF/TNF/TNF/TNF/TNF | 29 |
| GO:0042254 | ribosome biogenesis | 78/3662 | 255/15509 | 0.00604981 | 0.0215375 | 0.0129523 | TSR3/UTP18/RPL26L1/NOP16/RRP15/BUD23/XRCC5/XPO1/DDX18/XRN2/RPL6/PES1/SNU13/NOP56/RIOK3/PIN4/ERCC2/FBL/DDX49/EXOSC3/C1QBP/NOP2/BRIX1/KAT2B/RRP9/EBNA1BP2/NSUN4/UTP20/SBDS/DKC1/NOL11/MYBBP1A/UTP3/ERAL1/LTV1/GLUL/MRPL44/CUL4A/PELP1/EIF4A3/METTL25B/ISG20L2/ABT1/RPL7L1/DHX37/HEATR3/CUL4B/TSR2/RPL26/NOL9/NSA2/DCAF13/RPL10L/RPUSD4/NMD3/MRPL1/PA2G4/RIOX2/MRPL36/EXOSC10/TRMT112/IMP3/NPM1/NOP10/RPS17/TRMT2B/NOC2L/RRP7A/RPL23A/SDAD1/RPL10A/PWP2/EIF6/PRKDC/BOP1/AATF/PTEN/EMG1 | 78 |
| GO:0009126 | purine nucleoside monophosphate metabolic process | 18/3662 | 43/15509 | 0.00607907 | 0.0215797 | 0.0129776 | AK2/GMPR2/PRPS2/AK1/AMPD2/NT5C1A/PAICS/PPAT/NT5E/GUK1/AK3/DCK/GART/AK4/ADSS1/PNP/ADSL/GMPR2 | 18 |
| GO:0030890 | positive regulation of B cell proliferation | 18/3662 | 43/15509 | 0.00607907 | 0.0215797 | 0.0129776 | CD38/BTK/CD74/PTPRC/CD40/NFATC2/IL7/CD81/IL4/IL5/BCL6/CDKN1A/EPHB2/TLR4/IL21/TNFRSF13C/PTPRC/MIF | 18 |
| GO:0031057 | negative regulation of histone modification | 18/3662 | 43/15509 | 0.00607907 | 0.0215797 | 0.0129776 | KDM1A/AASS/FOXP3/KDM4A/SPI1/DNMT3B/SMARCB1/ZNF451/MACROH2A1/KDM3A/DNMT1/SKI/CTBP1/TAF7/NOC2L/PAX5/WDR5/SMARCB1 | 18 |
| GO:0045601 | regulation of endothelial cell differentiation | 18/3662 | 43/15509 | 0.00607907 | 0.0215797 | 0.0129776 | ROCK1/ADD1/IL1B/ID1/BTG1/NOTCH1/ZEB1/BMP6/ZDHHC21/PLCB1/TNF/TNF/TNF/TNF/TNF/TNF/TNF/TNF | 18 |
| GO:2000008 | regulation of protein localization to cell surface | 18/3662 | 43/15509 | 0.00607907 | 0.0215797 | 0.0129776 | HFE/TYROBP/PICALM/ACTN2/HSP90AB1/RANGRF/TMEM35A/EGF/RIC3/BDNF/TNF/TNF/TNF/TNF/TNF/TNF/TNF/TNF | 18 |
| GO:1903201 | regulation of oxidative stress-induced cell death | 26/3662 | 69/15509 | 0.00611432 | 0.0216924 | 0.0130454 | NOX1/HGF/ABL1/MET/HSPB1/PARK7/FOXO3/NR4A3/TRAP1/IL10/TLR4/MEAK7/SOD1/PARP1/NONO/TBC1D24/PRKN/PPIA/TNF/TNF/TNF/TNF/TNF/TNF/TNF/TNF | 26 |
| GO:0003181 | atrioventricular valve morphogenesis | 11/3662 | 22/15509 | 0.00630163 | 0.0222804 | 0.013399 | BMPR1A/SOX4/BMP2/SMAD6/SMAD4/CCN1/NOTCH1/TGFBR2/HEYL/EFNA1/SLIT3 | 11 |
| GO:0010623 | programmed cell death involved in cell development | 11/3662 | 22/15509 | 0.00630163 | 0.0222804 | 0.013399 | BAX/CASP2/IL1A/FASLG/IL1B/FGF2/SOD1/KIT/BCL2L1/NTRK1/PRKDC | 11 |
| GO:0031061 | negative regulation of histone methylation | 11/3662 | 22/15509 | 0.00630163 | 0.0222804 | 0.013399 | KDM1A/AASS/KDM4A/DNMT3B/SMARCB1/MACROH2A1/KDM3A/DNMT1/PAX5/WDR5/SMARCB1 | 11 |
| GO:0070423 | nucleotide-binding oligomerization domain containing signaling pathway | 11/3662 | 22/15509 | 0.00630163 | 0.0222804 | 0.013399 | BIRC3/NFKBIA/MAP2K6/TNFAIP3/PTPN22/TLR4/SLC15A4/NOD2/RELA/LACC1/ITCH | 11 |
| GO:1900120 | regulation of receptor binding | 11/3662 | 22/15509 | 0.00630163 | 0.0222804 | 0.013399 | HFE/MMP9/IL10/ATP2A2/BDNF/ADIPOQ/PHLDA2/RGMA/ANXA2/NOG/B2M | 11 |
| GO:1905820 | positive regulation of chromosome separation | 11/3662 | 22/15509 | 0.00630163 | 0.0222804 | 0.013399 | CDC27/ANAPC5/BIRC5/SMC4/CDCA8/NUMA1/RB1/NCAPG2/AURKB/MAPK15/PLSCR1 | 11 |
| GO:0046596 | regulation of viral entry into host cell | 17/3662 | 40/15509 | 0.00632244 | 0.0223412 | 0.0134356 | CD4/CD74/MID2/TRIM14/TRIM25/NECTIN2/TRIM5/TRIM22/FURIN/GSN/TRIM68/LGALS9/TRIM8/CIITA/IFITM1/HMGB1/TRIM26 | 17 |
| GO:0070542 | response to fatty acid | 22/3662 | 56/15509 | 0.00638094 | 0.0225222 | 0.0135445 | BAD/PON1/PPP5C/CPS1/PDK3/XRCC5/SCD/PLAT/HES1/FOXO3/CAT/ASS1/CD36/ALAD/FOXO1/PTAFR/LPL/ADIPOQ/PLCB1/AKR1C3/SRC/MBP | 22 |
| GO:0071384 | cellular response to corticosteroid stimulus | 22/3662 | 56/15509 | 0.00638094 | 0.0225222 | 0.0135445 | PCK2/PLAT/GSK3A/RPS6KB1/ARG1/FOXO3/KLF9/FLT3/ZFP36/ASS1/CYP1B1/IGF1R/ZFP36L2/BCL2L11/STC1/SCNN1D/GPER1/DDIT4/SSTR2/ZFP36L1/UBE2L3/AKR1C3 | 22 |
| GO:0046546 | development of primary male sexual characteristics | 45/3662 | 135/15509 | 0.00641502 | 0.0226297 | 0.0136091 | HOXA11/ARID4B/HOXA9/LRP2/ATRX/BAX/ESR1/MSH2/GATA1/SFRP1/TGFBR1/GATA3/CCND1/PDGFRB/WNT5A/IL1A/SDC1/TNFSF10/INHBA/MEA1/EIF2S2/SOX15/BCL2L2/RARA/HSD17B4/PDGFRA/NKX2-1/CYP1B1/SMAD4/RAB13/REN/ARID5B/DHX37/BCL2L11/MMP14/KIT/WNT4/H3-3A/INHBB/TLR3/ZFPM2/BCL2L1/AKR1C3/NTRK1/HOXA10 | 45 |
| GO:0110149 | regulation of biomineralization | 33/3662 | 93/15509 | 0.0064591 | 0.0227722 | 0.0136948 | LTF/ROCK1/ZMPSTE24/TXLNG/P2RX7/BMP7/GATA1/TGFB1/PTN/BMPR1A/CYP27B1/VDR/FBXO5/PTK2B/SRGN/BMP2/TFAP2A/FBN2/CCN1/NOTCH1/BMP6/WNT4/NOS3/SLC4A2/ADRB2/S1PR1/CEBPB/FAM20C/SLC8A1/RFLNB/NOTUM/FZD9/RXRB | 33 |
| GO:0030071 | regulation of mitotic metaphase/anaphase transition | 28/3662 | 76/15509 | 0.0065102 | 0.0229229 | 0.0137854 | CDC27/ARID1B/ACTB/NDC80/ZW10/ANAPC5/BIRC5/CDC6/BCL7C/SMARCB1/SMARCD2/BCL7A/FBXO5/CDC20/ARID1A/TEX14/CCNB1/CDCA8/APC/CENPE/RB1/SPC25/BRD7/BUB1/ZWILCH/AURKB/ARID2/SMARCB1 | 28 |
| GO:0060395 | SMAD protein signal transduction | 28/3662 | 76/15509 | 0.0065102 | 0.0229229 | 0.0137854 | HIPK2/BMP7/SMAD7/TGFB1/TGFBR1/BMPR1A/ZMIZ1/SMAD5/INHBA/LRP1/BMP2/GDF15/CCN3/KIAA0319/SMAD6/TOB1/SMAD4/PARP1/BMP6/NODAL/SKI/INHBB/GDF9/FOS/SMAD2/JUN/MAGI2/SLC2A10 | 28 |
| GO:1903052 | positive regulation of proteolysis involved in protein catabolic process | 43/3662 | 128/15509 | 0.00651293 | 0.0229229 | 0.0137854 | OSBPL7/PSMC4/RNF14/HERPUD1/ATXN3/SIRT2/MKRN2/SIRT6/GSK3B/PSMC5/HECTD1/BAG6/PSMC6/SMAD7/AXIN1/SGTA/GSK3A/DVL1/CTSC/USP5/CDC20/CLU/PTK2B/CBFA2T3/HSPBP1/EGF/CSNK1D/RNF144A/PSMC2/DISC1/RCHY1/VCP/PSMC3/PTK2/MAGEF1/PRKN/BAG6/BAG6/BAG6/BAG6/BAG6/CEBPA/PTEN | 43 |
| GO:0030041 | actin filament polymerization | 50/3662 | 153/15509 | 0.00652565 | 0.0229463 | 0.0137995 | SCIN/TTC17/CYFIP2/RHOA/SPTB/ADD2/ADD1/ABL1/HCK/COTL1/PYCARD/MTPN/CSF3/ARPC3/DBN1/CAPZA1/PTK2B/CCR7/CDC42EP1/ARPC1B/WASF3/DBNL/CCL21/RDX/DIAPH3/BBS4/SLIT2/ARHGAP18/GSN/CDC42EP2/DMTN/SPTBN4/ALOX15/ARPC5/CDC42EP3/SPTA1/PRKCD/RICTOR/PRKCE/CCL11/SPTBN2/FLII/GRB2/SPTAN1/MSRB1/MTOR/IQANK1/TMSB4X/ARPC1A/TWF2 | 50 |
| GO:0034110 | regulation of homotypic cell-cell adhesion | 16/3662 | 37/15509 | 0.0065307 | 0.0229463 | 0.0137995 | CD9/CTSG/SH2B3/SERPINE2/IL6/RDX/ADAMTS18/PRKCA/DMTN/JAK1/PRKCD/SYK/FGG/ZNF703/CCL5/CCL5 | 16 |
| GO:0043618 | regulation of transcription from RNA polymerase II promoter in response to stress | 16/3662 | 37/15509 | 0.0065307 | 0.0229463 | 0.0137995 | MBTPS2/HSPA5/SIRT2/EPAS1/EGR1/CHD6/TMBIM6/ARNT/BAG3/ATF3/HIF1AN/RBPJ/CEBPB/DDIT3/JUN/MUC1 | 16 |
| GO:0043506 | regulation of JUN kinase activity | 25/3662 | 66/15509 | 0.00657295 | 0.0230813 | 0.0138807 | AXIN1/SFRP1/DKK1/FZD10/WNT5A/PTK2B/PTPN22/MAP3K12/TNFRSF11A/DUSP10/DVL3/SYK/CCL19/FZD4/ERN1/MAP3K5/TNF/TNF/TNF/TNF/TNF/TNF/TNF/TNF/LOC102724560 | 25 |
| GO:0009144 | purine nucleoside triphosphate metabolic process | 67/3662 | 215/15509 | 0.00657657 | 0.0230813 | 0.0138807 | BAD/AK2/SLC4A1/IGF1/PKM/RHOA/SIRT6/DNM1L/P2RX7/GPI/TGFB1/AK1/ENO3/ALDOC/NDUFC1/HSPA8/IFNG/IL4/ATP6V1A/ATP5PB/NDUFA8/ITPA/CBFA2T3/PRKAA1/NT5E/OLA1/APP/ARNT/PKLR/PARP1/NDUFS6/OGT/ATP6V1B2/NDUFB9/AK3/NDUFC2/AK5/ATP5MC3/NDUFS2/NDUFV3/SLC2A6/AK4/VCP/NUDT5/LDHC/ATP5MG/GPD1/NDUFV1/DDIT4/NDUFS5/ATP5ME/PGAM1/ATP5MK/DNAJC30/ENTPD7/ND6/MTOR/TMSB4X/ND4L/NDUFS3/FIS1/NME1/ATP5MF/EIF6/PKLR/GPI/LDHA | 67 |
| GO:0003272 | endocardial cushion formation | 12/3662 | 25/15509 | 0.00661717 | 0.0230974 | 0.0138904 | SNAI2/BMP7/TGFBR1/ENG/BMPR1A/BMP2/SMAD4/NOTCH1/TGFBR2/HEYL/RBPJ/NOG | 12 |
| GO:0014912 | negative regulation of smooth muscle cell migration | 12/3662 | 25/15509 | 0.00661717 | 0.0230974 | 0.0138904 | RHOA/APEX1/NDRG4/SERPINE1/BMPR1A/PPARD/GNA13/LRP1/SLIT2/GNA12/IGFBP3/ADIPOQ | 12 |
| GO:0046697 | decidualization | 12/3662 | 25/15509 | 0.00661717 | 0.0230974 | 0.0138904 | PTN/CYP27B1/VDR/PPARD/ASH1L/SPP1/LIF/MEN1/PARP1/STC1/BSG/EPOR | 12 |
| GO:0048668 | collateral sprouting | 12/3662 | 25/15509 | 0.00661717 | 0.0230974 | 0.0138904 | IFRD1/DVL1/WNT3/SPP1/NGF/APP/CRABP2/LPAR3/BDNF/DCC/WNT3/WNT3 | 12 |
| GO:0060765 | regulation of androgen receptor signaling pathway | 12/3662 | 25/15509 | 0.00661717 | 0.0230974 | 0.0138904 | KDM1A/RNF14/PIAS2/SFRP1/DDX5/PARK7/HDAC1/PKN1/NODAL/PRMT2/HEYL/TRIM68 | 12 |
| GO:0070233 | negative regulation of T cell apoptotic process | 12/3662 | 25/15509 | 0.00661717 | 0.0230974 | 0.0138904 | ST3GAL1/ARG2/JAK3/GPAM/BCL11B/TSC22D3/RAG1/FADD/EFNA1/PTCRA/CCL5/CCL5 | 12 |
| GO:0070723 | response to cholesterol | 12/3662 | 25/15509 | 0.00661717 | 0.0230974 | 0.0138904 | OSBPL7/F7/MLC1/TGFB1/TGFBR1/INHBA/CCR5/INHBB/TGFBR2/DAG1/SMAD2/LRP6 | 12 |
| GO:0070977 | bone maturation | 12/3662 | 25/15509 | 0.00661717 | 0.0230974 | 0.0138904 | MBTPS2/LTF/IGF1/RHOA/FGFR3/XYLT1/ZBTB16/BMP2/ADAMTS7/LEP/RFLNB/GH1 | 12 |
| GO:0071539 | protein localization to centrosome | 12/3662 | 25/15509 | 0.00661717 | 0.0230974 | 0.0138904 | SPAG5/PCM1/GSK3B/PIBF1/NSFL1C/PARD6A/APC/BBS4/CSNK1D/CEP131/BICD1/DISC1 | 12 |
| GO:0051224 | negative regulation of protein transport | 37/3662 | 107/15509 | 0.00661843 | 0.0230974 | 0.0138904 | RHBDF1/SP100/DERL2/LMAN1/SIRT6/RANGAP1/FERMT1/NDFIP2/CSK/SFRP1/PSMD9/IL12B/PARK7/IL1B/APOE/NDFIP1/CD36/MDFIC/CCN3/SNX12/FOXO1/BAG3/DMTN/INHBB/CDK5/PKIG/PTPN11/YOD1/ADIPOQ/F2R/PRKN/KCNJ11/SVIP/PIM3/WWP2/UBE2J1/GDI1 | 37 |
| GO:0051302 | regulation of cell division | 53/3662 | 164/15509 | 0.00669172 | 0.02334 | 0.0140363 | SPAST/FGFR2/RHOA/SIRT2/CDC42/TP63/BIRC5/CDC6/SH3GLB1/OSM/PDGFB/CDC25B/RAB11A/TGFB1/PTN/MDK/IL1A/DR1/PGF/TEX14/CAT/IL1B/BECN1/PIN1/CDCA8/KIF13A/KIF23/FGF2/BRCA2/IGF1R/BBS4/CALM2/PKP4/PDGFC/PLK2/KAT14/VEGFC/MBIP/CALM3/CXCR5/TAL1/MAP9/SHH/PRKCE/TADA3/BCL2L1/AURKB/SETD2/CIB1/WDR5/PDXP/TXNIP/TADA2A | 53 |
| GO:0001783 | B cell apoptotic process | 13/3662 | 28/15509 | 0.00676082 | 0.0234754 | 0.0141177 | BTK/CD74/BAK1/BAX/BCL6/PKN1/IL10/TNFRSF21/ORMDL3/AURKB/NOC2L/MIF/PTEN | 13 |
| GO:0006359 | regulation of transcription by RNA polymerase III | 13/3662 | 28/15509 | 0.00676082 | 0.0234754 | 0.0141177 | BAZ1B/CHD8/ELL/SF3B1/INHBA/DEK/ICE2/MYBBP1A/POLR3F/SMARCA5/BRF1/MTOR/ZNF345 | 13 |
| GO:0045648 | positive regulation of erythrocyte differentiation | 13/3662 | 28/15509 | 0.00676082 | 0.0234754 | 0.0141177 | GATA1/MAPK14/STAT1/FOXO3/INHBA/PRMT1/ABCB10/ARNT/TAL1/INPP5D/STAT5B/PRKDC/INPP5D | 13 |
| GO:0051204 | protein insertion into mitochondrial membrane | 13/3662 | 28/15509 | 0.00676082 | 0.0234754 | 0.0141177 | AGK/BAX/TIMM13/SAMM50/GZMB/TIMM9/PDCD5/MAPK8/TIMM10B/NMT1/TIMM8B/TOMM20/TOMM5 | 13 |
| GO:0051953 | negative regulation of amine transport | 13/3662 | 28/15509 | 0.00676082 | 0.0234754 | 0.0141177 | SYT11/ARL6IP5/SLC43A2/LEP/ADRA2C/TNF/TNF/TNF/TNF/TNF/TNF/TNF/TNF | 13 |
| GO:0140718 | facultative heterochromatin formation | 13/3662 | 28/15509 | 0.00676082 | 0.0234754 | 0.0141177 | KDM1A/SIRT2/MBD3/AICDA/HDAC1/DNMT3A/HELLS/DNMT1/PPHLN1/TET1/SMARCA5/PHF2/L3MBTL3 | 13 |
| GO:0003180 | aortic valve morphogenesis | 14/3662 | 31/15509 | 0.00677333 | 0.0234754 | 0.0141177 | SNAI2/TIE1/ROCK1/TGFB1/GATA3/SMAD6/RB1/SLIT2/NOTCH1/HEYL/NOS3/EFNA1/NKX2-5/SLIT3 | 14 |
| GO:0010390 | histone monoubiquitination | 14/3662 | 31/15509 | 0.00677333 | 0.0234754 | 0.0141177 | PAF1/RAD51/ATXN7L3/KDM2B/SKP1/DDB2/BRCA2/RNF20/CUL4B/RYBP/RAG1/PCGF5/UHRF1/PCGF2 | 14 |
| GO:0033687 | osteoblast proliferation | 14/3662 | 31/15509 | 0.00677333 | 0.0234754 | 0.0141177 | LTF/EIF2AK2/FGFR2/RHOA/ABL1/GATA1/SFRP1/BMP2/ITGAV/IGF1R/CCN1/MN1/NF2/ITGB3 | 14 |
| GO:0001541 | ovarian follicle development | 21/3662 | 53/15509 | 0.00679112 | 0.0234754 | 0.0141177 | MSH4/BAX/MMP2/ESR1/PCYT1B/FOXO3/EIF2B2/INHBA/KDR/ARRB2/SMAD4/SOD1/GAS2/MMP14/KIT/INHBB/BCL2L1/CEBPB/ZP3/SRC/FANCG | 21 |
| GO:0010518 | positive regulation of phospholipase activity | 21/3662 | 53/15509 | 0.00679112 | 0.0234754 | 0.0141177 | SELE/FGFR2/FGFR3/FGFR1/ESR1/FLT1/PDGFRB/CD86/GNA13/PDGFRA/PLCB2/FGF2/CCN1/ABL2/EGFR/GNAQ/KIT/PTAFR/HRAS/CCL5/CCL5 | 21 |
| GO:0045778 | positive regulation of ossification | 21/3662 | 53/15509 | 0.00679112 | 0.0234754 | 0.0141177 | LTF/P2RX7/BMP7/TGFB1/PTN/BMPR1A/ZBTB16/VDR/WNT5A/BMP2/TFAP2A/FBN2/CCN1/BMP6/WNT4/ADRB2/FAM20C/PTPN11/SLC8A1/FZD9/RXRB | 21 |
| GO:0048008 | platelet-derived growth factor receptor signaling pathway | 21/3662 | 53/15509 | 0.00679112 | 0.0234754 | 0.0141177 | F7/ABL1/PDGFB/NDRG4/PLAT/PDGFRB/NR4A3/LRP1/PDGFRA/CSRNP1/PDGFC/ARID5B/RGS14/CSPG4/PTPN2/PTPN11/ADIPOQ/HGS/SRC/ITGB3/TXNIP | 21 |
| GO:0097352 | autophagosome maturation | 21/3662 | 53/15509 | 0.00679112 | 0.0234754 | 0.0141177 | CLEC16A/PHF23/VMP1/TBC1D25/CHMP5/SNAP29/CHMP4B/VAMP8/BECN1/ATG14/CHMP1A/SNX14/SNAPIN/FYCO1/VCP/ADRB2/ATP2A2/CHMP6/TMEM39A/CLN3/LIX1L | 21 |
| GO:0110151 | positive regulation of biomineralization | 21/3662 | 53/15509 | 0.00679112 | 0.0234754 | 0.0141177 | LTF/P2RX7/BMP7/TGFB1/PTN/BMPR1A/VDR/FBXO5/BMP2/TFAP2A/FBN2/CCN1/BMP6/WNT4/SLC4A2/ADRB2/CEBPB/FAM20C/SLC8A1/FZD9/RXRB | 21 |
| GO:1902808 | positive regulation of cell cycle G1/S phase transition | 21/3662 | 53/15509 | 0.00679112 | 0.0234754 | 0.0141177 | KMT2E/PAF1/CDC6/APEX1/EZH2/CCND1/CCND3/RDX/CUL4A/CYP1A1/EGFR/ADAMTS1/LSM11/CUL4B/TERT/RRM1/RRM2/PLCB1/CDK10/TFDP1/PAGR1 | 21 |
| GO:0019693 | ribose phosphate metabolic process | 122/3662 | 423/15509 | 0.00686978 | 0.0237341 | 0.0142732 | BAD/AK2/SLC4A1/AASS/IGF1/PDE4A/PKM/RHOA/PDK3/SIRT6/DNM1L/P2RX7/DLD/ACOT7/TECR/SLC25A1/MTHFD1/GMPR2/PRPS2/GPI/TGFB1/GCDH/AK1/ENO3/ALDOC/NDUFC1/HSPA8/MVK/IFNG/PDE8B/PDE4D/IL4/ATP6V1A/ABHD14B/AMPD2/ATP5PB/NT5C1A/NDUFA8/GPAM/ACSL3/MCEE/ITPA/PAICS/PPAT/CBFA2T3/ACLY/PRKAA1/HSD17B4/NT5E/OLA1/NUDT7/APP/EPHA2/ADCY10/ARNT/PKLR/GUK1/PARP1/NDUFS6/OGT/ATP6V1B2/NDUFB9/AK3/DLAT/OXSM/NDUFC2/AK5/ATP5MC3/ACSS1/SLC26A2/DCK/NDUFS2/GART/PDE9A/NDUFV3/SLC2A6/CMPK1/AK4/TKT/ELOVL7/ACSL6/ADCY1/VCP/NUDT5/LDHC/ATP5MG/GPD1/NDUFV1/DDIT4/NDUFS5/ATP5ME/HINT1/TPST1/PGAM1/PDE7B/SUCLG2/ATP5MK/DNAJC30/CACNB4/NUDT14/PDE4B/ADSS1/DPYD/ENTPD4/ENTPD7/ND6/MTOR/PNP/TMSB4X/ND4L/NDUFS3/NUDT19/FIS1/NME1/ADSL/ATP5MF/EIF6/PKLR/NUDT3/GPI/GMPR2/LDHA | 122 |
| GO:0001823 | mesonephros development | 32/3662 | 90/15509 | 0.00700481 | 0.0241736 | 0.0145376 | HOXA11/FGFR2/ARG2/BMP7/SMAD7/EYA1/SFRP1/TMEM59L/GATA3/ZBTB16/SMAD5/HES1/SDC1/PKD2/CAT/BMP2/FOXJ1/LAMA5/RARA/SMAD6/FGF2/GREB1L/SMAD4/REN/SLIT2/ADAMTS16/WNT4/SHH/SMAD2/CTNNBIP1/NOG/PBX1 | 32 |
| GO:0044070 | regulation of anion transport | 32/3662 | 90/15509 | 0.00700481 | 0.0241736 | 0.0145376 | ATP8B1/ABCB1/P2RX7/SFRP4/MAP2K6/IL1A/ARG1/CRY2/IL1B/PER2/PRKAA1/STXBP1/TNFRSF11A/ARL6IP5/ITGB1/STC1/SYK/SLC43A2/AHCYL1/PTAFR/CEBPB/LEP/PDZK1/TNF/TNF/TNF/TNF/TNF/TNF/TNF/TNF/MIF | 32 |
| GO:0006801 | superoxide metabolic process | 24/3662 | 63/15509 | 0.00705968 | 0.0243359 | 0.0146352 | MPO/NOX1/TYROBP/CYBA/NOX4/BMP7/ACP5/TGFB1/SH3PXD2A/PRDX1/CD36/SOD1/FANCC/ITGB2/PRKCD/NOS3/SYK/CYBB/PRDX2/ITGAM/NQO1/CD177/LOC102724560/AATF | 24 |
| GO:0010517 | regulation of phospholipase activity | 24/3662 | 63/15509 | 0.00705968 | 0.0243359 | 0.0146352 | SELE/FGFR2/FGFR3/FGFR1/ESR1/ABL1/FLT1/PDGFRB/CD86/GNA13/LRP1/PDGFRA/PLCB2/FGF2/CCN1/ABL2/EGFR/BICD1/GNAQ/KIT/PTAFR/HRAS/CCL5/CCL5 | 24 |
| GO:0009950 | dorsal/ventral axis specification | 8/3662 | 14/15509 | 0.00713386 | 0.0244151 | 0.0146828 | AXIN1/SFRP1/BMPR1A/WNT3/SMAD6/SMAD2/WNT3/WNT3 | 8 |
| GO:0033008 | positive regulation of mast cell activation involved in immune response | 8/3662 | 14/15509 | 0.00713386 | 0.0244151 | 0.0146828 | GAB2/IL4R/GATA1/IL4/SNX4/VAMP8/STXBP1/SYK | 8 |
| GO:0033599 | regulation of mammary gland epithelial cell proliferation | 8/3662 | 14/15509 | 0.00713386 | 0.0244151 | 0.0146828 | BAX/HOXA5/GATA3/CCND1/KDM5B/BRCA2/PYGO2/ZNF703 | 8 |
| GO:0034111 | negative regulation of homotypic cell-cell adhesion | 8/3662 | 14/15509 | 0.00713386 | 0.0244151 | 0.0146828 | CD9/SH2B3/SERPINE2/RDX/ADAMTS18/PRKCD/FGG/ZNF703 | 8 |
| GO:0043306 | positive regulation of mast cell degranulation | 8/3662 | 14/15509 | 0.00713386 | 0.0244151 | 0.0146828 | GAB2/IL4R/GATA1/IL4/SNX4/VAMP8/STXBP1/SYK | 8 |
| GO:0043518 | negative regulation of DNA damage response, signal transduction by p53 class mediator | 8/3662 | 14/15509 | 0.00713386 | 0.0244151 | 0.0146828 | KDM1A/SNAI2/CD74/CD44/YJU2/DYRK3/PTTG1IP/MIF | 8 |
| GO:0044849 | estrous cycle | 8/3662 | 14/15509 | 0.00713386 | 0.0244151 | 0.0146828 | OPRK1/ADNP/PTN/MDK/EGR1/CYP1B1/IGF1R/OXTR | 8 |
| GO:0045623 | negative regulation of T-helper cell differentiation | 8/3662 | 14/15509 | 0.00713386 | 0.0244151 | 0.0146828 | FOXP3/TBX21/IL4R/SMAD7/JAK3/IL4/BCL6/HLX | 8 |
| GO:0045651 | positive regulation of macrophage differentiation | 8/3662 | 14/15509 | 0.00713386 | 0.0244151 | 0.0146828 | TGFB1/ID2/LIF/RB1/PRKCA/PF4/FADD/CSF1 | 8 |
| GO:0048934 | peripheral nervous system neuron differentiation | 8/3662 | 14/15509 | 0.00713386 | 0.0244151 | 0.0146828 | RUNX3/HOXD9/NTRK2/POU4F1/RUNX1/ISL2/SLC25A46/TBCE | 8 |
| GO:0048935 | peripheral nervous system neuron development | 8/3662 | 14/15509 | 0.00713386 | 0.0244151 | 0.0146828 | RUNX3/HOXD9/NTRK2/POU4F1/RUNX1/ISL2/SLC25A46/TBCE | 8 |
| GO:0150079 | negative regulation of neuroinflammatory response | 8/3662 | 14/15509 | 0.00713386 | 0.0244151 | 0.0146828 | IGF1/TNFRSF1B/GRN/PTPRC/IL4/NR1D1/SYT11/PTPRC | 8 |
| GO:2001028 | positive regulation of endothelial cell chemotaxis | 8/3662 | 14/15509 | 0.00713386 | 0.0244151 | 0.0146828 | FGFR1/PRKD2/MET/HSPB1/SMOC2/KDR/FGF2/TMSB4X | 8 |
| GO:0016485 | protein processing | 73/3662 | 238/15509 | 0.00718673 | 0.0245824 | 0.0147834 | BAD/TMEM98/BAK1/CYFIP2/F7/PRKACA/ZMPSTE24/ADAMTS2/CPXM1/P2RX7/GLG1/APOH/MYH9/CTSG/PYCARD/PLAT/CASP2/SERPINE1/PLGRKT/HGFAC/PERP/SPCS1/SRGN/MYRF/CHAC1/CPLANE2/ADAM19/CPM/SERPINE2/THBS1/ENPEP/FURIN/PARP1/PSEN2/REN/CORIN/OGT/SNX12/GSN/IMMP1L/CAST/MMP14/SPPL3/RUNX1/ADAMTS13/OMA1/CAPN2/MELTF/CASP3/SHH/FXN/MYRFL/FADD/BMP1/FGG/FGA/RCE1/ASPRV1/ANXA2/CNTN2/CLN3/MME/SRC/DDI2/DPP4/MAFB/PSENEN/MAGEA3/PISD/HP/ADAMTS13/GGT1/PRKACA | 73 |
| GO:0009185 | ribonucleoside diphosphate metabolic process | 38/3662 | 111/15509 | 0.00719649 | 0.0246022 | 0.0147954 | BAD/AK2/SLC4A1/IGF1/PKM/SIRT6/P2RX7/GPI/AK1/ENO3/ALDOC/IFNG/CBFA2T3/PRKAA1/NT5E/APP/ARNT/PKLR/GUK1/OGT/AK3/AK5/SLC2A6/CMPK1/AK4/NUDT5/RRM1/GPD1/DDIT4/PGAM1/RRM2/ENTPD4/ENTPD7/MTOR/EIF6/PKLR/GPI/LDHA | 38 |
| GO:0010543 | regulation of platelet activation | 20/3662 | 50/15509 | 0.00721065 | 0.0246235 | 0.0148081 | CD9/PDGFB/CTSG/SH2B3/APOE/PDGFRA/SERPINE2/IL6/TLR4/ADAMTS18/PRKCA/GNAQ/DMTN/PRKCD/NOS3/SYK/FUNDC2/FGG/SELP/F2 | 20 |
| GO:0048010 | vascular endothelial growth factor receptor signaling pathway | 20/3662 | 50/15509 | 0.00721065 | 0.0246235 | 0.0148081 | FLT4/FLT1/PRKD2/HSPB1/MAPK14/PGF/PTK2B/IL1B/KDR/ARNT/VEGFC/HHEX/MAPKAPK2/PTK2/FZD4/PAK2/HGS/SRC/PDCD6/ITGB3 | 20 |
| GO:0009259 | ribonucleotide metabolic process | 120/3662 | 416/15509 | 0.00725694 | 0.0247679 | 0.014895 | BAD/AK2/SLC4A1/AASS/IGF1/PDE4A/PKM/RHOA/PDK3/SIRT6/DNM1L/P2RX7/DLD/ACOT7/TECR/SLC25A1/MTHFD1/GMPR2/PRPS2/GPI/TGFB1/GCDH/AK1/ENO3/ALDOC/NDUFC1/HSPA8/MVK/IFNG/PDE8B/PDE4D/IL4/ATP6V1A/ABHD14B/AMPD2/ATP5PB/NT5C1A/NDUFA8/GPAM/ACSL3/MCEE/ITPA/PAICS/PPAT/CBFA2T3/ACLY/PRKAA1/HSD17B4/NT5E/OLA1/NUDT7/APP/EPHA2/ADCY10/ARNT/PKLR/GUK1/PARP1/NDUFS6/OGT/ATP6V1B2/NDUFB9/AK3/DLAT/OXSM/NDUFC2/AK5/ATP5MC3/ACSS1/SLC26A2/DCK/NDUFS2/GART/PDE9A/NDUFV3/SLC2A6/CMPK1/AK4/ELOVL7/ACSL6/ADCY1/VCP/NUDT5/LDHC/ATP5MG/GPD1/NDUFV1/DDIT4/NDUFS5/ATP5ME/HINT1/TPST1/PGAM1/PDE7B/SUCLG2/ATP5MK/DNAJC30/CACNB4/PDE4B/ADSS1/DPYD/ENTPD4/ENTPD7/ND6/MTOR/PNP/TMSB4X/ND4L/NDUFS3/NUDT19/FIS1/NME1/ADSL/ATP5MF/EIF6/PKLR/NUDT3/GPI/GMPR2/LDHA | 120 |
| GO:0010232 | vascular transport | 29/3662 | 80/15509 | 0.00736371 | 0.0250909 | 0.0150892 | ABCC2/ATP2B4/SLC2A3/LRP2/ABCB1/SLC7A8/ABCC1/SLC1A5/ABCC3/SLC29A1/LEPR/SLC2A1/SLC16A7/ABCG2/LRP1/ABCC4/APOE/CD36/SLC7A1/SLC16A2/SLC2A13/SLC13A3/SLC27A4/SLC19A1/SLC22A1/SLC22A5/SLC2A10/SLC5A3/ABCC1 | 29 |
| GO:0044784 | metaphase/anaphase transition of cell cycle | 29/3662 | 80/15509 | 0.00736371 | 0.0250909 | 0.0150892 | CDC27/ARID1B/ACTB/NDC80/ZW10/ANAPC5/BIRC5/CDC6/BCL7C/SMARCB1/SMARCD2/BCL7A/FBXO5/CDC20/ARID1A/TEX14/CCNB1/CDCA8/APC/CENPE/RB1/SPC25/BRD7/BUB1/ZWILCH/AURKB/MAPK15/ARID2/SMARCB1 | 29 |
| GO:0150104 | transport across blood-brain barrier | 29/3662 | 80/15509 | 0.00736371 | 0.0250909 | 0.0150892 | ABCC2/ATP2B4/SLC2A3/LRP2/ABCB1/SLC7A8/ABCC1/SLC1A5/ABCC3/SLC29A1/LEPR/SLC2A1/SLC16A7/ABCG2/LRP1/ABCC4/APOE/CD36/SLC7A1/SLC16A2/SLC2A13/SLC13A3/SLC27A4/SLC19A1/SLC22A1/SLC22A5/SLC2A10/SLC5A3/ABCC1 | 29 |
| GO:0003018 | vascular process in circulatory system | 78/3662 | 257/15509 | 0.00746974 | 0.0254382 | 0.0152981 | CD38/CPS1/ABCC2/CASR/ATP2B4/SLC2A3/RHOA/ROCK1/LRP2/ABCB1/MMP2/SLC7A8/ABL1/ABCC1/TJP1/SLC1A5/TGFB1/ACTA2/ABCC3/CALCA/PPARD/SLC29A1/LEPR/SLC2A1/SLC16A7/ABCG2/TEK/LRP1/ABCC4/APOE/AKAP12/PER2/CD36/EDNRB/SLC7A1/SOD1/SLIT2/SLC16A2/SLC2A13/BMP6/DDAH1/SLC13A3/ARHGAP35/GPER1/NOS3/SLC27A4/ADRB2/FGG/FGA/PDE3A/SLC19A1/LEP/SLC22A1/ZDHHC21/PLEC/CTNNBIP1/CXCR2/OXTR/F2R/SLC8A1/ADRA2C/PTP4A3/SRC/SLC22A5/SLC2A10/SLC5A3/TNF/TNF/TNF/TNF/TNF/TNF/TNF/TNF/HBB/LOC102724560/TJP1/ABCC1 | 78 |
| GO:0003007 | heart morphogenesis | 71/3662 | 231/15509 | 0.00753176 | 0.0256353 | 0.0154166 | WNT16/SNAI2/PKP2/FGFR2/CDC42/LRP2/ZMPSTE24/TMED2/FKBP1A/DSP/BMP7/SMAD7/NDRG4/EYA1/TGFB1/GSK3A/TGFBR1/ENG/GATA3/BMPR1A/DKK1/ZMIZ1/NSD2/FOLR1/NPHP3/WNT5A/HES1/FHL2/TNNT2/NRP2/PKD2/TEK/SOX4/BMP2/ALDH1A2/TNNI3/COL5A1/CPLANE2/NOTCH2/AHI1/SMAD6/COL2A1/BBS4/SMAD4/CCN1/SLIT2/NOTCH1/POU4F1/ADAMTS1/NODAL/TNNI1/VANGL2/RBM15/TGFBR2/HEYL/PITX2/SHH/NOS3/RBPJ/EFNA1/ARL13B/PTK2/ZFPM2/S1PR1/JUN/NKX2-5/NOG/SLIT3/ARID2/PARVA/MTOR | 71 |
| GO:0046626 | regulation of insulin receptor signaling pathway | 23/3662 | 60/15509 | 0.00757455 | 0.0257668 | 0.0154957 | TSC2/GSK3A/RPS6KB1/CCND3/NCL/NCOA5/IL1B/PRKAA1/SORL1/PIK3R1/OGT/SESN3/ADIPOR1/PRKCD/ZNF592/SLC27A4/LEP/PTPN2/ERFE/PTPN11/SOCS1/SRC/PIP4K2B | 23 |
| GO:0006835 | dicarboxylic acid transport | 31/3662 | 87/15509 | 0.00759665 | 0.0258278 | 0.0155324 | ABCC2/SLC46A1/LRP2/P2RX7/SLC25A14/SLC38A7/SLC1A5/SLC25A11/FOLR1/SLC19A2/PER2/STXBP1/ARL6IP5/SLC26A7/NTRK2/ITGB1/GJA1/SLC26A2/SLC13A3/SLC19A1/KCNJ10/SLC25A10/TRPV1/TNF/TNF/TNF/TNF/TNF/TNF/TNF/TNF | 31 |
| GO:0006260 | DNA replication | 75/3662 | 246/15509 | 0.00762733 | 0.0258997 | 0.0155756 | UPF1/DBF4/NFIX/POLA2/RAD51/MAP2K4/GLI2/ZMPSTE24/ATRX/SUPT16H/CDC6/BRPF3/CDC7/GINS1/ACTR5/RBBP8/POLA1/RBBP7/JADE3/NFAT5/NBN/CHRAC1/RNASEH2A/CCNE1/LIG1/SMC3/RECQL5/ZPR1/CDK2AP1/AICDA/FBXO5/RAD50/PPP2CA/BCL6/INO80D/POLE4/PDS5A/MGME1/SRPK2/HMGA1/SMARCAL1/ZGRF1/EGF/BRCA2/PIF1/CARM1/DTL/PARP1/CCNA2/EGFR/SSRP1/SMARCA5/EME1/CHAF1B/PTMS/DBF4B/RBBP4/S100A11/MCM7/RRM1/CHAF1A/RFWD3/CENPX/CDK1/RRM2/LIG4/KCTD13/CCNE2/RMI2/ZBTB38/RMI1/TRAIP/WDHD1/REPIN1/RTEL1 | 75 |
| GO:0018023 | peptidyl-lysine trimethylation | 19/3662 | 47/15509 | 0.00763452 | 0.0258997 | 0.0155756 | NFYA/KMT2E/ARID4B/KDM4A/NFYC/ATRX/SMARCB1/H1-3/SKIC8/OGT/NSD3/LMNA/SETD5/H1-4/SETD2/SETD3/TET3/H1-2/SMARCB1 | 19 |
| GO:0045047 | protein targeting to ER | 19/3662 | 47/15509 | 0.00763452 | 0.0258997 | 0.0155756 | HSPA5/HERPUD1/SEC61A1/SEC61A2/BAG6/CHMP4B/UBL4A/SGTA/MAN1A1/SPCS1/SRP14/SRPRB/ZFAND2B/SRP68/BAG6/BAG6/BAG6/BAG6/BAG6 | 19 |
| GO:0071168 | protein localization to chromatin | 19/3662 | 47/15509 | 0.00763452 | 0.0258997 | 0.0155756 | SPI1/SIRT6/ESR1/MSH2/EZH2/MACROH2A1/H2BC11/MAU2/WBP2/PPHLN1/RB1/MRNIP/VCP/SETD2/H4C15/H4C14/H4C12/H4C5/H4C4 | 19 |
| GO:0120162 | positive regulation of cold-induced thermogenesis | 33/3662 | 94/15509 | 0.00774189 | 0.0262496 | 0.015786 | KDM1A/ADIPOR2/IL4R/SIRT6/ACHE/SCD/IL4/KDM3A/EPAS1/LEPR/MFN2/CXCR4/THRA/PER2/APC/CD36/IRF4/IGF1R/PDGFC/OGT/LCN2/IL18/GJA1/ADIPOR1/OMA1/SYK/ADRB2/KSR2/CEBPB/LEP/OXTR/ADIPOQ/EBF2 | 33 |
| GO:0002224 | toll-like receptor signaling pathway | 39/3662 | 115/15509 | 0.0077819 | 0.0263708 | 0.0158589 | BTK/LTF/BIRC3/CYBA/WDFY1/ESR1/NFKBIA/CD40/TLR8/TNFAIP3/NR1D1/IRF3/TRAF3/AP3B1/PTPN22/CD36/TLR4/IRF4/SLC15A4/ARRB2/APPL1/GFI1/MAPKAPK2/TLR3/NOD2/TNIP2/CD14/PRKCE/IRAK1/HMGB1/TLR7/TNF/TNF/TNF/TNF/TNF/TNF/TNF/TNF | 39 |
| GO:0042303 | molting cycle | 37/3662 | 108/15509 | 0.00782305 | 0.0264813 | 0.0159254 | ALX4/PUM2/CDH3/NGFR/FGFR2/TP63/GLI2/ZMPSTE24/FERMT1/ERCC2/DKK1/WNT5A/HDAC1/GORAB/INHBA/LAMA5/LRP4/NUMA1/SMAD4/LRIG1/EGFR/NOTCH1/MYSM1/TERT/FOXQ1/SHH/RBPJ/RELA/ZDHHC21/TNF/TNF/TNF/TNF/TNF/TNF/TNF/TNF | 37 |
| GO:0042633 | hair cycle | 37/3662 | 108/15509 | 0.00782305 | 0.0264813 | 0.0159254 | ALX4/PUM2/CDH3/NGFR/FGFR2/TP63/GLI2/ZMPSTE24/FERMT1/ERCC2/DKK1/WNT5A/HDAC1/GORAB/INHBA/LAMA5/LRP4/NUMA1/SMAD4/LRIG1/EGFR/NOTCH1/MYSM1/TERT/FOXQ1/SHH/RBPJ/RELA/ZDHHC21/TNF/TNF/TNF/TNF/TNF/TNF/TNF/TNF | 37 |
| GO:0010959 | regulation of metal ion transport | 108/3662 | 371/15509 | 0.00785541 | 0.0265763 | 0.0159825 | CD4/HFE/CNTN1/FHL1/BAK1/CASR/CYBA/KCNQ1/KCNH2/PKP2/ATP2B4/VMP1/MYLK/RHOA/PRKACA/ACTN2/OPRK1/P2RX5/BAX/FKBP1A/P2RX7/ABL1/PDGFB/KCNN4/LILRB1/CD33/JAK3/HAMP/SCN1B/PIK3CG/TSPAN13/CXCL12/PPP3CB/CCL2/RANGRF/IFNG/PDE4D/PDGFRB/HES1/PKD2/CRHR1/PTK2B/CXCR4/KCNJ2/SEMG1/AHNAK/HSPA2/YWHAH/EPO/CACNG6/SERPINE2/ISCU/FXYD6/EGF/TMBIM6/ARRB2/PSEN2/CALM2/STAC/ANK2/CAMK2G/GSTO1/ITGB1/CNKSR3/MS4A1/EPB41/STC1/CALM3/SPTBN4/SELENON/ATP1A1/C4orf3/GPER1/NOS3/CDK5/GEM/CHP2/STIM1/AHCYL1/ADRB2/KIF5B/PRKCE/IL16/GRIN1/CD19/F2/F2R/CACNB4/SLC8A1/NKX2-5/PDE4B/STAC3/P2RX2/NKAIN2/WWP2/STIMATE/ITGB3/CCL5/B2M/CCL5/LILRB1/CCL4/CCL4/LILRB1/LILRB1/LILRB1/CCL4/PRKACA | 108 |
| GO:0061045 | negative regulation of wound healing | 28/3662 | 77/15509 | 0.00796992 | 0.026949 | 0.0162067 | CD9/APOH/PDGFB/PLAT/SERPINE1/SH2B3/APOE/PDGFRA/SERPINE2/THBS1/FGF2/ADAMTS18/WNT4/PRKCD/NOS3/FGG/FGA/F2/ANXA2/TNF/TNF/TNF/TNF/TNF/TNF/TNF/TNF/PTEN | 28 |
| GO:0015980 | energy derivation by oxidation of organic compounds | 89/3662 | 299/15509 | 0.00798383 | 0.0269813 | 0.0162261 | IGF1/AIFM2/PUM2/CS/PHKA1/RHOA/ACADVL/GSK3B/DLD/MSH2/ACO2/IDH3B/SLC25A14/GYS1/GSK3A/PPIF/NDUFC1/IFNG/NNT/IL4/PASK/PARK7/ATP5PB/LEPR/STBD1/NDUFA8/NR4A3/PPP1R3C/CAT/SLC25A51/SLC25A23/NR1D1/TRAP1/DYRK2/CBFA2T3/COX7B/G6PC1/PER2/MYBBP1A/CCNB1/ISCU/IREB2/KHK/GABARAPL1/CYP1A2/NDUFS6/NDUFB9/DLAT/NDUFC2/NDUFS2/NDUFV3/AK4/FXN/VCP/IDH3A/ATP5MG/GPD1/NDUFV1/NDUFS5/ATP5ME/PRELID1/CDK1/SLC25A33/SUCLG2/LEP/PDE12/DNAJC30/PLEC/COX5A/PHLDA2/IDH2/PPP1R2/ND6/CYTB/MTOR/COX3/TNF/TNF/ND4L/NDUFS3/TNF/TNF/TNF/TNF/TNF/TNF/ADSL/ATP5MF/IL10RB | 89 |
| GO:0030501 | positive regulation of bone mineralization | 18/3662 | 44/15509 | 0.00805577 | 0.0271652 | 0.0163367 | LTF/P2RX7/BMP7/TGFB1/PTN/BMPR1A/VDR/BMP2/TFAP2A/FBN2/CCN1/BMP6/WNT4/ADRB2/FAM20C/SLC8A1/FZD9/RXRB | 18 |
| GO:0042088 | T-helper 1 type immune response | 18/3662 | 44/15509 | 0.00805577 | 0.0271652 | 0.0163367 | TMEM98/SLC11A1/TBX21/IL4R/IL12RB1/IL27RA/JAK3/IL12B/CD80/IL1B/HLX/TLR4/IL18BP/IL18/CCL19/HRAS/HMGB1/MTOR | 18 |
| GO:0043277 | apoptotic cell clearance | 18/3662 | 44/15509 | 0.00805577 | 0.0271652 | 0.0163367 | TYROBP/CCL2/LRP1/C3/BECN1/RAC2/RARA/CD36/THBS1/ITGAV/MERTK/XKR8/ALOX15/RHOH/ADGRB1/HMGB1/TGM2/ITGB3 | 18 |
| GO:0071604 | transforming growth factor beta production | 18/3662 | 44/15509 | 0.00805577 | 0.0271652 | 0.0163367 | TYROBP/FOXP3/CDH3/HSP90AB1/FERMT1/LILRB1/BMPR1A/FN1/THBS1/ITGAV/FURIN/SMAD4/LGALS9/CD24/LILRB1/LILRB1/LILRB1/LILRB1 | 18 |
| GO:0050806 | positive regulation of synaptic transmission | 49/3662 | 151/15509 | 0.00813983 | 0.0274337 | 0.0164982 | TYROBP/GSK3B/ABL1/NALCN/PTN/CCL2/MPP2/RIMS3/PAIP2/PTK2B/STAU1/APOE/EPHB2/GLUL/SERPINE2/STXBP1/CLSTN3/ARRB2/APP/PLK2/NTRK2/SLC24A2/ZDHHC12/ZDHHC3/ADCY1/GPER1/CDK5/CX3CR1/RGS14/KIF5B/PRKCE/KCTD13/GRIN1/OXTR/CACNB4/NOG/MME/NTRK1/TNF/TNF/TNF/TNF/TNF/TNF/TNF/TNF/SHANK3/SQSTM1/PTEN | 49 |
| GO:1903036 | positive regulation of response to wounding | 25/3662 | 67/15509 | 0.00817853 | 0.0275342 | 0.0165586 | GRN/F7/MYLK/APOH/XBP1/FERMT1/PLAT/PTN/SERPINE1/MDK/SMOC2/HBEGF/CXCR4/CD36/THBS1/IGF1R/ITGB1/DMTN/PRDX2/PTK2/PRKCE/HRAS/F2/F2R/MTOR | 25 |
| GO:1903312 | negative regulation of mRNA metabolic process | 25/3662 | 67/15509 | 0.00817853 | 0.0275342 | 0.0165586 | PTBP1/SLC11A1/ELAVL1/FUS/HNRNPC/CIRBP/ZC3H14/LARP4B/C1QBP/SRSF9/MAPK14/SRSF7/SRSF4/TARDBP/RBM42/ZFP36/TOB1/RBMX/MAPKAPK2/PAIP1/ANGEL2/NPM1/RBM10/SECISBP2/TAF15 | 25 |
| GO:0043255 | regulation of carbohydrate biosynthetic process | 30/3662 | 84/15509 | 0.00823843 | 0.0277208 | 0.0166708 | CRY1/IGF1/SIRT6/GSK3B/PDGFB/TGFB1/GSK3A/KAT2B/PASK/LEPR/PPP1R3C/PTK2B/CD244/DYRK2/SESN2/EGF/OGT/SOGA1/FOXO1/RANBP2/GPER1/NNMT/PTAFR/MST1/LEP/PTPN2/ERFE/ADIPOQ/USP7/WDR5 | 30 |
| GO:0032688 | negative regulation of interferon-beta production | 9/3662 | 17/15509 | 0.00835376 | 0.0279119 | 0.0167857 | PYCARD/LILRB1/PPM1B/NLRX1/TRAIP/LILRB1/LILRB1/LILRB1/LILRB1 | 9 |
| GO:0032930 | positive regulation of superoxide anion generation | 9/3662 | 17/15509 | 0.00835376 | 0.0279119 | 0.0167857 | TYROBP/CYBA/TGFB1/SOD1/ITGB2/PRKCD/SYK/ITGAM/CD177 | 9 |
| GO:0032986 | protein-DNA complex disassembly | 9/3662 | 17/15509 | 0.00835376 | 0.0279119 | 0.0167857 | SUPT16H/SMARCB1/SMARCD2/ARID1A/HMGA1/SSRP1/H2AC25/ARID2/SMARCB1 | 9 |
| GO:0033631 | cell-cell adhesion mediated by integrin | 9/3662 | 17/15509 | 0.00835376 | 0.0279119 | 0.0167857 | PIEZO1/ITGA4/PODXL/ITGB1/CXCL13/ADAM9/DPP4/CCL5/CCL5 | 9 |
| GO:0042117 | monocyte activation | 9/3662 | 17/15509 | 0.00835376 | 0.0279119 | 0.0167857 | HYAL2/CD33/FN1/ADAM9/CSF1/LILRB4/LILRB4/LILRB4/LILRB4 | 9 |
| GO:0043374 | CD8-positive, alpha-beta T cell differentiation | 9/3662 | 17/15509 | 0.00835376 | 0.0279119 | 0.0167857 | RUNX3/CBFB/TNFSF8/RUNX1/SOCS1/LILRB4/LILRB4/LILRB4/LILRB4 | 9 |
| GO:0045346 | regulation of MHC class II biosynthetic process | 9/3662 | 17/15509 | 0.00835376 | 0.0279119 | 0.0167857 | SPI1/XBP1/IFNG/IL4/IL10/TLR4/PF4/TAF7/CIITA | 9 |
| GO:0055093 | response to hyperoxia | 9/3662 | 17/15509 | 0.00835376 | 0.0279119 | 0.0167857 | NOX1/FAS/MMP2/PDGFRB/CAT/EPO/CYP1A1/FOXO1/ATG7 | 9 |
| GO:0070102 | interleukin-6-mediated signaling pathway | 9/3662 | 17/15509 | 0.00835376 | 0.0279119 | 0.0167857 | SPI1/IL6/SMAD4/IL6R/JAK1/GFI1/PTPN2/SRC/CEBPA | 9 |
| GO:0070935 | 3'-UTR-mediated mRNA stabilization | 9/3662 | 17/15509 | 0.00835376 | 0.0279119 | 0.0167857 | ELAVL1/HNRNPC/LARP4B/MAPK14/TARDBP/ZFP36/MAPKAPK2/ANGEL2/RBM10 | 9 |
| GO:0090715 | immunological memory formation process | 9/3662 | 17/15509 | 0.00835376 | 0.0279119 | 0.0167857 | ST3GAL1/IL12RB1/IL12B/BCL6/HLA-DRA/HLA-DRA/HLA-DRA/HLA-DRA/HLA-DRA | 9 |
| GO:1902430 | negative regulation of amyloid-beta formation | 9/3662 | 17/15509 | 0.00835376 | 0.0279119 | 0.0167857 | IGF1/ROCK1/CLU/PIN1/APOE/RTN3/SORL1/RTN1/NTRK2 | 9 |
| GO:1990822 | basic amino acid transmembrane transport | 9/3662 | 17/15509 | 0.00835376 | 0.0279119 | 0.0167857 | SLC11A1/SLC25A15/SLC7A6/SLC15A4/SLC7A1/SLC47A1/SLC38A9/CLN3/SLC25A29 | 9 |
| GO:0019439 | aromatic compound catabolic process | 119/3662 | 414/15509 | 0.00841417 | 0.0280986 | 0.016898 | UPF1/PON1/SLC11A1/RNH1/ABCC2/RNASET2/TNFRSF1B/ZCCHC8/EDC4/PUM2/NTHL1/PDE4A/ELAVL1/ROCK1/SMG6/MLH1/TUT7/BAX/XRN2/FUS/ALKBH5/HNRNPC/AGO1/COMT/ACOT7/CIRBP/CECR2/ZC3H14/APEX1/ABCC1/POP1/RNASEH2A/DDX49/GSK3A/SMG9/AMBP/EXOSC3/TRDMT1/LARP4B/CASC3/DDX5/ZPR1/SLCO1B3/AICDA/MAPK14/PDE8B/PDE4D/XRN1/NT5C1A/SLIRP/NRDE2/EPHX2/TARDBP/CNOT1/ITPA/ZFP36/ZC3H4/DKC1/GRSF1/NT5E/IL6/TTC5/NCBP1/TET1/TDG/CYP1A1/NUDT7/TOB1/EIF4A3/EPHX1/POLR2D/CNOT9/QDPR/ZFP36L2/CARHSP1/PRKCA/CNOT11/ZC3H18/BTG2/PDE9A/MAPKAPK2/PRKCD/FASTK/VCP/NUDT5/HINT1/PDE7B/EXOSC10/PAIP1/SUCLG2/DCP2/CNP/ANGEL2/PDE12/ERN1/DCTPP1/NPM1/RBM10/PDE4B/ZFP36L1/YTHDF3/TET3/SECISBP2/DPYD/MAOA/ENTPD4/ENTPD7/PNP/SMG5/GIGYF2/DXO/LSM2/NUDT19/GAS5/PDXP/RBM8A/NUDT3/TAF15/ABCC1 | 119 |
| GO:0009167 | purine ribonucleoside monophosphate metabolic process | 17/3662 | 41/15509 | 0.00846485 | 0.0282222 | 0.0169724 | AK2/GMPR2/PRPS2/AK1/AMPD2/NT5C1A/PAICS/PPAT/NT5E/GUK1/AK3/GART/AK4/ADSS1/PNP/ADSL/GMPR2 | 17 |
| GO:0061383 | trabecula morphogenesis | 17/3662 | 41/15509 | 0.00846485 | 0.0282222 | 0.0169724 | RHOA/MMP2/FKBP1A/BMP7/SFRP1/TGFBR1/ENG/BMPR1A/FHL2/TEK/FBN2/NOTCH1/ADAMTS1/RBPJ/S1PR1/NKX2-5/NOG | 17 |
| GO:1900274 | regulation of phospholipase C activity | 17/3662 | 41/15509 | 0.00846485 | 0.0282222 | 0.0169724 | SELE/FGFR1/ESR1/ABL1/FLT1/PDGFRB/CD86/PDGFRA/PLCB2/FGF2/ABL2/EGFR/BICD1/GNAQ/KIT/PTAFR/HRAS | 17 |
| GO:0045833 | negative regulation of lipid metabolic process | 34/3662 | 98/15509 | 0.00849103 | 0.0282943 | 0.0170157 | SNAI2/ACADVL/PIBF1/PIK3IP1/PDGFB/PIK3CG/CYP27B1/PDE8B/ORMDL2/IL1B/BMP2/APOE/PRKAA1/SORL1/ASXL3/SOD1/ERLIN2/WNT4/GFI1/ATP1A1/GPER1/ALK/ORMDL3/KLHL25/AKR1C3/TNF/TNF/TNF/TNF/TNF/TNF/TNF/TNF/PIP4K2B | 34 |
| GO:0002062 | chondrocyte differentiation | 36/3662 | 105/15509 | 0.00850556 | 0.0283275 | 0.0170357 | HOXA11/SCIN/SNAI2/RUNX3/FGFR3/GLG1/SMAD7/SLC39A14/TGFB1/TGFBR1/BMPR1A/ZBTB16/MDK/WNT5B/MAPK14/SNX19/RUNX2/BMP2/TWSG1/LOXL2/ADAMTS7/CCN3/COL2A1/RB1/SERPINH1/HMGA2/BMP6/RUNX1/TGFBR2/EIF2AK3/RARG/MAF/PTPN11/CREB3L2/RFLNB/COL27A1 | 36 |
| GO:0000723 | telomere maintenance | 45/3662 | 137/15509 | 0.00859497 | 0.0286099 | 0.0172055 | UPF1/PARP3/RAD51/SP100/SMG6/SIRT6/XRCC5/ATRX/MAPKAPK5/HNRNPC/HSP90AB1/TFIP11/APEX1/NBN/CCNE1/RAD50/XRN1/INO80D/SLF2/SHLD2/POT1/DKC1/HNRNPA1/CCT7/SMARCAL1/NABP2/BRCA2/PIF1/PARP1/TERT/CCT2/EXOSC10/DCP2/CCNE2/AURKB/MAPK15/NOP10/USP7/SRC/DCLRE1A/SMG5/PRKDC/TEN1/RTEL1/TINF2 | 45 |
| GO:0030500 | regulation of bone mineralization | 27/3662 | 74/15509 | 0.00862432 | 0.0286922 | 0.017255 | LTF/ZMPSTE24/TXLNG/P2RX7/BMP7/GATA1/TGFB1/PTN/BMPR1A/CYP27B1/VDR/PTK2B/SRGN/BMP2/TFAP2A/FBN2/CCN1/BMP6/WNT4/ADRB2/S1PR1/FAM20C/SLC8A1/RFLNB/NOTUM/FZD9/RXRB | 27 |
| GO:0006826 | iron ion transport | 21/3662 | 54/15509 | 0.00868584 | 0.0288504 | 0.0173501 | HFE/LTF/SLC11A1/SLC46A1/FTL/SLC22A17/SLC39A14/HAMP/TFR2/HPX/SLC11A2/IFNG/ISCU/IREB2/SLC25A37/LCN2/STEAP2/MELTF/SFXN1/FTH1/B2M | 21 |
| GO:0010812 | negative regulation of cell-substrate adhesion | 21/3662 | 54/15509 | 0.00868584 | 0.0288504 | 0.0173501 | RHOA/FBLN1/ANGPT2/SERPINE1/CORO1C/BCL6/MEN1/THBS1/TBCD/PIK3R1/NOTCH1/MMP14/DMTN/MELTF/SEMA3E/FZD4/RCC2/NF2/SPRY4/SRC/PTEN | 21 |
| GO:1900024 | regulation of substrate adhesion-dependent cell spreading | 21/3662 | 54/15509 | 0.00868584 | 0.0288504 | 0.0173501 | PKP2/CDC42/ST6GAL1/FBLN1/ABL1/OLFM4/C1QBP/MDK/CORO1C/NEDD9/DMTN/MELTF/PTK2/LIMS1/FGG/FGA/RCC2/CALR/CIB1/SPRY4/ITGB3 | 21 |
| GO:0034655 | nucleobase-containing compound catabolic process | 104/3662 | 357/15509 | 0.00875988 | 0.0290807 | 0.0174886 | UPF1/SLC11A1/RNH1/RNASET2/TNFRSF1B/ZCCHC8/EDC4/PUM2/NTHL1/PDE4A/ELAVL1/ROCK1/SMG6/MLH1/TUT7/BAX/XRN2/FUS/ALKBH5/HNRNPC/AGO1/ACOT7/CIRBP/CECR2/ZC3H14/APEX1/POP1/RNASEH2A/DDX49/GSK3A/SMG9/EXOSC3/TRDMT1/LARP4B/CASC3/DDX5/ZPR1/AICDA/MAPK14/PDE8B/PDE4D/XRN1/NT5C1A/SLIRP/NRDE2/TARDBP/CNOT1/ITPA/ZFP36/ZC3H4/DKC1/GRSF1/NT5E/IL6/TTC5/NCBP1/TDG/NUDT7/TOB1/EIF4A3/POLR2D/CNOT9/ZFP36L2/CARHSP1/PRKCA/CNOT11/ZC3H18/BTG2/PDE9A/MAPKAPK2/PRKCD/FASTK/VCP/NUDT5/HINT1/PDE7B/EXOSC10/PAIP1/SUCLG2/DCP2/CNP/ANGEL2/PDE12/ERN1/DCTPP1/NPM1/RBM10/PDE4B/ZFP36L1/YTHDF3/SECISBP2/DPYD/ENTPD4/ENTPD7/PNP/SMG5/GIGYF2/DXO/LSM2/NUDT19/GAS5/RBM8A/NUDT3/TAF15 | 104 |
| GO:1902459 | positive regulation of stem cell population maintenance | 16/3662 | 38/15509 | 0.00884885 | 0.0293604 | 0.0176568 | ARID4B/BICRA/TP63/ACTB/KDM2B/BCL7C/SMARCB1/RBBP7/BCL7A/HDAC1/ARID1A/TET1/OGT/RBBP4/SAP30/SMARCB1 | 16 |
| GO:0045814 | negative regulation of gene expression, epigenetic | 29/3662 | 81/15509 | 0.00893425 | 0.0296142 | 0.0178095 | KDM1A/SPI1/SIRT2/MBD3/SIRT6/AXIN1/DOT1L/EZH2/EZH1/AICDA/FAM172A/MACROH2A1/HDAC1/DNMT3A/HELLS/DNMT1/PPHLN1/TET1/RB1/HMGA2/SMARCA5/CTBP1/LMNA/H3-3A/PPM1D/H1-0/HMGB1/PHF2/L3MBTL3 | 29 |
| GO:0045165 | cell fate commitment | 77/3662 | 255/15509 | 0.00893491 | 0.0296142 | 0.0178095 | WNT16/HOXA11/IFRD1/PAF1/FOXP3/PRDM1/FGFR2/RHOA/PITX1/CDC42/TCF3/MBD3/TBX21/GLI2/NOTCH3/RAB10/IL12RB1/RBBP7/GATA1/EYA1/SFRP1/ESRP1/IL7/TGFBR1/GATA3/BMPR1A/DKK1/WNT3/WNT5B/CHD4/IL12B/SMAD5/WNT5A/HES1/ID2/EPAS1/PRRX1/HDAC1/RUNX2/NKX2-2/BMP2/BCL11B/KDR/MNX1/RARA/NOTCH2/APC/SPRY2/IL6/NKX2-1/IRF4/FGF2/SMAD4/NOTCH1/TCF7L2/ITGB1/POU4F1/NODAL/ISL2/IL6R/TAL1/RBBP4/WNT4/CASP3/SHH/GATAD2A/RBPJ/RAG2/SMAD2/NKX2-5/POU3F2/WNT7B/MTOR/EBF2/PRKDC/WNT3/WNT3 | 77 |
| GO:0090090 | negative regulation of canonical Wnt signaling pathway | 41/3662 | 123/15509 | 0.0089679 | 0.0297077 | 0.0178657 | SNAI2/PTPRU/GSK3B/CHD8/FERMT1/AXIN1/SFRP1/TLE5/GSK3A/SFRP4/DKK1/MDK/MAPK14/NPHP3/WNT5A/IGFBP2/HDAC1/FOXO3/SFRP5/EGR1/PFDN5/BMP2/APOE/LRP4/APC/RBMS3/TPBG/NOTCH1/TCF7L2/FOXO1/FRZB/SHH/AMER2/CDH2/FZD4/DDIT3/CTNNBIP1/NKX2-5/NOG/NOTUM/PRKN | 41 |
| GO:1901361 | organic cyclic compound catabolic process | 125/3662 | 438/15509 | 0.00901497 | 0.0298476 | 0.0179498 | UPF1/SLC11A1/RNH1/ABCC2/RNASET2/TNFRSF1B/ZCCHC8/EDC4/PUM2/NTHL1/PDE4A/ELAVL1/ROCK1/SMG6/MLH1/TUT7/BAX/XRN2/FUS/ALKBH5/HNRNPC/AGO1/COMT/ACOT7/CIRBP/CECR2/ZC3H14/APEX1/ABCC1/POP1/RNASEH2A/DDX49/GSK3A/SMG9/AMBP/EXOSC3/TRDMT1/LARP4B/CASC3/DDX5/ZPR1/CYP27B1/SLCO1B3/AICDA/MAPK14/PDE8B/PDE4D/XRN1/SNX17/NT5C1A/SPP1/SLIRP/NRDE2/EPHX2/TARDBP/CNOT1/ITPA/ZFP36/YWHAH/APOE/ZC3H4/DKC1/GRSF1/NT5E/IL6/TTC5/NCBP1/CYP19A1/TET1/TDG/CYP1A1/CYP1A2/NUDT7/TOB1/EIF4A3/POLR2D/CNOT9/QDPR/ZFP36L2/CARHSP1/PRKCA/CNOT11/ZC3H18/BTG2/PDE9A/CYP3A4/MAPKAPK2/PRKCD/FASTK/VCP/NUDT5/HINT1/PDE7B/EXOSC10/PAIP1/SUCLG2/DCP2/CNP/ANGEL2/PDE12/ERN1/DCTPP1/NPM1/RBM10/PDE4B/ZFP36L1/YTHDF3/TET3/SECISBP2/DPYD/MAOA/ENTPD4/ENTPD7/PNP/SMG5/GIGYF2/DXO/LSM2/NUDT19/GAS5/PDXP/RBM8A/NUDT3/TAF15/ABCC1 | 125 |
| GO:0055074 | calcium ion homeostasis | 86/3662 | 289/15509 | 0.00905813 | 0.0299745 | 0.0180261 | BAK1/CASR/HEXB/HERPUD1/CYBA/ATP2B4/PRKACA/PTPRC/BAX/FKBP1A/P2RX7/ABL1/KCTD17/CD40/ZNHIT1/CXCL12/CDH23/CCDC47/CALCA/CYP27B1/VDR/PDE4D/WNT5A/FASLG/PKD2/PTK2B/TRIM24/TMTC4/SLC25A23/CCR7/TRPV5/KDR/TNNI3/APOE/C19orf12/IMMT/NT5E/CCL21/FGF2/TMBIM6/APP/SYPL2/TMCO1/CALM2/ANK2/GSTO1/ITPR1/SLC24A2/STC1/CALM3/CCR5/SELENON/DISC1/GPER1/TRPV6/STIM1/LETM1/PRKCE/CCL11/CCL19/ATP2A2/DDIT3/GRIN1/CD19/GRINA/CALR/F2/F2R/SLC8A1/SMDT1/TMEM203/CLN3/FZD9/TRPV1/ELANE/TGM2/FIS1/ITGB3/PTPRC/CCL5/CCL5/TRPV5/TRPV6/ELANE/RASA3/PRKACA | 86 |
| GO:0048762 | mesenchymal cell differentiation | 70/3662 | 229/15509 | 0.00907714 | 0.0300186 | 0.0180527 | WNT16/IGF1/SNAI2/HGF/EPHA3/FGFR2/ROCK1/CDC42/FGFR1/GSK3B/BMP7/SMAD7/SFRP1/TGFB1/EZH2/TGFBR1/AKNA/ENG/GATA3/BMPR1A/DDX5/FOLR1/MDK/CORO1C/FAM172A/PPP2CA/WNT5A/HES1/FN1/STAT1/NRP2/IL1B/BMP2/ALDH1A2/LAMA5/LOXL2/SPRY2/EDNRB/IL6/NKX2-1/SMAD4/NOTCH1/TCF7L2/HMGA2/ADIPOR1/WNT4/FRZB/TGFBR2/HEYL/PITX2/RANBP3L/SHH/RBPJ/SEMA4C/EFNA1/PTK2/SEMA3E/CDH2/DAG1/SMAD2/RFLNB/NOG/ZNF703/BCL9L/SPRED2/MTOR/MCRIP1/PDCD6/LRP6/PTEN | 70 |
| GO:0032211 | negative regulation of telomere maintenance via telomerase | 10/3662 | 20/15509 | 0.00911989 | 0.0300186 | 0.0180527 | HNRNPC/XRN1/POT1/HNRNPA1/PIF1/EXOSC10/DCP2/SRC/TEN1/TINF2 | 10 |
| GO:0034390 | smooth muscle cell apoptotic process | 10/3662 | 20/15509 | 0.00911989 | 0.0300186 | 0.0180527 | IGF1/MAP2K4/APOH/IFNG/IL12B/MFN2/DNMT1/ARRB2/RBM10/LRP6 | 10 |
| GO:0034391 | regulation of smooth muscle cell apoptotic process | 10/3662 | 20/15509 | 0.00911989 | 0.0300186 | 0.0180527 | IGF1/MAP2K4/APOH/IFNG/IL12B/MFN2/DNMT1/ARRB2/RBM10/LRP6 | 10 |
| GO:0044346 | fibroblast apoptotic process | 10/3662 | 20/15509 | 0.00911989 | 0.0300186 | 0.0180527 | BAK1/TP63/STK17B/CHD8/SFRP1/PIK3CG/BTG1/BCL2L11/CASP3/STK17A | 10 |
| GO:0046823 | negative regulation of nucleocytoplasmic transport | 10/3662 | 20/15509 | 0.00911989 | 0.0300186 | 0.0180527 | SP100/SIRT6/RANGAP1/FERMT1/PARK7/NUP153/CD36/MDFIC/CDK5/PKIG | 10 |
| GO:0050686 | negative regulation of mRNA processing | 10/3662 | 20/15509 | 0.00911989 | 0.0300186 | 0.0180527 | PTBP1/ZC3H14/C1QBP/SRSF9/SRSF7/SRSF4/RBM42/RBMX/NPM1/RBM10 | 10 |
| GO:0050765 | negative regulation of phagocytosis | 10/3662 | 20/15509 | 0.00911989 | 0.0300186 | 0.0180527 | FCGR2B/CSK/SYT11/APPL1/ADIPOQ/PLSCR1/HMGB1/PRTN3/CD47/PRTN3 | 10 |
| GO:0071450 | cellular response to oxygen radical | 10/3662 | 20/15509 | 0.00911989 | 0.0300186 | 0.0180527 | MPO/GLRX2/BMP7/PRDX1/CD36/SOD1/FANCC/NOS3/PRDX2/NQO1 | 10 |
| GO:0071451 | cellular response to superoxide | 10/3662 | 20/15509 | 0.00911989 | 0.0300186 | 0.0180527 | MPO/GLRX2/BMP7/PRDX1/CD36/SOD1/FANCC/NOS3/PRDX2/NQO1 | 10 |
| GO:0043279 | response to alkaloid | 31/3662 | 88/15509 | 0.00912945 | 0.0300247 | 0.0180563 | PPP5C/HSPA5/RAD51/OPRK1/HSP90AB1/GPI/RECQL5/EFTUD2/SRSF9/HES1/DNMT3A/PTK2B/CXCR4/FOSB/PRKAA1/ST8SIA2/CCNA2/SELENON/PEA15/CASP3/CDK5/FADD/PRKCE/BCL2L1/OXTR/NQO1/SLC8A1/TRPV1/ND6/TGM2/GPI | 31 |
| GO:0071248 | cellular response to metal ion | 57/3662 | 181/15509 | 0.00913142 | 0.0300247 | 0.0180563 | HFE/CDH1/HSPA5/RASGRP2/SLC25A24/ADD1/MMP9/GSK3A/TFR2/MAPK8/PPIF/WNT5A/PKD2/SLC25A23/FOSB/BECN1/PRKAA1/SYT11/TFAP2A/CARF/CYP1A1/CYP1A2/SOD1/APP/KCNH1/PARP1/SYT2/EGFR/ALAD/BMP6/DMTN/ALOX15/INHBB/SHH/ADCY1/CYBB/CHP2/FOS/NPTX1/EIF2AK3/LIG4/JUN/KCNJ10/CALR/NQO1/PRKN/AKR1C3/CACNA1H/DAXX/DAXX/CHUK/CPNE1/DAXX/DAXX/DAXX/CEBPA/B2M | 57 |
| GO:1903311 | regulation of mRNA metabolic process | 74/3662 | 244/15509 | 0.00914864 | 0.0300654 | 0.0180808 | UPF1/PAF1/PTBP1/SLC11A1/PUM2/ELAVL1/ROCK1/DAZAP1/MLH1/MBNL3/TUT7/FUS/ALKBH5/HNRNPC/CIRBP/RBFOX2/ZC3H14/APEX1/SNRNP70/EXOSC3/LARP4B/CASC3/C1QBP/DDX5/HSPA8/SRSF9/MAPK14/FAM172A/NCL/SRSF7/SRSF4/PRDX6/TARDBP/SMU1/CNOT1/RBM42/ZFP36/SRPK2/HNRNPA1/TTC5/NCBP1/SLTM/TOB1/EIF4A3/SF3B4/POLR2D/CNOT9/WTAP/RBMX/ZFP36L2/MBNL1/CARHSP1/PRKCA/CNOT11/BTG2/RBM15/MAPKAPK2/PRKCD/FASTK/AHCYL1/PAIP1/DCP2/ANGEL2/LARP7/PDE12/NPM1/RBM10/ZFP36L1/YTHDF3/SECISBP2/GIGYF2/RBM15B/RBM8A/TAF15 | 74 |
| GO:0032205 | negative regulation of telomere maintenance | 15/3662 | 35/15509 | 0.00919038 | 0.0301227 | 0.0181153 | SMG6/HNRNPC/NBN/RAD50/XRN1/POT1/HNRNPA1/PIF1/PARP1/EXOSC10/DCP2/SRC/TEN1/RTEL1/TINF2 | 15 |
| GO:0032620 | interleukin-17 production | 15/3662 | 35/15509 | 0.00919038 | 0.0301227 | 0.0181153 | BTK/FOXP3/ARG2/OSM/IL27RA/TGFB1/IFNG/IL12B/IL6/TLR4/IL21/IL18/NOD2/DDIT3/CARD9 | 15 |
| GO:0032660 | regulation of interleukin-17 production | 15/3662 | 35/15509 | 0.00919038 | 0.0301227 | 0.0181153 | BTK/FOXP3/ARG2/OSM/IL27RA/TGFB1/IFNG/IL12B/IL6/TLR4/IL21/IL18/NOD2/DDIT3/CARD9 | 15 |
| GO:0043368 | positive T cell selection | 15/3662 | 35/15509 | 0.00919038 | 0.0301227 | 0.0181153 | CD74/FOXP3/TBX21/PTPRC/IL12RB1/IL12B/ZAP70/BCL11B/IL6/IRF4/IL6R/SHH/PTPN2/MTOR/PTPRC | 15 |
| GO:2000406 | positive regulation of T cell migration | 15/3662 | 35/15509 | 0.00919038 | 0.0301227 | 0.0181153 | RHOA/ABL1/PYCARD/CXCL12/WNT5A/CCL20/ITGA4/CCL21/APP/ABL2/CXCL13/FADD/ITGB3/CCL5/CCL5 | 15 |
| GO:0089718 | amino acid import across plasma membrane | 20/3662 | 51/15509 | 0.00927851 | 0.0303634 | 0.01826 | SLC7A8/SLC1A5/ARG1/PER2/SLC7A1/SLC47A1/ARL6IP5/SLC16A2/ITGB1/SLC43A2/SLC3A2/KCNJ10/TNF/TNF/TNF/TNF/TNF/TNF/TNF/TNF | 20 |
| GO:1903053 | regulation of extracellular matrix organization | 20/3662 | 51/15509 | 0.00927851 | 0.0303634 | 0.01826 | TNFRSF1B/TIE1/ABL1/LAMA1/TGFB1/LRP1/BMP2/COLGALT1/LAMC1/IL6/RB1/NOTCH1/RUNX1/MELTF/ANTXR1/LAMB2/DAG1/SLC2A10/DPP4/ITGB3 | 20 |
| GO:1904036 | negative regulation of epithelial cell apoptotic process | 20/3662 | 51/15509 | 0.00927851 | 0.0303634 | 0.01826 | ICAM1/ABL1/SERPINE1/GATA3/MDK/IL4/TNFAIP3/TEK/KDR/PRKAA1/RB1/IGF1R/TCF7L2/CAST/TERT/TNIP2/FGG/FGA/SCG2/NKX2-5 | 20 |
| GO:0010817 | regulation of hormone levels | 136/3662 | 481/15509 | 0.00931165 | 0.0304543 | 0.0183147 | BAD/CD38/CRY1/BTK/HFE/CASR/RETSAT/H6PD/NNAT/KCNQ1/SIRT6/OPRK1/OXCT1/ZMPSTE24/RAPGEF4/ESR1/SLC7A8/OSM/CYP2D6/CTSG/DHRS2/PCK2/SFRP1/SLC39A14/BCAT2/CYP3A5/TFR2/GATA3/PPP3CB/PSMD9/CYP27B1/IFNG/PPARD/PDE8B/SNX4/CHST10/PASK/PARK7/KDM5B/VAMP8/SPP1/CRHR1/SNX19/EGR1/SERP1/CRY2/INHBA/SOX4/IL1B/BMP2/NR1D1/LIF/ALDH1A2/PER2/HSD17B4/PDGFRA/HNF1A/GLUL/EDNRB/IL6/IL1RN/CCN3/FDX1/CYP19A1/CYP1B1/ENPEP/IGF1R/CYP1A1/CYP1A2/FURIN/SMAD4/CRABP2/ENSA/ARNT/REN/EPHA5/CORIN/SLC16A2/CAMK2G/GLUD1/TCF7L2/FOXO1/GJA1/BMP6/CHST9/CYP3A4/WNT4/GFI1/INHBB/ATP1A1/AIMP1/SLC9B2/GDF9/SHH/GPER1/TRPV6/CCDC186/DHRS13/PRKCE/FGG/FGA/STAT5B/BRSK2/LEP/FZD4/SMAD2/PTPN11/ADIPOQ/MAFA/PRKN/CYP27C1/KCNJ11/AKR1C3/MME/CACNA1H/DPP4/PIM3/SELENOT/TNF/TNF/TNF/TNF/TNF/TNF/TNF/TNF/RASL10B/CCL5/CYP2D6/CCL5/CYP2D6/TRPV6/TPO/CYP2D6/CYP2D6/CYP2D6 | 136 |
| GO:0010469 | regulation of signaling receptor activity | 49/3662 | 152/15509 | 0.00931614 | 0.0304543 | 0.0183147 | MAPK8IP2/HFE/RASGRF1/FCGR2B/SERPINE1/DKK1/CCL2/AREG/IFNG/HBEGF/PDE4D/PARK7/HDAC1/DLGAP3/PTK2B/VPS25/EPHB2/IL10/IL18BP/EGF/APP/NCAPG2/ITGB1/BICD1/SHC1/PRKCD/ADRB2/NPTX1/CHMP6/PHLDA2/NOG/ADRA2C/LILRB4/DAPK1/SRC/TNF/TNF/NPTXR/TNF/TNF/TNF/TNF/TNF/TNF/SHISA8/SHANK3/LILRB4/LILRB4/LILRB4 | 49 |
| GO:0050818 | regulation of coagulation | 26/3662 | 71/15509 | 0.00933022 | 0.0304843 | 0.0183327 | CD9/F7/APOH/PDGFB/PROCR/PLAT/SERPINE1/SH2B3/SERPINC1/APOE/EPHB2/PDGFRA/CD36/SERPINE2/THBS1/ADAMTS18/DMTN/PRKCD/ANXA5/NOS3/PRDX2/FGG/FGA/F2/F2R/ANXA2 | 26 |
| GO:0035051 | cardiocyte differentiation | 44/3662 | 134/15509 | 0.00934591 | 0.0304877 | 0.0183347 | IGF1/MAP2K4/CDC42/SIRT6/ACTN2/ZMPSTE24/NOX4/BMP7/TGFB1/HAMP/GSK3A/BMPR1A/DKK1/FOLR1/BVES/PDGFRB/HES1/FHL2/INHBA/OBSL1/BMP2/RARA/MYH11/PDGFRA/ARRB2/SMAD4/EGFR/NOTCH1/ITGB1/LMNA/MAML1/VCAM1/PDLIM5/PITX2/GPER1/FRS2/RBPJ/CDK1/PLEC/CALR/SLC8A1/NKX2-5/MTOR/MYH11 | 44 |
| GO:0051592 | response to calcium ion | 44/3662 | 134/15509 | 0.00934591 | 0.0304877 | 0.0183347 | BAD/CASR/HSPA5/RASGRP2/SLC25A24/ADD1/P2RX7/PPIF/CCND1/WNT5A/SDC1/TNNT2/PKD2/PTK2B/SLC25A23/FOSB/PRKAA1/SYT11/THBS1/CARF/KCNH1/SYT2/CALM2/DMTN/CALM3/ALOX15/INHBB/ADCY1/TRPV6/AQP3/CHP2/STIM1/ADAM9/AHCYL1/FOS/FGG/FGA/JUN/AKR1C3/GDI1/CPNE1/PDCD6/TXNIP/TRPV6 | 44 |
| GO:0009141 | nucleoside triphosphate metabolic process | 71/3662 | 233/15509 | 0.00934601 | 0.0304877 | 0.0183347 | BAD/AK2/SLC4A1/IGF1/PKM/RHOA/SIRT6/DNM1L/P2RX7/GPI/TGFB1/AK1/ENO3/ALDOC/NDUFC1/HSPA8/IFNG/IL4/ATP6V1A/ATP5PB/NDUFA8/ITPA/CBFA2T3/PRKAA1/NT5E/OLA1/APP/ARNT/PKLR/PARP1/NDUFS6/OGT/ATP6V1B2/NDUFB9/AK3/NDUFC2/AK5/ATP5MC3/NDUFS2/NDUFV3/SLC2A6/CMPK1/AK4/VCP/NUDT5/LDHC/ATP5MG/GPD1/NDUFV1/DDIT4/NDUFS5/ATP5ME/PGAM1/ATP5MK/DNAJC30/TYMS/DCTPP1/ENTPD4/ENTPD7/ND6/MTOR/TMSB4X/ND4L/NDUFS3/FIS1/NME1/ATP5MF/EIF6/PKLR/GPI/LDHA | 71 |
| GO:0071466 | cellular response to xenobiotic stimulus | 52/3662 | 163/15509 | 0.00944509 | 0.0307947 | 0.0185194 | ABCC2/HSPA5/KCNQ1/KCNH2/PDE4A/ABCB1/CYP2D6/ABCC1/CYP3A5/AHR/RECQL5/ABCC3/EFTUD2/SLCO1B3/CXCR4/ABCC4/IL1B/CYP2E1/PRKAA1/GSTM1/TPMT/CYP1B1/RB1/CYP1A1/CYP1A2/GUK1/EPHX1/REN/GSTO1/UCHL1/NAT2/CBR3/CYP3A4/RNF149/TLR3/CYP2C19/MCM7/NAT1/CES3/GRIN1/NQO1/ADIPOQ/CHEK2/PDE4B/CYP2B6/ITGB3/CYP2D6/CYP2D6/ABCC1/CYP2D6/CYP2D6/CYP2D6 | 52 |
| GO:0007004 | telomere maintenance via telomerase | 23/3662 | 61/15509 | 0.00949483 | 0.0308756 | 0.0185681 | SMG6/XRCC5/MAPKAPK5/HNRNPC/HSP90AB1/RAD50/XRN1/POT1/DKC1/HNRNPA1/CCT7/PIF1/TERT/CCT2/EXOSC10/DCP2/AURKB/MAPK15/NOP10/SRC/SMG5/TEN1/TINF2 | 23 |
| GO:0010660 | regulation of muscle cell apoptotic process | 23/3662 | 61/15509 | 0.00949483 | 0.0308756 | 0.0185681 | IGF1/MAP2K4/APOH/BMP7/MDK/IFNG/IL12B/MFN2/PTK2B/SIRT5/DNMT1/IGF1R/ARRB2/SMAD4/POU4F2/BAG3/CAPN2/ATP2A2/CXCR2/RBM10/NKX2-5/MAP3K5/LRP6 | 23 |
| GO:0048247 | lymphocyte chemotaxis | 23/3662 | 61/15509 | 0.00949483 | 0.0308756 | 0.0185681 | CCL22/CCL17/PIK3CG/CCL2/NEDD9/WNT5A/CCL20/PADI2/PTK2B/CCL21/CXCL13/CCL11/CCL19/CYP7B1/PLEC/CCL5/CCL5/CCL4/CCL18/CCL4/CCL4/CCL18/CCL18 | 23 |
| GO:0050879 | multicellular organismal movement | 23/3662 | 61/15509 | 0.00949483 | 0.0308756 | 0.0185681 | HIPK2/VPS35/MYH14/RPS6KB1/NR4A1/KCNJ2/TNNI3/STAC/GSTO1/ITPR1/VTI1A/TNNI1/STAC3/MTOR/GIGYF2/TNF/TNF/TNF/TNF/TNF/TNF/TNF/TNF | 23 |
| GO:0050881 | musculoskeletal movement | 23/3662 | 61/15509 | 0.00949483 | 0.0308756 | 0.0185681 | HIPK2/VPS35/MYH14/RPS6KB1/NR4A1/KCNJ2/TNNI3/STAC/GSTO1/ITPR1/VTI1A/TNNI1/STAC3/MTOR/GIGYF2/TNF/TNF/TNF/TNF/TNF/TNF/TNF/TNF | 23 |
| GO:0022618 | ribonucleoprotein complex assembly | 58/3662 | 185/15509 | 0.00950218 | 0.0308833 | 0.0185727 | EIF4B/DDX20/XRCC5/DDX1/SF3B2/RPL6/AGO1/HSP90AB1/SNRPD3/SNU13/PRPF6/EIF3J/YJU2/EIF3B/EIF4H/EIF3A/NOP2/SRSF9/BRIX1/SF3B1/PRPF3/PTBP2/COIL/SNRPC/EIF2S2/AAR2/ERAL1/PRMT7/SRPK2/SRSF1/NCBP1/SCAF11/SNRPF/TARBP2/SF3B4/SNRPG/POLR2D/ABT1/LUC7L2/RBMX/EIF3H/EIF3M/RPL10L/SNRPD1/USP39/ZRSR2/SMN1/CLP1/EIF3C/RRP7A/RPL23A/LSM2/PWP2/EIF6/PRKDC/BOP1/SRSF1/PRPF8 | 58 |
| GO:0035739 | CD4-positive, alpha-beta T cell proliferation | 11/3662 | 23/15509 | 0.00953445 | 0.0309072 | 0.018587 | FOXP3/ARG2/CD81/TWSG1/NDFIP1/IL2RA/TGFBR2/LGALS9/CD28/CD55/ITCH | 11 |
| GO:0035872 | nucleotide-binding domain, leucine rich repeat containing receptor signaling pathway | 11/3662 | 23/15509 | 0.00953445 | 0.0309072 | 0.018587 | BIRC3/NFKBIA/MAP2K6/TNFAIP3/PTPN22/TLR4/SLC15A4/NOD2/RELA/LACC1/ITCH | 11 |
| GO:0044321 | response to leptin | 11/3662 | 23/15509 | 0.00953445 | 0.0309072 | 0.018587 | LRP2/CCND1/LEPR/NR4A3/NR1D1/BBS4/CCNA2/UGCG/ADIPOR1/INHBB/LEP | 11 |
| GO:0071243 | cellular response to arsenic-containing substance | 11/3662 | 23/15509 | 0.00953445 | 0.0309072 | 0.018587 | MKNK2/PPIF/HNRNPA1/GSTO1/ATF3/VCP/DAXX/DAXX/DAXX/DAXX/DAXX | 11 |
| GO:2000561 | regulation of CD4-positive, alpha-beta T cell proliferation | 11/3662 | 23/15509 | 0.00953445 | 0.0309072 | 0.018587 | FOXP3/ARG2/CD81/TWSG1/NDFIP1/IL2RA/TGFBR2/LGALS9/CD28/CD55/ITCH | 11 |
| GO:0032368 | regulation of lipid transport | 42/3662 | 127/15509 | 0.00956545 | 0.0309915 | 0.0186377 | PON1/CRY1/P2RX7/NFKBIA/MAP2K6/TMEM30A/IL1A/KDM5B/FASLG/SPP1/CRHR1/CRY2/LRP1/IL1B/APOE/THBS1/CYP19A1/ITGAV/EGF/FURIN/TNFRSF11A/REN/BMP6/LDLRAP1/PRKCD/GDF9/SHH/SYK/ABCA3/PRELID1/TRIAP1/ARV1/LEP/ERFE/PTPN11/ADIPOQ/ANXA2/PRKN/FIS1/YJEFN3/ITGB3/MIF | 42 |
| GO:0006335 | DNA replication-dependent chromatin assembly | 13/3662 | 29/15509 | 0.00964512 | 0.0310815 | 0.0186919 | CHAF1B/RBBP4/CHAF1A/IPO4/H4C15/H4C14/H4C12/H3C6/H4C5/H4C4/H3C10/IPO4/H3C2 | 13 |
| GO:0014044 | Schwann cell development | 13/3662 | 29/15509 | 0.00964512 | 0.0310815 | 0.0186919 | SIRT2/ARHGEF10/CNTNAP1/SOD1/NTRK2/PARD3/SKI/SLC25A46/CDK5/LAMB2/DAG1/PLEC/POU3F2 | 13 |
| GO:0031640 | killing of cells of another organism | 13/3662 | 29/15509 | 0.00964512 | 0.0310815 | 0.0186919 | LTF/P2RX7/LYZ/FCER2/HAMP/IFNG/GNLY/SEMG1/H2BC11/SYK/BCL2L1/PRF1/HMGN2 | 13 |
| GO:0034405 | response to fluid shear stress | 13/3662 | 29/15509 | 0.00964512 | 0.0310815 | 0.0186919 | MMP2/P2RX7/SMAD7/TFPI2/PDGFRB/PKD2/PTK2B/ASS1/SMAD6/CSF2/NOS3/PLEC/SRC | 13 |
| GO:0040036 | regulation of fibroblast growth factor receptor signaling pathway | 13/3662 | 29/15509 | 0.00964512 | 0.0310815 | 0.0186919 | NGFR/PRKD2/GATA3/SMOC2/WNT5A/RUNX2/SPRY2/THBS1/FGF2/WNT4/FAM20C/NOG/SPRY4 | 13 |
| GO:0060390 | regulation of SMAD protein signal transduction | 13/3662 | 29/15509 | 0.00964512 | 0.0310815 | 0.0186919 | TGFB1/TGFBR1/BMPR1A/LRP1/BMP2/CCN3/KIAA0319/TOB1/SMAD4/PARP1/BMP6/NODAL/SLC2A10 | 13 |
| GO:0061384 | heart trabecula morphogenesis | 13/3662 | 29/15509 | 0.00964512 | 0.0310815 | 0.0186919 | FKBP1A/BMP7/TGFBR1/ENG/BMPR1A/FHL2/TEK/NOTCH1/ADAMTS1/RBPJ/S1PR1/NKX2-5/NOG | 13 |
| GO:0000470 | maturation of LSU-rRNA | 12/3662 | 26/15509 | 0.009686 | 0.0310815 | 0.0186919 | RRP15/DDX18/PES1/SNU13/NOP2/RPL7L1/NOL9/NSA2/MRPL1/RPL10A/EIF6/BOP1 | 12 |
| GO:0002433 | immune response-regulating cell surface receptor signaling pathway involved in phagocytosis | 12/3662 | 26/15509 | 0.009686 | 0.0310815 | 0.0186919 | FCGR2B/PTPRC/ABL1/HCK/APPL1/PRKCD/SYK/PTK2/PRKCE/CD47/SRC/PTPRC | 12 |
| GO:0002862 | negative regulation of inflammatory response to antigenic stimulus | 12/3662 | 26/15509 | 0.009686 | 0.0310815 | 0.0186919 | FCGR2B/MKRN2/HCK/MAPK14/IL12B/IL10/FURIN/PLK2/PSMB4/SYK/NOD2/SRC | 12 |
| GO:0003085 | negative regulation of systemic arterial blood pressure | 12/3662 | 26/15509 | 0.009686 | 0.0310815 | 0.0186919 | CALCA/BBS4/ADRB2/TRPV1/TNF/TNF/TNF/TNF/TNF/TNF/TNF/TNF | 12 |
| GO:0035116 | embryonic hindlimb morphogenesis | 12/3662 | 26/15509 | 0.009686 | 0.0310815 | 0.0186919 | ALX4/PITX1/TP63/RPGRIP1L/WNT3/ZBTB16/AFF3/NOTCH1/SHH/RARG/WNT3/WNT3 | 12 |
| GO:0035994 | response to muscle stretch | 12/3662 | 26/15509 | 0.009686 | 0.0310815 | 0.0186919 | NFKBIA/GPI/MAPK14/GSN/ANKRD23/PTK2/FOS/CDH2/RELA/JUN/SLC8A1/GPI | 12 |
| GO:0038096 | Fc-gamma receptor signaling pathway involved in phagocytosis | 12/3662 | 26/15509 | 0.009686 | 0.0310815 | 0.0186919 | FCGR2B/PTPRC/ABL1/HCK/APPL1/PRKCD/SYK/PTK2/PRKCE/CD47/SRC/PTPRC | 12 |
| GO:0045070 | positive regulation of viral genome replication | 12/3662 | 26/15509 | 0.009686 | 0.0310815 | 0.0186919 | NR5A2/STAU1/TOP2A/SRPK2/TARBP2/NOTCH1/PDE12/TMEM39A/CD28/PPIA/CCL5/CCL5 | 12 |
| GO:0050926 | regulation of positive chemotaxis | 12/3662 | 26/15509 | 0.009686 | 0.0310815 | 0.0186919 | CASR/F7/ANGPT2/CXCL12/PGF/KDR/VEGFC/CXCL8/S1PR1/SCG2/IL16/CCR4 | 12 |
| GO:1902230 | negative regulation of intrinsic apoptotic signaling pathway in response to DNA damage | 12/3662 | 26/15509 | 0.009686 | 0.0310815 | 0.0186919 | KDM1A/SNAI2/CD74/CD44/TMEM161A/CXCL12/CLU/ZNF385A/TRIAP1/BCL2L1/MUC1/MIF | 12 |
| GO:1903792 | negative regulation of anion transport | 12/3662 | 26/15509 | 0.009686 | 0.0310815 | 0.0186919 | SFRP4/ARL6IP5/SLC43A2/LEP/TNF/TNF/TNF/TNF/TNF/TNF/TNF/TNF | 12 |
| GO:0007091 | metaphase/anaphase transition of mitotic cell cycle | 28/3662 | 78/15509 | 0.00968853 | 0.0310815 | 0.0186919 | CDC27/ARID1B/ACTB/NDC80/ZW10/ANAPC5/BIRC5/CDC6/BCL7C/SMARCB1/SMARCD2/BCL7A/FBXO5/CDC20/ARID1A/TEX14/CCNB1/CDCA8/APC/CENPE/RB1/SPC25/BRD7/BUB1/ZWILCH/AURKB/ARID2/SMARCB1 | 28 |
| GO:0032210 | regulation of telomere maintenance via telomerase | 19/3662 | 48/15509 | 0.00989119 | 0.0316989 | 0.0190631 | SMG6/XRCC5/MAPKAPK5/HNRNPC/XRN1/POT1/DKC1/HNRNPA1/CCT7/PIF1/CCT2/EXOSC10/DCP2/AURKB/MAPK15/SRC/SMG5/TEN1/TINF2 | 19 |
| GO:0071385 | cellular response to glucocorticoid stimulus | 19/3662 | 48/15509 | 0.00989119 | 0.0316989 | 0.0190631 | PCK2/PLAT/GSK3A/RPS6KB1/ARG1/FOXO3/KLF9/FLT3/ZFP36/ASS1/CYP1B1/IGF1R/ZFP36L2/BCL2L11/STC1/DDIT4/SSTR2/ZFP36L1/UBE2L3 | 19 |
| GO:0048024 | regulation of mRNA splicing, via spliceosome | 30/3662 | 85/15509 | 0.00991513 | 0.0317427 | 0.0190895 | PTBP1/DAZAP1/MBNL3/CIRBP/RBFOX2/SNRNP70/C1QBP/DDX5/HSPA8/SRSF9/FAM172A/NCL/SRSF7/SRSF4/PRDX6/SMU1/RBM42/SRPK2/HNRNPA1/NCBP1/SF3B4/WTAP/RBMX/MBNL1/RBM15/LARP7/NPM1/RBM10/RBM15B/RBM8A | 30 |
| GO:1990830 | cellular response to leukemia inhibitory factor | 30/3662 | 85/15509 | 0.00991513 | 0.0317427 | 0.0190895 | XRCC5/ICAM1/MYBL2/SMAD7/BCAT2/NCL/KDM3A/SRSF7/SRM/NR5A2/PADI2/KDM5B/NRP2/HELLS/TRIM25/TEX14/EEF1E1/SPRY2/ARID5B/VEGFC/SMARCA5/EIF4A2/PIGA/RARG/FZD4/CTBP2/SHMT1/CACNB4/PTP4A3/SPRY4 | 30 |
| GO:0046700 | heterocycle catabolic process | 113/3662 | 393/15509 | 0.00992734 | 0.0317654 | 0.0191032 | UPF1/SLC11A1/RNH1/ABCC2/RNASET2/TNFRSF1B/ZCCHC8/EDC4/PUM2/NTHL1/PDE4A/ELAVL1/ROCK1/SMG6/MLH1/TUT7/BAX/XRN2/FUS/ALKBH5/HNRNPC/AGO1/ACOT7/CIRBP/CECR2/ZC3H14/APEX1/ABCC1/POP1/RNASEH2A/DDX49/GSK3A/SMG9/AMBP/EXOSC3/TRDMT1/LARP4B/CASC3/DDX5/ZPR1/SLCO1B3/AICDA/MAPK14/PDE8B/PDE4D/XRN1/NT5C1A/SLIRP/NRDE2/TARDBP/CNOT1/ITPA/ZFP36/ZC3H4/DKC1/GRSF1/NT5E/IL6/TTC5/NCBP1/TET1/TDG/CYP1A1/NUDT7/TOB1/EIF4A3/POLR2D/CNOT9/ZFP36L2/CARHSP1/PRKCA/CNOT11/ZC3H18/BTG2/PDE9A/MAPKAPK2/PRKCD/FASTK/VCP/NUDT5/HINT1/PDE7B/EXOSC10/PAIP1/SUCLG2/DCP2/CNP/ANGEL2/PDE12/ERN1/DCTPP1/NPM1/RBM10/PDE4B/ZFP36L1/YTHDF3/TET3/SECISBP2/DPYD/ENTPD4/ENTPD7/PNP/SMG5/GIGYF2/DXO/LSM2/NUDT19/GAS5/PDXP/RBM8A/NUDT3/TAF15/ABCC1 | 113 |
| GO:0042752 | regulation of circadian rhythm | 36/3662 | 106/15509 | 0.0100137 | 0.0320252 | 0.0192594 | CRY1/BMAL2/PER3/FBXW11/SIRT6/GSK3B/EZH2/MAPK8/ID2/TARDBP/CRY2/USP9X/NR1D1/FBXL12/TOP2A/PER2/PRKAA1/BHLHE40/NKX2-1/CSNK1D/PARP1/NONO/KLF10/GNAQ/NR2F6/CSF2/ADCY1/BTRC/CDK1/KAT5/KDM2A/USP7/ATG7/MTOR/CIPC/PRKDC | 36 |
| GO:0072009 | nephron epithelium development | 34/3662 | 99/15509 | 0.0100597 | 0.0321557 | 0.0193379 | HOXA11/PROM1/EYA1/TMEM59L/GATA3/HES1/STAT1/PKD2/BMP2/LIF/PODXL/FOXJ1/LAMA5/NOTCH2/AHI1/EDNRB/FGF2/GREB1L/SMAD4/ADAMTS16/KLHL3/NOTCH1/WNT4/HEYL/SHH/LAMB2/CTNNBIP1/ADIPOQ/NOG/PBX1/MAGI2/WNT7B/PECAM1/CD24 | 34 |
| GO:0010452 | histone H3-K36 methylation | 7/3662 | 12/15509 | 0.010276 | 0.0326451 | 0.0196322 | NSD2/ASH1L/NSD3/NSD1/SETD5/SETD2/SETD3 | 7 |
| GO:0032927 | positive regulation of activin receptor signaling pathway | 7/3662 | 12/15509 | 0.010276 | 0.0326451 | 0.0196322 | NODAL/SMAD2/CSNK2B/CSNK2B/CSNK2B/CSNK2B/CSNK2B | 7 |
| GO:0036462 | TRAIL-activated apoptotic signaling pathway | 7/3662 | 12/15509 | 0.010276 | 0.0326451 | 0.0196322 | SPI1/PARK7/TNFRSF10B/ATF3/ZDHHC3/FADD/PTEN | 7 |
| GO:0042541 | hemoglobin biosynthetic process | 7/3662 | 12/15509 | 0.010276 | 0.0326451 | 0.0196322 | ALAS1/INHBA/PRMT1/EPO/ABCB10/SLC25A37/ALAS2 | 7 |
| GO:0045060 | negative thymic T cell selection | 7/3662 | 12/15509 | 0.010276 | 0.0326451 | 0.0196322 | CD74/PTPRC/ZAP70/CCR7/SHH/CD28/PTPRC | 7 |
| GO:0046184 | aldehyde biosynthetic process | 7/3662 | 12/15509 | 0.010276 | 0.0326451 | 0.0196322 | PNPO/KDM3A/BMP2/BMP6/WNT4/TKT/CACNA1H | 7 |
| GO:0048672 | positive regulation of collateral sprouting | 7/3662 | 12/15509 | 0.010276 | 0.0326451 | 0.0196322 | WNT3/NGF/CRABP2/LPAR3/BDNF/WNT3/WNT3 | 7 |
| GO:0048711 | positive regulation of astrocyte differentiation | 7/3662 | 12/15509 | 0.010276 | 0.0326451 | 0.0196322 | HES1/ID2/BMP2/LIF/SERPINE2/NOTCH1/SHH | 7 |
| GO:0051255 | spindle midzone assembly | 7/3662 | 12/15509 | 0.010276 | 0.0326451 | 0.0196322 | MLH1/BIRC5/KIF4A/CDCA8/KIF23/AURKB/CCDC69 | 7 |
| GO:0070486 | leukocyte aggregation | 7/3662 | 12/15509 | 0.010276 | 0.0326451 | 0.0196322 | CD44/BMP7/ZAP70/NR4A3/IL1B/RAC2/MSN | 7 |
| GO:1900121 | negative regulation of receptor binding | 7/3662 | 12/15509 | 0.010276 | 0.0326451 | 0.0196322 | HFE/IL10/ATP2A2/ADIPOQ/RGMA/NOG/B2M | 7 |
| GO:1903894 | regulation of IRE1-mediated unfolded protein response | 7/3662 | 12/15509 | 0.010276 | 0.0326451 | 0.0196322 | UFL1/BAK1/HSPA5/BAX/BFAR/TMEM33/BCL2L11 | 7 |
| GO:0043487 | regulation of RNA stability | 46/3662 | 142/15509 | 0.0104499 | 0.0331806 | 0.0199542 | UPF1/SLC11A1/TNFRSF1B/PUM2/ELAVL1/ROCK1/MLH1/TUT7/FUS/ALKBH5/HNRNPC/CIRBP/ZC3H14/APEX1/DDX49/EXOSC3/TRDMT1/LARP4B/MAPK14/TARDBP/CNOT1/ZFP36/DKC1/TOB1/POLR2D/CNOT9/ZFP36L2/CARHSP1/PRKCA/CNOT11/ZC3H18/BTG2/MAPKAPK2/PRKCD/FASTK/PAIP1/DCP2/ANGEL2/PDE12/NPM1/RBM10/ZFP36L1/YTHDF3/GIGYF2/DXO/TAF15 | 46 |
| GO:2000781 | positive regulation of double-strand break repair | 27/3662 | 75/15509 | 0.0105059 | 0.0333415 | 0.020051 | PARP3/ARID1B/ACTB/SIRT6/FUS/BCL7C/SMARCB1/RBBP8/SMARCD2/BCL7A/FOXM1/ARID1A/SLF2/SHLD2/MORF4L2/YEATS4/EPC2/ACTR2/PARP1/MRNIP/BRD7/MGMT/KAT5/ARID2/TRRAP/PRKDC/SMARCB1 | 27 |
| GO:1902905 | positive regulation of supramolecular fiber organization | 49/3662 | 153/15509 | 0.0106309 | 0.0337207 | 0.020279 | SCIN/SPAST/RHOA/NAV3/CDC42/WDR1/ARHGEF10L/ACTN2/PXN/ABL1/HCK/PYCARD/SFRP1/ARHGEF10/MET/TGFBR1/CSF3/CLU/PTK2B/DSTN/ID1/CCR7/CDC42EP1/APOE/COLGALT1/WASF3/PSRC1/CCL21/NUMA1/ABI2/RB1/SLAIN1/APP/GSN/CDC42EP2/ALOX15/WNT4/CDC42EP3/RICTOR/PRKCE/CCL11/CDK5R1/GRB2/DRG1/NF2/CD47/MTOR/PDXP/BRK1 | 49 |
| GO:0009306 | protein secretion | 95/3662 | 325/15509 | 0.0107215 | 0.0339733 | 0.0204309 | BAD/CD38/PAFAH1B1/RHBDF1/IGF1/CASR/NNAT/VPS35/SEL1L/LLGL2/SIRT6/OXCT1/RAB10/ACHE/DNM1L/P2RX7/RAPGEF4/PCK2/PARD6A/SFRP1/KCNN4/OLFM2/TGFB1/CD33/AP1S1/PPP3CB/PSMD9/IFNG/PPARD/APBB3/IL12B/IL1A/PARK7/P3H1/SNX19/SERP1/SOX4/IL1B/NECAB3/NR1D1/APOE/PER2/HNF1A/GLUL/EDNRB/IL6/IL1RN/TLR4/CCN3/ENSA/RAB13/EPHA5/CAMK2G/GLUD1/TCF7L2/VEGFC/FOXO1/BMP6/PDIA4/COPG2/DMTN/INHBB/SLC9B2/ARFIP1/GPER1/CCDC186/ADAM9/PRKCE/FGG/FGA/SCG2/BRSK2/TMEM167A/LEP/SMAD2/SVBP/PTPN11/F2R/MAFA/PRKN/KCNJ11/BLOC1S3/PPIA/PIM3/SELENOT/TNF/TNF/TNF/TNF/TNF/TNF/TNF/TNF/CCL5/CCL5 | 95 |
| GO:0035592 | establishment of protein localization to extracellular region | 95/3662 | 325/15509 | 0.0107215 | 0.0339733 | 0.0204309 | BAD/CD38/PAFAH1B1/RHBDF1/IGF1/CASR/NNAT/VPS35/SEL1L/LLGL2/SIRT6/OXCT1/RAB10/ACHE/DNM1L/P2RX7/RAPGEF4/PCK2/PARD6A/SFRP1/KCNN4/OLFM2/TGFB1/CD33/AP1S1/PPP3CB/PSMD9/IFNG/PPARD/APBB3/IL12B/IL1A/PARK7/P3H1/SNX19/SERP1/SOX4/IL1B/NECAB3/NR1D1/APOE/PER2/HNF1A/GLUL/EDNRB/IL6/IL1RN/TLR4/CCN3/ENSA/RAB13/EPHA5/CAMK2G/GLUD1/TCF7L2/VEGFC/FOXO1/BMP6/PDIA4/COPG2/DMTN/INHBB/SLC9B2/ARFIP1/GPER1/CCDC186/ADAM9/PRKCE/FGG/FGA/SCG2/BRSK2/TMEM167A/LEP/SMAD2/SVBP/PTPN11/F2R/MAFA/PRKN/KCNJ11/BLOC1S3/PPIA/PIM3/SELENOT/TNF/TNF/TNF/TNF/TNF/TNF/TNF/TNF/CCL5/CCL5 | 95 |
| GO:0034644 | cellular response to UV | 29/3662 | 82/15509 | 0.0107693 | 0.0341074 | 0.0205116 | KDM1A/BAK1/USP28/TMEM161A/HYAL2/BAX/MMP2/MMP9/ACTR5/N4BP1/CDKN1A/DDB2/XPA/CUL4A/PARP1/PIK3R1/XPC/CUL4B/RPL26/PRKCD/TP53INP1/TRIAP1/RHNO1/AURKB/NPM1/H2AC25/NOC2L/MME/MMP1 | 29 |
| GO:0031532 | actin cytoskeleton reorganization | 35/3662 | 103/15509 | 0.0108961 | 0.0344912 | 0.0207424 | RHOA/CDC42/ABL1/MYH9/HCK/TJP1/SYDE1/CSF3/MDK/NEDD9/TEK/PTK2B/PDLIM4/NOTCH2/PDGFRA/ARHGDIA/ABL2/IQGAP2/GSN/KIT/DMTN/SHC1/RICTOR/CDK5/ANTXR1/SEMA3E/S1PR1/BRSK2/HRAS/GRB2/PLEC/CSF1R/SIPA1L1/PARVA/TJP1 | 35 |
| GO:0036473 | cell death in response to oxidative stress | 31/3662 | 89/15509 | 0.0109075 | 0.0345005 | 0.020748 | NOX1/HGF/ABL1/GSKIP/MET/HSPB1/PARK7/FOXO3/NR4A3/TRAP1/IL10/TLR4/CYP1B1/MEAK7/SOD1/PARP1/ARL6IP5/NONO/TBC1D24/PRKCD/PRKN/PPIA/MAP3K5/TNF/TNF/TNF/TNF/TNF/TNF/TNF/TNF | 31 |
| GO:0070373 | negative regulation of ERK1 and ERK2 cascade | 24/3662 | 65/15509 | 0.0109101 | 0.0345005 | 0.020748 | RPS6KA6/FBLN1/PTPRC/ABL1/CSK/PIN1/LIF/EPHB2/SPRY2/TLR4/SMAD4/DUSP10/CNKSR3/ATF3/GPER1/NDRG2/RGS14/PTPN2/ADIPOQ/C1QL4/SPRY4/SPRED2/PTPRC/PTEN | 24 |
| GO:0061097 | regulation of protein tyrosine kinase activity | 33/3662 | 96/15509 | 0.0109433 | 0.0345877 | 0.0208004 | MVP/ERBB3/HYAL2/PTPRC/DLG3/NOX4/PDGFB/UNC119/AREG/NEDD9/HBEGF/VPS25/EGF/APP/EGFR/NCAPG2/SHC1/EFNA1/ALK/PTPN2/CHMP6/PAK2/CSF1R/LILRB4/SRC/ITGB3/PTPRC/CCL5/CD24/CCL5/LILRB4/LILRB4/LILRB4 | 33 |
| GO:1905039 | carboxylic acid transmembrane transport | 47/3662 | 146/15509 | 0.0110007 | 0.0347515 | 0.0208989 | SLC11A1/SLC46A1/LRP2/ABCB1/SLC23A2/SLC7A8/SLC25A1/SLC25A14/SLC25A15/SLC38A7/SLC7A6/ABCC1/SLC1A5/SLC25A11/FOLR1/SLC2A1/ARG1/SLC16A7/PER2/CD36/THBS1/SLC15A4/SLC7A1/SLC47A1/ARL6IP5/SLC16A2/ITGB1/SLC38A10/SLC13A3/SFXN1/SLC43A2/SLC3A2/SLC19A1/SLC38A9/KCNJ10/SLC25A10/CLN3/SLC25A29/TNF/TNF/TNF/TNF/TNF/TNF/TNF/TNF/ABCC1 | 47 |
| GO:0060485 | mesenchyme development | 82/3662 | 276/15509 | 0.0110691 | 0.0349498 | 0.0210182 | WNT16/IGF1/SNAI2/HGF/EPHA3/ERBB3/FGFR2/ROCK1/CDC42/FGFR1/GSK3B/BMP7/SMAD7/SFRP1/TGFB1/HOXA5/EZH2/TGFBR1/AKNA/ENG/GATA3/BMPR1A/ACTA2/DDX5/FOLR1/MDK/CORO1C/FAM172A/PPP2CA/PDGFRB/WNT5A/HES1/FN1/STAT1/NRP2/PKD2/IL1B/BMP2/ALDH1A2/LAMA5/CPLANE2/LOXL2/SPRY2/EDNRB/IL6/NKX2-1/SMAD4/NOTCH1/TCF7L2/HMGA2/NODAL/ADIPOR1/WNT4/FRZB/POGLUT1/TGFBR2/HEYL/PITX2/RANBP3L/SHH/NOS3/RBPJ/SEMA4C/EFNA1/PTK2/ZFPM2/SEMA3E/CDH2/DAG1/SMAD2/NKX2-5/RFLNB/NOG/ZNF703/ZFP36L1/BCL9L/SPRED2/MTOR/MCRIP1/PDCD6/LRP6/PTEN | 82 |
| GO:0006111 | regulation of gluconeogenesis | 17/3662 | 42/15509 | 0.0111504 | 0.0351528 | 0.0211403 | CRY1/SIRT6/KAT2B/LEPR/SESN2/OGT/SOGA1/FOXO1/RANBP2/NNMT/MST1/LEP/PTPN2/ERFE/ADIPOQ/USP7/WDR5 | 17 |
| GO:0033003 | regulation of mast cell activation | 17/3662 | 42/15509 | 0.0111504 | 0.0351528 | 0.0211403 | GAB2/C12orf4/STXBP2/IL4R/GATA1/IL4/SNX4/VAMP8/NR4A3/RAC2/NECTIN2/STXBP1/SYK/LGALS9/PLSCR1/CNR2/CRLF2 | 17 |
| GO:0061647 | histone H3-K9 modification | 17/3662 | 42/15509 | 0.0111504 | 0.0351528 | 0.0211403 | KDM1A/ARID4B/KDM4A/ATRX/DNMT3B/SMARCB1/GATA3/ZNF451/KAT2B/KDM3A/MYB/PRDM12/DNMT1/SMAD4/LMNA/PAX5/SMARCB1 | 17 |
| GO:0006612 | protein targeting to membrane | 40/3662 | 121/15509 | 0.0113222 | 0.0356579 | 0.021444 | ZDHHC6/HSPA5/SEC61A1/SEC61A2/BAG6/MICALL1/CHMP4B/UBL4A/SGTA/ARL6/RAB3IP/ZDHHC4/SRP14/SRPRB/PARD3/ZFAND2B/DMTN/ITGB2/ZDHHC12/PEX19/ZDHHC3/CDK5/SRP68/MFF/ITGAM/HRAS/PDZK1/ZDHHC21/CDK5R1/MIEF2/CIB1/NACA/GDI1/ZDHHC18/BAG6/FIS1/BAG6/BAG6/BAG6/BAG6 | 40 |
| GO:0051928 | positive regulation of calcium ion transport | 40/3662 | 121/15509 | 0.0113222 | 0.0356579 | 0.021444 | BAK1/CASR/VMP1/MYLK/P2RX5/BAX/P2RX7/ABL1/PDGFB/JAK3/CXCL12/PPP3CB/CCL2/PDGFRB/PKD2/HSPA2/ARRB2/CALM2/STAC/ANK2/GSTO1/MS4A1/STC1/CALM3/GPER1/CDK5/STIM1/GRIN1/CD19/F2/F2R/CACNB4/STAC3/P2RX2/STIMATE/CCL5/CCL5/CCL4/CCL4/CCL4 | 40 |
| GO:0051146 | striated muscle cell differentiation | 75/3662 | 250/15509 | 0.0114977 | 0.0361924 | 0.0217655 | SPAG9/CD9/IGF1/BARX2/MAP2K4/WDR1/IL4R/SIRT6/ACTN2/ZMPSTE24/NOX4/XBP1/MYH9/NFATC2/PIEZO1/TGFB1/HAMP/GSK3A/MTPN/EZH2/PPP3CB/BMPR1A/DKK1/CNTNAP1/CD81/MAPK14/BVES/IL4/PDGFRB/FHL2/SDC1/BCL9/TNNT2/MORF4L2/OBSL1/BMP2/GDF15/RARA/MYH11/KRAS/PDGFRA/CCN3/MYOF/RB1/ARRB2/SMAD4/KCNH1/NOTCH1/ITGB1/MMP14/SKI/LMNA/MAML1/SELENON/CAPN2/PDLIM5/ANKRD23/CASP3/SHH/FRS2/RBPJ/CDK1/CDH2/BDNF/FLII/PLEC/CALR/ADGRB1/SLC8A1/NKX2-5/STAC3/P2RX2/CACNA1H/MTOR/MYH11 | 75 |
| GO:0071326 | cellular response to monosaccharide stimulus | 38/3662 | 114/15509 | 0.0115521 | 0.036345 | 0.0218573 | BAD/CASR/CYBA/PDK3/PRKACA/OPRK1/OXCT1/NOX4/ICAM1/SMARCB1/XBP1/PCK2/SLC39A14/PPP3CB/PPARD/SLC29A1/FOXO3/SOX4/NR1D1/PRKAA1/MEN1/IGF1R/SMAD4/EPHA5/SLC9B2/GPER1/CCDC186/PRKCE/NPTX1/KAT5/BRSK2/LEP/ERN1/PLCB1/PIM3/SELENOT/SMARCB1/PRKACA | 38 |
| GO:0030003 | cellular cation homeostasis | 128/3662 | 453/15509 | 0.0116139 | 0.036521 | 0.0219631 | SLC4A1/NOX1/HFE/SLC11A1/BAK1/GRN/ATP6V0A1/CASR/HEXB/HERPUD1/CYBA/ATP2B4/AP3D1/ATP6AP1/PRKACA/SLC46A1/PTPRC/FTL/BAX/FKBP1A/P2RX7/SLC22A17/ABL1/KCTD17/CD40/NUBP1/SLC39A14/HAMP/TFR2/CXCL12/CDH23/CCDC47/HPX/CALCA/SLC11A2/VDR/IFNG/PDE4D/WNT5A/ATP6V1A/IL1A/SLC30A3/ATP6V0B/FASLG/PKD2/PTK2B/KCNJ2/RAB38/TMTC4/SLC25A23/CCR7/ATP6V1F/TNNI3/APOE/NDFIP1/C19orf12/IMMT/AP3B1/ISCU/IREB2/ATP6V1G1/CCL21/FGF2/TMBIM6/SMAD4/SOD1/APP/SYPL2/TMCO1/SNAPIN/CALM2/ANK2/ATP6V1B2/LCN2/GSTO1/ITPR1/BMP6/SLC24A2/STEAP2/ALAS2/STC1/CALM3/CCR5/CYB561A3/SELENON/SCNN1D/SLC30A7/DISC1/ATP1A1/GPER1/SLC4A2/FXN/STIM1/FTH1/LETM1/PRKCE/CCL11/CCL19/ATP2A2/DDIT3/CD19/GRINA/ERFE/CALR/LACC1/F2/F2R/SLC9A9/SLC8A1/SMDT1/TMPRSS6/TMEM203/CLN3/FZD9/TRPV1/MAFG/ELANE/TGM2/FIS1/KCTD7/TMEM199/ITGB3/PTPRC/CCL5/CCL5/ELANE/RASA3/PRKACA | 128 |
| GO:1900542 | regulation of purine nucleotide metabolic process | 28/3662 | 79/15509 | 0.011698 | 0.0367668 | 0.0221109 | SLC4A1/IGF1/PDK3/SIRT6/DNM1L/P2RX7/IFNG/IL4/CBFA2T3/PRKAA1/APP/ARNT/PARP1/OGT/NDUFC2/SLC2A6/AK4/NOS3/VCP/GPD1/DDIT4/PGAM1/DNAJC30/LACC1/MTOR/TMSB4X/FIS1/EIF6 | 28 |
| GO:0001952 | regulation of cell-matrix adhesion | 36/3662 | 107/15509 | 0.0117352 | 0.0368652 | 0.0221701 | EPHA3/RHOA/ROCK1/GSK3B/CEACAM6/ABL1/FERMT1/SFRP1/SERPINE1/CORO1C/BCL6/TEK/PTK2B/CCR7/RRAS/KDR/CD36/CCL21/THBS1/PIK3R1/MMP14/DMTN/WNT4/DISC1/PTK2/PLEKHA2/LIMS1/SEMA3E/DAG1/RCC2/CSF1/CIB1/NF2/SRC/ITGB3/PTEN | 36 |
| GO:0030857 | negative regulation of epithelial cell differentiation | 16/3662 | 39/15509 | 0.0117762 | 0.0369378 | 0.0222137 | TP63/MMP9/EZH2/CCND1/IFNG/HES1/IL1A/STAT1/ID1/KRAS/SPRY2/NOTCH1/ZEB1/NODAL/FRZB/SPRED2 | 16 |
| GO:0048246 | macrophage chemotaxis | 16/3662 | 39/15509 | 0.0117762 | 0.0369378 | 0.0222137 | MMP2/CCL2/MDK/PTK2B/NUP85/MTUS1/SFTPD/EDNRB/THBS1/CYP19A1/PTK2/CSF1R/CSF1/CCL5/CCL5/MIF | 16 |
| GO:0048566 | embryonic digestive tract development | 16/3662 | 39/15509 | 0.0117762 | 0.0369378 | 0.0222137 | FGFR2/GLI2/ID2/ALDH1A2/PDGFRA/HLX/SHH/CXCL8/TNF/TNF/TNF/TNF/TNF/TNF/TNF/TNF | 16 |
| GO:0006278 | RNA-templated DNA biosynthetic process | 23/3662 | 62/15509 | 0.0117908 | 0.0369462 | 0.0222188 | SMG6/XRCC5/MAPKAPK5/HNRNPC/HSP90AB1/RAD50/XRN1/POT1/DKC1/HNRNPA1/CCT7/PIF1/TERT/CCT2/EXOSC10/DCP2/AURKB/MAPK15/NOP10/SRC/SMG5/TEN1/TINF2 | 23 |
| GO:0051785 | positive regulation of nuclear division | 23/3662 | 62/15509 | 0.0117908 | 0.0369462 | 0.0222188 | CDC27/IGF1/SIRT2/ANAPC5/PDGFB/PDGFRB/WNT5A/IL1A/IL1B/NUSAP1/EGF/RB1/WNT4/CD28/PLCB1/TNF/TNF/TNF/TNF/TNF/TNF/TNF/TNF | 23 |
| GO:0010883 | regulation of lipid storage | 20/3662 | 52/15509 | 0.0117977 | 0.036949 | 0.0222205 | APOB/NFKBIA/PPARD/C3/CD36/IL6/ITGAV/OSBPL11/LEP/PTPN2/LPL/TNF/TNF/TNF/TNF/TNF/TNF/TNF/TNF/ITGB3 | 20 |
| GO:0001657 | ureteric bud development | 30/3662 | 86/15509 | 0.0118608 | 0.0370718 | 0.0222943 | HOXA11/FGFR2/ARG2/BMP7/SMAD7/EYA1/SFRP1/TMEM59L/GATA3/SMAD5/HES1/SDC1/PKD2/CAT/BMP2/FOXJ1/LAMA5/RARA/SMAD6/FGF2/GREB1L/SMAD4/SLIT2/ADAMTS16/WNT4/SHH/SMAD2/CTNNBIP1/NOG/PBX1 | 30 |
| GO:0072163 | mesonephric epithelium development | 30/3662 | 86/15509 | 0.0118608 | 0.0370718 | 0.0222943 | HOXA11/FGFR2/ARG2/BMP7/SMAD7/EYA1/SFRP1/TMEM59L/GATA3/SMAD5/HES1/SDC1/PKD2/CAT/BMP2/FOXJ1/LAMA5/RARA/SMAD6/FGF2/GREB1L/SMAD4/SLIT2/ADAMTS16/WNT4/SHH/SMAD2/CTNNBIP1/NOG/PBX1 | 30 |
| GO:0072164 | mesonephric tubule development | 30/3662 | 86/15509 | 0.0118608 | 0.0370718 | 0.0222943 | HOXA11/FGFR2/ARG2/BMP7/SMAD7/EYA1/SFRP1/TMEM59L/GATA3/SMAD5/HES1/SDC1/PKD2/CAT/BMP2/FOXJ1/LAMA5/RARA/SMAD6/FGF2/GREB1L/SMAD4/SLIT2/ADAMTS16/WNT4/SHH/SMAD2/CTNNBIP1/NOG/PBX1 | 30 |
| GO:1990823 | response to leukemia inhibitory factor | 30/3662 | 86/15509 | 0.0118608 | 0.0370718 | 0.0222943 | XRCC5/ICAM1/MYBL2/SMAD7/BCAT2/NCL/KDM3A/SRSF7/SRM/NR5A2/PADI2/KDM5B/NRP2/HELLS/TRIM25/TEX14/EEF1E1/SPRY2/ARID5B/VEGFC/SMARCA5/EIF4A2/PIGA/RARG/FZD4/CTBP2/SHMT1/CACNB4/PTP4A3/SPRY4 | 30 |
| GO:1903035 | negative regulation of response to wounding | 32/3662 | 93/15509 | 0.0119069 | 0.037197 | 0.0223696 | CD9/APOH/PDGFB/PLAT/SERPINE1/MDK/SH2B3/SPP1/APOE/PDGFRA/SERPINE2/KIAA0319/THBS1/FGF2/ADAMTS18/WNT4/PRKCD/NOS3/FGG/FGA/F2/RGMA/ANXA2/TNF/TNF/TNF/TNF/TNF/TNF/TNF/TNF/PTEN | 32 |
| GO:0001768 | establishment of T cell polarity | 8/3662 | 15/15509 | 0.0121532 | 0.0377382 | 0.0226951 | ABL1/MYH9/CCR7/FLOT2/CCL21/ABL2/GSN/CCL19 | 8 |
| GO:0006266 | DNA ligation | 8/3662 | 15/15509 | 0.0121532 | 0.0377382 | 0.0226951 | PARP3/RAD51/TFIP11/LIG1/TOP2A/MGMT/LIG4/HMGB1 | 8 |
| GO:0010692 | regulation of alkaline phosphatase activity | 8/3662 | 15/15509 | 0.0121532 | 0.0377382 | 0.0226951 | TNF/TNF/TNF/TNF/TNF/TNF/TNF/TNF | 8 |
| GO:0031269 | pseudopodium assembly | 8/3662 | 15/15509 | 0.0121532 | 0.0377382 | 0.0226951 | CDC42/CCR7/CDC42EP1/APC/CCL21/CDC42EP2/KIT/CDC42EP3 | 8 |
| GO:0043380 | regulation of memory T cell differentiation | 8/3662 | 15/15509 | 0.0121532 | 0.0377382 | 0.0226951 | IL12RB1/IL12B/BCL6/HLA-DRA/HLA-DRA/HLA-DRA/HLA-DRA/HLA-DRA | 8 |
| GO:0044406 | adhesion of symbiont to host | 8/3662 | 15/15509 | 0.0121532 | 0.0377382 | 0.0226951 | LTF/ICAM1/HSP90AB1/CD81/NECTIN2/SFTPD/INHBB/DPP4 | 8 |
| GO:0051014 | actin filament severing | 8/3662 | 15/15509 | 0.0121532 | 0.0377382 | 0.0226951 | SCIN/MYH9/DSTN/GSN/CFL1/FLII/FMNL1/GMFB | 8 |
| GO:0061101 | neuroendocrine cell differentiation | 8/3662 | 15/15509 | 0.0121532 | 0.0377382 | 0.0226951 | BCCIP/HES1/NKX2-2/BMP2/FGF2/NOTCH1/WNT4/POU3F2 | 8 |
| GO:0072109 | glomerular mesangium development | 8/3662 | 15/15509 | 0.0121532 | 0.0377382 | 0.0226951 | PDGFB/BMP7/ACTA2/PDGFRB/EGR1/NOTCH1/IL6R/ITGB3 | 8 |
| GO:1902165 | regulation of intrinsic apoptotic signaling pathway in response to DNA damage by p53 class mediator | 8/3662 | 15/15509 | 0.0121532 | 0.0377382 | 0.0226951 | KDM1A/CD74/CD44/ZNF385A/RPL26/TRIAP1/MUC1/MIF | 8 |
| GO:1903729 | regulation of plasma membrane organization | 8/3662 | 15/15509 | 0.0121532 | 0.0377382 | 0.0226951 | ATP8B1/SH3GLB1/MYH9/FASLG/AHNAK/GSN/PRKCD/ANXA2 | 8 |
| GO:2000269 | regulation of fibroblast apoptotic process | 8/3662 | 15/15509 | 0.0121532 | 0.0377382 | 0.0226951 | TP63/STK17B/CHD8/SFRP1/PIK3CG/BTG1/BCL2L11/STK17A | 8 |
| GO:0050807 | regulation of synapse organization | 62/3662 | 202/15509 | 0.0122566 | 0.0380404 | 0.0228768 | PAFAH1B1/NTN1/RHOA/VPS35/FCGR2B/GPC4/ABL1/ADNP/DKK1/HSPA8/NEDD9/MAPK14/DBN1/WNT5A/CDC20/NRP2/FLRT3/APOE/EPHB2/LRP4/DBNL/IL10/ACTR2/ABI2/CLSTN3/ST8SIA2/APP/TPBG/NTRK2/DISC1/PDLIM5/CDK5/VCP/SETD5/EFNA1/CDH2/NPTX1/CFL1/DAG1/BDNF/CDK5R1/OXTR/ADGRB1/EPHB3/THBS2/CLN3/IL1RAP/TUBB/SIPA1L1/DNM3/NTRK1/GPRASP3/TNF/TNF/TNF/TNF/TNF/TNF/TNF/TNF/SHANK3/PTEN | 62 |
| GO:0008360 | regulation of cell shape | 44/3662 | 136/15509 | 0.0123532 | 0.0382836 | 0.0230231 | HEXB/RHOA/WDR1/MARK2/PLXNA2/ZMPSTE24/MYH9/HCK/MYH14/CCL2/BVES/FN1/GNA13/PTK2B/KDR/CDC42EP1/RAC2/WASF3/RDX/RHOB/ARHGAP18/GNA12/MSN/GAS2/CDC42EP2/KIT/DMTN/EPB41/ARHGAP35/ITGB2/CDC42EP3/SPTA1/EPB42/RHOH/PTK2/SEMA3E/CCL11/DAG1/SYNE3/F2/CSF1R/FMNL1/BRWD1/PARVA | 44 |
| GO:1902652 | secondary alcohol metabolic process | 44/3662 | 136/15509 | 0.0123532 | 0.0382836 | 0.0230231 | PON1/MBTPS2/NPC1L1/SOAT1/ACADVL/APOB/CYP2D6/CYB5R3/ACO2/IDH3B/SQLE/SC5D/MVK/CYP27B1/PPARD/IL4/SNX17/HDLBP/LEPR/EPHX2/CAT/APOE/ACLY/PRKAA1/FDX1/CYP1A2/SOD1/APP/LBR/ERLIN2/VLDLR/LDLRAP1/CYP3A4/IDH3A/CYP7B1/ARV1/LEP/IDH2/CEBPA/CYP2D6/CYP2D6/CYP2D6/CYP2D6/CYP2D6 | 44 |
| GO:0021955 | central nervous system neuron axonogenesis | 15/3662 | 36/15509 | 0.0123782 | 0.0382836 | 0.0230231 | PAFAH1B1/GLI2/HSP90AB1/SCN1B/EPHB2/SLIT2/NR4A2/B4GALT5/ARHGAP35/SPTBN4/EPHB3/DCC/TCTN1/EPHB6/PTEN | 15 |
| GO:0033028 | myeloid cell apoptotic process | 15/3662 | 36/15509 | 0.0123782 | 0.0382836 | 0.0230231 | SNAI2/ST6GAL1/APOH/GATA1/THRA/IRF3/EPO/IL6/BAP1/NOD2/STAT5B/CXCR2/ADIPOQ/MIF/PTEN | 15 |
| GO:0071276 | cellular response to cadmium ion | 15/3662 | 36/15509 | 0.0123782 | 0.0382836 | 0.0230231 | MMP9/MAPK8/CYP1A2/SOD1/EGFR/CYBB/FOS/JUN/AKR1C3/DAXX/DAXX/CHUK/DAXX/DAXX/DAXX | 15 |
| GO:0071392 | cellular response to estradiol stimulus | 15/3662 | 36/15509 | 0.0123782 | 0.0382836 | 0.0230231 | MMP2/ESR1/SFRP1/BCL2L2/IL10/IGF1R/CCNA2/EGFR/POU4F2/POU4F1/BCL2L11/GPER1/KAT5/SSTR2/ZNF703 | 15 |
| GO:1901532 | regulation of hematopoietic progenitor cell differentiation | 15/3662 | 36/15509 | 0.0123782 | 0.0382836 | 0.0230231 | EIF2AK2/SPI1/ABL1/OSM/ZNHIT1/HSPA9/HES1/MYB/ZFP36/KDR/RARA/NOTCH1/KAT5/PRKDC/ITCH | 15 |
| GO:0006163 | purine nucleotide metabolic process | 120/3662 | 423/15509 | 0.0125087 | 0.0386676 | 0.023254 | BAD/AK2/SLC4A1/AASS/IGF1/PDE4A/PKM/RHOA/PDK3/SIRT6/DNM1L/P2RX7/DLD/ACOT7/TECR/SLC25A1/MTHFD1/GMPR2/PRPS2/GPI/TGFB1/GCDH/AK1/ENO3/ALDOC/NDUFC1/HSPA8/MVK/IFNG/PDE8B/PDE4D/IL4/ATP6V1A/ABHD14B/AMPD2/ATP5PB/NT5C1A/NDUFA8/GPAM/ACSL3/MCEE/ITPA/PAICS/PPAT/CBFA2T3/ACLY/PRKAA1/HSD17B4/NT5E/OLA1/NUDT7/APP/EPHA2/ADCY10/ARNT/PKLR/GUK1/PARP1/NDUFS6/OGT/ATP6V1B2/NDUFB9/AK3/DLAT/OXSM/NDUFC2/AK5/ATP5MC3/ACSS1/SLC26A2/DCK/NDUFS2/GART/PDE9A/NDUFV3/SLC2A6/AK4/ELOVL7/ACSL6/ADCY1/NOS3/VCP/NUDT5/LDHC/ATP5MG/GPD1/NDUFV1/DDIT4/NDUFS5/ATP5ME/HINT1/TPST1/PGAM1/PDE7B/SUCLG2/ATP5MK/DNAJC30/LACC1/CACNB4/PDE4B/ADSS1/ENTPD4/ENTPD7/ND6/MTOR/PNP/TMSB4X/ND4L/NDUFS3/NUDT19/FIS1/NME1/ADSL/ATP5MF/EIF6/PKLR/NUDT3/GPI/GMPR2/LDHA | 120 |
| GO:1903825 | organic acid transmembrane transport | 47/3662 | 147/15509 | 0.0125495 | 0.0387744 | 0.0233183 | SLC11A1/SLC46A1/LRP2/ABCB1/SLC23A2/SLC7A8/SLC25A1/SLC25A14/SLC25A15/SLC38A7/SLC7A6/ABCC1/SLC1A5/SLC25A11/FOLR1/SLC2A1/ARG1/SLC16A7/PER2/CD36/THBS1/SLC15A4/SLC7A1/SLC47A1/ARL6IP5/SLC16A2/ITGB1/SLC38A10/SLC13A3/SFXN1/SLC43A2/SLC3A2/SLC19A1/SLC38A9/KCNJ10/SLC25A10/CLN3/SLC25A29/TNF/TNF/TNF/TNF/TNF/TNF/TNF/TNF/ABCC1 | 47 |
| GO:1904950 | negative regulation of establishment of protein localization | 37/3662 | 111/15509 | 0.0125748 | 0.0388334 | 0.0233538 | RHBDF1/SP100/DERL2/LMAN1/SIRT6/RANGAP1/FERMT1/NDFIP2/CSK/SFRP1/PSMD9/IL12B/PARK7/IL1B/APOE/NDFIP1/CD36/MDFIC/CCN3/SNX12/FOXO1/BAG3/DMTN/INHBB/CDK5/PKIG/PTPN11/YOD1/ADIPOQ/F2R/PRKN/KCNJ11/SVIP/PIM3/WWP2/UBE2J1/GDI1 | 37 |
| GO:0009261 | ribonucleotide catabolic process | 19/3662 | 49/15509 | 0.0126511 | 0.0389719 | 0.023437 | PDE4A/ACOT7/PDE8B/PDE4D/NT5C1A/ITPA/NT5E/NUDT7/PDE9A/HINT1/PDE7B/SUCLG2/PDE4B/DPYD/ENTPD4/ENTPD7/PNP/NUDT19/NUDT3 | 19 |
| GO:0030520 | intracellular estrogen receptor signaling pathway | 19/3662 | 49/15509 | 0.0126511 | 0.0389719 | 0.023437 | UFL1/TP63/ESR1/RBFOX2/DDX5/PADI2/ARID1A/CNOT1/WBP2/CARM1/PARP1/CNOT9/POU4F2/TADA3/CYP7B1/TAF7/SRC/KANK2/PAGR1 | 19 |
| GO:0043687 | post-translational protein modification | 19/3662 | 49/15509 | 0.0126511 | 0.0389719 | 0.023437 | BAZ1B/SIRT2/SIRT6/ATG16L1/TTL/P3H1/EGR1/PKN1/MAP3K12/DCAF1/PRKCA/WIPI2/PADI4/PRKCD/FAM20C/AURKB/UBE2F/ATG7/PADI4 | 19 |
| GO:0045840 | positive regulation of mitotic nuclear division | 19/3662 | 49/15509 | 0.0126511 | 0.0389719 | 0.023437 | CDC27/IGF1/ANAPC5/PDGFB/PDGFRB/IL1A/IL1B/NUSAP1/EGF/RB1/CD28/TNF/TNF/TNF/TNF/TNF/TNF/TNF/TNF | 19 |
| GO:2000677 | regulation of transcription regulatory region DNA binding | 19/3662 | 49/15509 | 0.0126511 | 0.0389719 | 0.023437 | IGF1/ZMPSTE24/GATA1/DOT1L/TGFB1/GATA3/IFNG/PARK7/LIF/PER2/RB1/PARP1/POU4F2/POU4F1/NSD1/DDIT3/RNF220/H1-0/TMSB4X | 19 |
| GO:0002011 | morphogenesis of an epithelial sheet | 22/3662 | 59/15509 | 0.0127363 | 0.0392149 | 0.0235831 | CD44/RHOA/BMP7/FERMT1/LAMA1/DVL1/HBEGF/WNT5A/FLRT3/AJUBA/COL5A1/NOTCH2/CCN1/NOTCH1/ITGB1/ARHGAP35/ARHGAP12/DAG1/HOXB2/MRTFA/MTOR/PTEN | 22 |
| GO:0007006 | mitochondrial membrane organization | 35/3662 | 104/15509 | 0.0127756 | 0.039297 | 0.0236325 | BAD/AGK/BAK1/GSK3B/BAX/TMEM14A/TIMM13/SAMM50/GZMB/TIMM9/PDCD5/GSK3A/MAPK8/PPIF/HSPA9/MFN2/BCL2L2/TIMM10B/IMMT/AP3B1/NMT1/PMAIP1/TIMM8B/BCL2L11/THEM4/CALM3/OMA1/SLC25A46/LETM1/BCL2L1/TOMM20/CNP/TOMM5/MTX3/FZD9 | 35 |
| GO:0046916 | cellular transition metal ion homeostasis | 35/3662 | 104/15509 | 0.0127756 | 0.039297 | 0.0236325 | HFE/SLC11A1/AP3D1/ATP6AP1/SLC46A1/FTL/SLC22A17/NUBP1/SLC39A14/HAMP/TFR2/HPX/SLC11A2/IFNG/ATP6V1A/SLC30A3/NDFIP1/AP3B1/ISCU/IREB2/ATP6V1G1/SMAD4/SOD1/APP/LCN2/BMP6/STEAP2/ALAS2/CYB561A3/SLC30A7/FXN/FTH1/ERFE/TMPRSS6/TMEM199 | 35 |
| GO:0071692 | protein localization to extracellular region | 96/3662 | 331/15509 | 0.0129285 | 0.0397005 | 0.0238752 | BAD/CD38/PAFAH1B1/RHBDF1/IGF1/CASR/NNAT/VPS35/SEL1L/LLGL2/SIRT6/OXCT1/RAB10/ACHE/DNM1L/P2RX7/RAPGEF4/PCK2/PARD6A/SFRP1/KCNN4/OLFM2/TGFB1/CD33/AP1S1/PPP3CB/PSMD9/IFNG/PPARD/APBB3/IL12B/IL1A/PARK7/P3H1/SNX19/SERP1/SOX4/IL1B/NECAB3/NR1D1/APOE/PER2/HNF1A/GLUL/EDNRB/IL6/IL1RN/TLR4/CCN3/FBN2/ENSA/RAB13/EPHA5/CAMK2G/GLUD1/TCF7L2/VEGFC/FOXO1/BMP6/PDIA4/COPG2/DMTN/INHBB/SLC9B2/ARFIP1/GPER1/CCDC186/ADAM9/PRKCE/FGG/FGA/SCG2/BRSK2/TMEM167A/LEP/SMAD2/SVBP/PTPN11/F2R/MAFA/PRKN/KCNJ11/BLOC1S3/PPIA/PIM3/SELENOT/TNF/TNF/TNF/TNF/TNF/TNF/TNF/TNF/CCL5/CCL5 | 96 |
| GO:0033144 | negative regulation of intracellular steroid hormone receptor signaling pathway | 14/3662 | 33/15509 | 0.0129325 | 0.0397005 | 0.0238752 | CRY1/RHOA/TP63/PIAS2/SFRP1/HDAC1/CRY2/CNOT1/CNOT9/NODAL/HEYL/CYP7B1/CALR/KANK2 | 14 |
| GO:0035137 | hindlimb morphogenesis | 14/3662 | 33/15509 | 0.0129325 | 0.0397005 | 0.0238752 | ALX4/PITX1/TP63/RPGRIP1L/BMPR1A/WNT3/ZBTB16/HOXD9/AFF3/NOTCH1/SHH/RARG/WNT3/WNT3 | 14 |
| GO:0043276 | anoikis | 14/3662 | 33/15509 | 0.0129325 | 0.0397005 | 0.0238752 | SNAI2/CEACAM6/TSC2/TLE5/MYBBP1A/NTRK2/NOTCH1/ITGB1/PTK2/CHEK2/SRC/TFDP1/MTOR/IKBKG | 14 |
| GO:0006352 | DNA-templated transcription initiation | 40/3662 | 122/15509 | 0.0130896 | 0.0401629 | 0.0241533 | E2F2/MED24/MED17/MED29/ESR1/MED15/SMARCB1/PSMC6/TAF1C/MED25/POLR2I/TFAM/ZNF451/DR1/THRA/MED6/CCNH/HNF1A/TAF8/POLR2D/BDP1/GTF3C5/SMARCA5/ELOC/TAF6L/ERCC3/MED30/GTF2A1/PPM1D/MED16/FOSL1/JUN/CTNNBIP1/TAF7/NKX2-5/BRF1/HMGB1/TAF13/NCOA6/SMARCB1 | 40 |
| GO:0015802 | basic amino acid transport | 9/3662 | 18/15509 | 0.0132505 | 0.0403175 | 0.0242463 | SLC11A1/SLC25A15/SLC7A6/SLC15A4/SLC7A1/SLC47A1/SLC38A9/CLN3/SLC25A29 | 9 |
| GO:0019430 | removal of superoxide radicals | 9/3662 | 18/15509 | 0.0132505 | 0.0403175 | 0.0242463 | MPO/BMP7/PRDX1/CD36/SOD1/FANCC/NOS3/PRDX2/NQO1 | 9 |
| GO:0033033 | negative regulation of myeloid cell apoptotic process | 9/3662 | 18/15509 | 0.0132505 | 0.0403175 | 0.0242463 | SNAI2/ST6GAL1/APOH/GATA1/EPO/NOD2/STAT5B/CXCR2/MIF | 9 |
| GO:0036498 | IRE1-mediated unfolded protein response | 9/3662 | 18/15509 | 0.0132505 | 0.0403175 | 0.0242463 | UFL1/BAK1/HSPA5/BAX/XBP1/BFAR/TMEM33/BCL2L11/ERN1 | 9 |
| GO:0044794 | positive regulation by host of viral process | 9/3662 | 18/15509 | 0.0132505 | 0.0403175 | 0.0242463 | YTHDC2/VAPA/HSPA8/APOE/EEF1A1/PAIP1/CFL1/CSF1R/IGF2R | 9 |
| GO:0045063 | T-helper 1 cell differentiation | 9/3662 | 18/15509 | 0.0132505 | 0.0403175 | 0.0242463 | TMEM98/TBX21/IL4R/JAK3/CD80/HLX/CCL19/HMGB1/MTOR | 9 |
| GO:0046782 | regulation of viral transcription | 9/3662 | 18/15509 | 0.0132505 | 0.0403175 | 0.0242463 | MID2/TRIM14/ZFP36/MDFIC/TARBP2/TRIM8/LARP7/HEXIM1/TRIM13 | 9 |
| GO:0048025 | negative regulation of mRNA splicing, via spliceosome | 9/3662 | 18/15509 | 0.0132505 | 0.0403175 | 0.0242463 | PTBP1/C1QBP/SRSF9/SRSF7/SRSF4/RBM42/RBMX/NPM1/RBM10 | 9 |
| GO:0048026 | positive regulation of mRNA splicing, via spliceosome | 9/3662 | 18/15509 | 0.0132505 | 0.0403175 | 0.0242463 | DAZAP1/CIRBP/SNRNP70/HSPA8/NCL/PRDX6/NCBP1/SF3B4/RBMX | 9 |
| GO:0060039 | pericardium development | 9/3662 | 18/15509 | 0.0132505 | 0.0403175 | 0.0242463 | BMP7/RPGRIP1L/WNT5A/BMP2/FLRT3/CCM2/NOTCH1/SMAD2/SETD2 | 9 |
| GO:0060391 | positive regulation of SMAD protein signal transduction | 9/3662 | 18/15509 | 0.0132505 | 0.0403175 | 0.0242463 | TGFB1/TGFBR1/BMPR1A/BMP2/KIAA0319/SMAD4/PARP1/BMP6/NODAL | 9 |
| GO:0070584 | mitochondrion morphogenesis | 9/3662 | 18/15509 | 0.0132505 | 0.0403175 | 0.0242463 | BAX/DNM1L/MYH14/SLIRP/NUBPL/MFF/BCL2L1/PLEC/FIS1 | 9 |
| GO:0071404 | cellular response to low-density lipoprotein particle stimulus | 9/3662 | 18/15509 | 0.0132505 | 0.0403175 | 0.0242463 | CD9/CASR/CD81/CD36/ITGB1/ITGB2/SYK/LPL/GAS5 | 9 |
| GO:0080182 | histone H3-K4 trimethylation | 9/3662 | 18/15509 | 0.0132505 | 0.0403175 | 0.0242463 | NFYA/KMT2E/NFYC/H1-3/SKIC8/OGT/H1-4/TET3/H1-2 | 9 |
| GO:0150146 | cell junction disassembly | 9/3662 | 18/15509 | 0.0132505 | 0.0403175 | 0.0242463 | SNAI2/TGFBR1/DKK1/C3/PIK3R1/CDK5/MAPRE2/CX3CR1/ITGAM | 9 |
| GO:1903236 | regulation of leukocyte tethering or rolling | 9/3662 | 18/15509 | 0.0132505 | 0.0403175 | 0.0242463 | SELE/CXCL12/ITGA4/CCL21/PTAFR/SELP/FUT4/ELANE/ELANE | 9 |
| GO:1904294 | positive regulation of ERAD pathway | 9/3662 | 18/15509 | 0.0132505 | 0.0403175 | 0.0242463 | HERPUD1/ATXN3/BAG6/SGTA/BAG6/BAG6/BAG6/BAG6/BAG6 | 9 |
| GO:0010657 | muscle cell apoptotic process | 24/3662 | 66/15509 | 0.0133885 | 0.04059 | 0.0244101 | IGF1/MAP2K4/APOH/BMP7/MDK/IFNG/IL12B/MFN2/PTK2B/SIRT5/GNGT1/DNMT1/IGF1R/ARRB2/SMAD4/POU4F2/BAG3/CAPN2/ATP2A2/CXCR2/RBM10/NKX2-5/MAP3K5/LRP6 | 24 |
| GO:0061035 | regulation of cartilage development | 24/3662 | 66/15509 | 0.0133885 | 0.04059 | 0.0244101 | HOXA11/SCIN/SNAI2/GLG1/SMAD7/TGFBR1/ZBTB16/MDK/WNT5A/RUNX2/BMP2/RARA/LOXL2/ADAMTS7/CCN1/BMP6/FRZB/BMP1/RARG/LEP/MAF/PTPN11/RFLNB/NOG | 24 |
| GO:0070527 | platelet aggregation | 24/3662 | 66/15509 | 0.0133885 | 0.04059 | 0.0244101 | CD9/ACTB/MYH9/CTSG/GATA1/PIK3CG/HSPB1/SH2B3/FN1/MPL/PDGFRA/SERPINE2/IL6/STXBP1/ADAMTS18/PRKCA/DMTN/PRKCD/SYK/FGG/FGA/PPIA/HBB/ITGB3 | 24 |
| GO:2000401 | regulation of lymphocyte migration | 24/3662 | 66/15509 | 0.0133885 | 0.04059 | 0.0244101 | RHOA/ABL1/PYCARD/IL27RA/CXCL12/CCL2/NEDD9/WNT5A/CCL20/ITGA4/PADI2/PTK2B/CCL21/APP/ABL2/MSN/CXCL13/FADD/ITGB3/CCL5/CCL5/CCL4/CCL4/CCL4 | 24 |
| GO:0006515 | protein quality control for misfolded or incompletely synthesized proteins | 13/3662 | 30/15509 | 0.0134056 | 0.04059 | 0.0244101 | ATXN3/BAG6/UGGT2/AKIRIN2/DERL1/OMA1/VCP/RNF5/BAG6/BAG6/BAG6/BAG6/BAG6 | 13 |
| GO:0030224 | monocyte differentiation | 13/3662 | 30/15509 | 0.0134056 | 0.04059 | 0.0244101 | CD4/CD74/PIR/MYH9/ACIN1/CSF2/INPP5D/JUN/CTNNBIP1/CSF1R/CSF1/ZFP36L1/INPP5D | 13 |
| GO:0032925 | regulation of activin receptor signaling pathway | 13/3662 | 30/15509 | 0.0134056 | 0.04059 | 0.0244101 | FKBP1A/SMAD7/MEN1/NODAL/SKI/SHH/SMAD2/MAGI2/CSNK2B/CSNK2B/CSNK2B/CSNK2B/CSNK2B | 13 |
| GO:0048333 | mesodermal cell differentiation | 13/3662 | 30/15509 | 0.0134056 | 0.04059 | 0.0244101 | HOXA11/ITGA3/FGFR2/ITGA8/EYA1/BMPR1A/DKK1/INHBA/HMGA2/ITGB1/GJA1/NODAL/ITGB3 | 13 |
| GO:0051085 | chaperone cofactor-dependent protein refolding | 13/3662 | 30/15509 | 0.0134056 | 0.04059 | 0.0244101 | CD74/HSPA5/BAG1/HSPA8/HSPA9/HSPE1/HSPA2/DNAJB12/HSPA1L/HSPA1L/HSPA1L/HSPA1L/HSPA1L | 13 |
| GO:2000352 | negative regulation of endothelial cell apoptotic process | 13/3662 | 30/15509 | 0.0134056 | 0.04059 | 0.0244101 | ICAM1/ABL1/SERPINE1/GATA3/IL4/TNFAIP3/TEK/KDR/TERT/TNIP2/FGG/FGA/SCG2 | 13 |
| GO:0007265 | Ras protein signal transduction | 93/3662 | 320/15509 | 0.0134608 | 0.0407374 | 0.0244987 | ITGA3/NISCH/IGF1/USP28/RASGRF1/NGFR/NTN1/RHOA/ROCK1/RASGRP2/CDC42/GNB1/MAPKAPK5/BRAP/RAPGEF4/ABL1/MYO9B/ARHGEF10/SYDE1/PIK3CG/MET/RAPGEF1/SHOC2/CYTH1/LRRC59/RANGRF/FOXM1/PDGFRB/BCL6/DOK1/PARK7/MFN2/SSX2IP/STMN1/CTNNAL1/GNA13/CDKN1A/RRAS/CDC42EP1/RAC2/APOE/EPO/DNMT1/EPHB2/KRAS/NOTCH2/NGF/SPRY2/DBNL/RDX/PLCE1/ABI2/FGF2/RB1/ARHGDIA/ABL2/RHOB/CCNA2/PLK2/DOK3/GNA12/OGT/NOTCH1/CDC42EP2/ITGB1/ARHGAP35/CDC42EP3/FBXO8/F2RL2/MAPRE2/NKIRAS2/RHOH/KSR2/CFL1/DENND4A/HRAS/KCTD13/JUN/GRB2/F2R/CSF1/SPRY4/ARHGEF12/SRC/KANK2/SYNGAP1/NKIRAS1/NTRK1/GDI1/NRAS/BRK1/RASA3/SQSTM1 | 93 |
| GO:0010823 | negative regulation of mitochondrion organization | 18/3662 | 46/15509 | 0.0135427 | 0.0409453 | 0.0246238 | IGF1/HGF/BAK1/TMEM14A/TSC2/PPIF/CLU/IAPP/BCL2L2/ARRB2/LMNA/OMA1/FXN/PRELID1/TRIAP1/BCL2L1/PRKN/FZD9 | 18 |
| GO:0043300 | regulation of leukocyte degranulation | 18/3662 | 46/15509 | 0.0135427 | 0.0409453 | 0.0246238 | GAB2/C12orf4/SPI1/FCGR2B/STXBP2/IL4R/GATA1/IL4/SNX4/VAMP8/RAC2/STXBP1/ITGB2/SYK/LGALS9/PTAFR/ITGAM/CD177 | 18 |
| GO:0060249 | anatomical structure homeostasis | 88/3662 | 301/15509 | 0.0135626 | 0.0409855 | 0.024648 | CD38/USH1C/PROM1/LTF/HEXB/CDH3/ACTB/NOX4/BAX/P2RX7/LYZ/CHMP4B/GATA1/ACP5/CSK/TJP1/IL7/HAMP/HSPB1/CDH23/CALCA/IL17A/NPHP3/EPAS1/SLC2A1/PRDX1/TNFAIP3/SPP1/PTK2B/IAPP/USP45/KDR/IMMT/PRKAA1/SFTPD/KRAS/LAMC1/IL6/TLR4/COL2A1/RB1/BBS4/DEF8/TNFRSF11A/SOD1/APP/SNAPIN/NOTCH1/CDHR1/ITGB1/BAG3/GJA1/PRKCA/DRAM2/CLDN12/DISC1/ALB/BAP1/TNFRSF11B/NOS3/SYK/FXN/NOD2/ABCA3/NKIRAS2/INPP5D/ADRB2/S1PR1/IQCB1/GPR137/ATP2A2/PTPN11/BBS10/F2R/CSF1R/CSF1/PRKN/SRC/SLC22A5/NKIRAS1/MBP/GIGYF2/ITGB3/PECAM1/B2M/AKT3/TJP1/INPP5D | 88 |
| GO:0030073 | insulin secretion | 55/3662 | 177/15509 | 0.0136229 | 0.0411474 | 0.0247453 | BAD/CD38/CASR/NNAT/SIRT6/OXCT1/RAPGEF4/PCK2/SFRP1/PPP3CB/PSMD9/IFNG/PPARD/PARK7/SNX19/SERP1/SOX4/IL1B/NR1D1/PER2/HNF1A/GLUL/IL6/IL1RN/CCN3/ENSA/EPHA5/CAMK2G/GLUD1/TCF7L2/FOXO1/INHBB/SLC9B2/GPER1/CCDC186/PRKCE/BRSK2/LEP/SMAD2/PTPN11/MAFA/PRKN/KCNJ11/PIM3/SELENOT/TNF/TNF/TNF/TNF/TNF/TNF/TNF/TNF/CCL5/CCL5 | 55 |
| GO:1904659 | glucose transmembrane transport | 36/3662 | 108/15509 | 0.0136913 | 0.0412785 | 0.0248241 | IGF1/SLC2A3/SIRT6/GSK3A/RPS6KB1/PPARD/MAPK14/SLC2A1/NR4A3/IL1B/C3/SESN2/HNF1A/PIK3R1/POU4F2/APPL1/SLC2A6/PEA15/TERT/SLC27A4/SLC2A14/LEP/ERFE/PTPN11/ADIPOQ/SLC2A10/SLC5A3/TNF/TNF/TNF/TNF/TNF/TNF/TNF/TNF/GH1 | 36 |
| GO:2000113 | negative regulation of cellular macromolecule biosynthetic process | 52/3662 | 166/15509 | 0.0137127 | 0.0412785 | 0.0248241 | UPF1/EIF2AK2/ROCK1/MLH1/GSK3B/TUT7/AGO1/CIRBP/GZMB/PCIF1/JAK3/GSK3A/EXOSC3/DDX6/HBEGF/XRN1/NCL/PASK/PAIP2/TARDBP/CNOT1/ZFP36/SESN2/RARA/ITM2C/EIF4E2/IREB2/TOB1/EIF4A3/GRB7/POLR2D/CNOT9/EIF4EBP2/ZFP36L2/CNOT11/BTG2/ENC1/EIF2AK3/PAIP1/DCP2/PDE12/TYMS/SHMT1/CALR/ZFP36L1/YTHDF3/DAPK1/SLC2A10/GIGYF2/EIF6/LSM14A/AATF | 52 |
| GO:0001706 | endoderm formation | 21/3662 | 56/15509 | 0.0137493 | 0.0412785 | 0.0248241 | PAF1/LAMA3/MMP2/MMP9/DKK1/MACROH2A1/ITGA4/FN1/INHBA/COL5A1/DUSP5/ITGAV/HMGA2/NODAL/MMP14/DUSP2/ITGB2/SMAD2/GRB2/SETD2/NOG | 21 |
| GO:0043030 | regulation of macrophage activation | 21/3662 | 56/15509 | 0.0137493 | 0.0412785 | 0.0248241 | CD74/GRN/KARS1/FCGR2B/IL4R/PTPRC/HAMP/CTSC/IL4/WNT5A/NR1D1/SYT11/IL6/IL10/TLR4/THBS1/TNIP2/SHPK/CEBPA/PTPRC/MIF | 21 |
| GO:0090303 | positive regulation of wound healing | 21/3662 | 56/15509 | 0.0137493 | 0.0412785 | 0.0248241 | F7/MYLK/APOH/XBP1/FERMT1/PLAT/SERPINE1/SMOC2/HBEGF/CXCR4/CD36/THBS1/ITGB1/DMTN/PRDX2/PTK2/PRKCE/HRAS/F2/F2R/MTOR | 21 |
| GO:1904356 | regulation of telomere maintenance via telomere lengthening | 21/3662 | 56/15509 | 0.0137493 | 0.0412785 | 0.0248241 | SMG6/XRCC5/MAPKAPK5/HNRNPC/XRN1/POT1/DKC1/HNRNPA1/CCT7/PIF1/PARP1/CCT2/EXOSC10/DCP2/AURKB/MAPK15/SRC/SMG5/TEN1/RTEL1/TINF2 | 21 |
| GO:0002825 | regulation of T-helper 1 type immune response | 12/3662 | 27/15509 | 0.0137513 | 0.0412785 | 0.0248241 | SLC11A1/TBX21/IL4R/IL12RB1/IL27RA/JAK3/IL12B/CD80/IL1B/HLX/IL18/CCL19 | 12 |
| GO:0032816 | positive regulation of natural killer cell activation | 12/3662 | 27/15509 | 0.0137513 | 0.0412785 | 0.0248241 | TYROBP/IL12B/IL18/STAT5B/BLOC1S3/HLA-E/HLA-E/HLA-E/HLA-E/HLA-E/HLA-E/HLA-E | 12 |
| GO:0045943 | positive regulation of transcription by RNA polymerase I | 12/3662 | 27/15509 | 0.0137513 | 0.0412785 | 0.0248241 | DHX33/BAZ1B/SMARCB1/NCL/SF3B1/DEK/NOL11/MYBBP1A/SMARCA5/EIF2AK3/MTOR/SMARCB1 | 12 |
| GO:0048873 | homeostasis of number of cells within a tissue | 12/3662 | 27/15509 | 0.0137513 | 0.0412785 | 0.0248241 | BAX/P2RX7/GATA1/IL7/KRAS/NOTCH1/NOS3/PTPN11/F2R/CSF1/GIGYF2/AKT3 | 12 |
| GO:0061311 | cell surface receptor signaling pathway involved in heart development | 12/3662 | 27/15509 | 0.0137513 | 0.0412785 | 0.0248241 | SNAI2/TGFB1/BMPR1A/DKK1/WNT5A/BMP2/NOTCH2/NOTCH1/HEYL/RBPJ/GALNT11/NOG | 12 |
| GO:1901623 | regulation of lymphocyte chemotaxis | 12/3662 | 27/15509 | 0.0137513 | 0.0412785 | 0.0248241 | CCL2/NEDD9/WNT5A/PADI2/PTK2B/CCL21/CXCL13/CCL5/CCL5/CCL4/CCL4/CCL4 | 12 |
| GO:0002790 | peptide secretion | 66/3662 | 218/15509 | 0.0137596 | 0.0412785 | 0.0248241 | BAD/CD38/HFE/CD74/CASR/NNAT/SIRT6/OXCT1/RAPGEF4/PCK2/SFRP1/TFR2/PPP3CB/PSMD9/IFNG/PPARD/PASK/PARK7/CRHR1/SNX19/SERP1/SOX4/IL1B/NR1D1/PER2/HNF1A/GLUL/IL6/IL1RN/CCN3/ENSA/EPHA5/SLC16A2/CAMK2G/GLUD1/TCF7L2/FOXO1/INHBB/AIMP1/SLC9B2/GPER1/CCDC186/PRKCE/FGG/FGA/BRSK2/LEP/SMAD2/PTPN11/MAFA/PRKN/KCNJ11/TRPV1/PIM3/SELENOT/TNF/TNF/TNF/TNF/TNF/TNF/TNF/TNF/RASL10B/CCL5/CCL5 | 66 |
| GO:0006346 | DNA methylation-dependent heterochromatin formation | 10/3662 | 21/15509 | 0.0137795 | 0.0412785 | 0.0248241 | KDM1A/MBD3/AICDA/HDAC1/DNMT3A/HELLS/DNMT1/PPHLN1/TET1/L3MBTL3 | 10 |
| GO:0048670 | regulation of collateral sprouting | 10/3662 | 21/15509 | 0.0137795 | 0.0412785 | 0.0248241 | IFRD1/WNT3/SPP1/NGF/CRABP2/LPAR3/BDNF/DCC/WNT3/WNT3 | 10 |
| GO:0051016 | barbed-end actin filament capping | 10/3662 | 21/15509 | 0.0137795 | 0.0412785 | 0.0248241 | SCIN/ADD2/ADD1/MTPN/CAPZA1/RDX/GSN/FLII/IQANK1/TWF2 | 10 |
| GO:2000831 | regulation of steroid hormone secretion | 10/3662 | 21/15509 | 0.0137795 | 0.0412785 | 0.0248241 | CRY1/KDM5B/SPP1/CRHR1/CRY2/CYP19A1/REN/BMP6/GDF9/PTPN11 | 10 |
| GO:0010833 | telomere maintenance via telomere lengthening | 26/3662 | 73/15509 | 0.0138055 | 0.0413164 | 0.024847 | RAD51/SMG6/XRCC5/MAPKAPK5/HNRNPC/HSP90AB1/RAD50/XRN1/POT1/DKC1/HNRNPA1/CCT7/PIF1/PARP1/TERT/CCT2/EXOSC10/DCP2/AURKB/MAPK15/NOP10/SRC/SMG5/TEN1/RTEL1/TINF2 | 26 |
| GO:0031016 | pancreas development | 26/3662 | 73/15509 | 0.0138055 | 0.0413164 | 0.024847 | BAD/BAK1/GSK3B/MSLN/GSK3A/MET/PAX4/NPHP3/WNT5A/HES1/NR5A2/SOX4/NKX2-2/ALDH1A2/MNX1/MEN1/HNF1A/IL6/TCF7L2/BMP6/IL6R/SHH/CDH2/EIF2AK3/SMAD2/SELENOT | 26 |
| GO:0071322 | cellular response to carbohydrate stimulus | 41/3662 | 126/15509 | 0.0138538 | 0.041436 | 0.0249189 | BAD/CASR/CYBA/MAP2K4/PDK3/PRKACA/OPRK1/OXCT1/NOX4/ICAM1/SMARCB1/XBP1/PCK2/SLC39A14/PPP3CB/MAP2K6/PPARD/SLC29A1/FOXO3/SOX4/NR1D1/PRKAA1/MEN1/IGF1R/SMAD4/EPHA5/SLC9B2/GPER1/CCDC186/PRKCE/NPTX1/KAT5/BRSK2/LEP/ERN1/PLCB1/ZFP36L1/PIM3/SELENOT/SMARCB1/PRKACA | 41 |
| GO:0003148 | outflow tract septum morphogenesis | 11/3662 | 24/15509 | 0.0139056 | 0.041436 | 0.0249189 | FGFR2/LRP2/ENG/BMPR1A/NRP2/SMAD6/SMAD4/TGFBR2/ZFPM2/NKX2-5/PARVA | 11 |
| GO:0007064 | mitotic sister chromatid cohesion | 11/3662 | 24/15509 | 0.0139056 | 0.041436 | 0.0249189 | SMC1A/ATRX/SMC3/MACROH2A1/CDC20/SLF2/NAA50/PDS5A/MAU2/RB1/BOD1 | 11 |
| GO:0030730 | sequestering of triglyceride | 11/3662 | 24/15509 | 0.0139056 | 0.041436 | 0.0249189 | IL1B/OSBPL11/LPL/TNF/TNF/TNF/TNF/TNF/TNF/TNF/TNF | 11 |
| GO:0031571 | mitotic G1 DNA damage checkpoint signaling | 11/3662 | 24/15509 | 0.0139056 | 0.041436 | 0.0249189 | CASP2/CCND1/CDKN1A/PLK2/RPL26/RFWD3/TRIAP1/CHEK2/MUC1/GIGYF2/PRKDC | 11 |
| GO:0042659 | regulation of cell fate specification | 11/3662 | 24/15509 | 0.0139056 | 0.041436 | 0.0249189 | MBD3/RBBP7/ESRP1/BMPR1A/DKK1/CHD4/WNT5A/HDAC1/FGF2/RBBP4/GATAD2A | 11 |
| GO:0042832 | defense response to protozoan | 11/3662 | 24/15509 | 0.0139056 | 0.041436 | 0.0249189 | SLC11A1/IL4R/CD40/IL12B/ARG1/IL10/IRF4/IRF8/LYST/PF4/HRAS | 11 |
| GO:0046885 | regulation of hormone biosynthetic process | 11/3662 | 24/15509 | 0.0139056 | 0.041436 | 0.0249189 | H6PD/CYP27B1/PDE8B/EGR1/BMP2/IGF1R/ARNT/BMP6/WNT4/GFI1/ATP1A1 | 11 |
| GO:0070269 | pyroptosis | 11/3662 | 24/15509 | 0.0139056 | 0.041436 | 0.0249189 | GSDMB/GZMB/MEFV/PYCARD/GSDME/DPP9/ELANE/NAIP/NAIP/ELANE/NAIP | 11 |
| GO:0006402 | mRNA catabolic process | 59/3662 | 192/15509 | 0.0139127 | 0.0414372 | 0.0249196 | UPF1/SLC11A1/RNH1/EDC4/PUM2/ELAVL1/ROCK1/SMG6/MLH1/TUT7/XRN2/FUS/ALKBH5/HNRNPC/AGO1/CIRBP/ZC3H14/APEX1/SMG9/EXOSC3/LARP4B/CASC3/DDX5/MAPK14/XRN1/TARDBP/CNOT1/ZFP36/TTC5/NCBP1/TOB1/EIF4A3/POLR2D/CNOT9/ZFP36L2/CARHSP1/PRKCA/CNOT11/BTG2/MAPKAPK2/PRKCD/FASTK/EXOSC10/PAIP1/DCP2/ANGEL2/PDE12/ERN1/NPM1/RBM10/ZFP36L1/YTHDF3/SECISBP2/SMG5/GIGYF2/DXO/LSM2/RBM8A/TAF15 | 59 |
| GO:0032088 | negative regulation of NF-kappaB transcription factor activity | 28/3662 | 80/15509 | 0.0140318 | 0.0417519 | 0.0251089 | UFL1/FOXP3/SPI1/NFKBIA/BMP7/SETD6/PYCARD/TAX1BP1/TNFAIP3/CAT/RBCK1/FOXJ1/TRAF3/IL10/CYP1B1/ARRB2/COMMD7/PRMT2/GFI1/NOD2/PRDX2/DDIT3/TRAIP/IRAK1/USP7/TMSB4X/CHUK/ITCH | 28 |
| GO:0032465 | regulation of cytokinesis | 28/3662 | 80/15509 | 0.0140318 | 0.0417519 | 0.0251089 | SPAST/RHOA/CDC42/BIRC5/CDC6/SH3GLB1/CDC25B/RAB11A/TEX14/BECN1/PIN1/CDCA8/KIF13A/KIF23/BRCA2/IGF1R/BBS4/CALM2/PKP4/PLK2/CALM3/CXCR5/MAP9/PRKCE/BCL2L1/AURKB/SETD2/PDXP | 28 |
| GO:0048588 | developmental cell growth | 63/3662 | 207/15509 | 0.0140729 | 0.0418339 | 0.0251582 | IFRD1/PAFAH1B1/SPAG9/IGF1/CDH1/CYFIP2/NTN1/MAP2K4/GSK3B/SLC23A2/DPYSL2/HSP90AB1/ABL1/ADNP/SMAD7/HAMP/GSK3A/DVL1/CXCL12/PPP3CB/WNT3/DBN1/WNT5A/TTL/ITGA4/FN1/NRP2/SPP1/CXCR4/USP9X/FLRT3/APOE/NGF/DBNL/KIAA0319/ST8SIA2/APP/CRABP2/SYT2/SLIT2/C9orf72/ITGB1/POU4F2/PRMT2/DISC1/PDLIM5/TGFBR2/CDK5/SEMA4C/SEMA3E/LPAR3/LAMB2/RARG/BDNF/CDH4/SLIT3/PRKN/DCC/GDI1/CPNE1/TWF2/WNT3/WNT3 | 63 |
| GO:0050803 | regulation of synapse structure or activity | 63/3662 | 207/15509 | 0.0140729 | 0.0418339 | 0.0251582 | PAFAH1B1/NTN1/RHOA/VPS35/FCGR2B/GPC4/ABL1/ADNP/DKK1/HSPA8/NEDD9/MAPK14/DBN1/WNT5A/CDC20/NRP2/FLRT3/APOE/EPHB2/LRP4/DBNL/IL10/ACTR2/ABI2/CLSTN3/ST8SIA2/APP/TPBG/NTRK2/DISC1/PDLIM5/CDK5/VCP/SETD5/EFNA1/CDH2/NPTX1/CFL1/DAG1/BDNF/CDK5R1/OXTR/ADGRB1/EPHB3/THBS2/CLN3/IL1RAP/TUBB/SYNGAP1/SIPA1L1/DNM3/NTRK1/GPRASP3/TNF/TNF/TNF/TNF/TNF/TNF/TNF/TNF/SHANK3/PTEN | 63 |
| GO:0051604 | protein maturation | 92/3662 | 317/15509 | 0.0144389 | 0.0429014 | 0.0258002 | BAD/TMEM98/BAK1/NNAT/CYFIP2/F7/PRKACA/FBLN1/ZMPSTE24/ADAMTS2/FKBP1A/CPXM1/P2RX7/GLG1/APOH/MYH9/CTSG/PYCARD/PLAT/CASP2/TFR2/SERPINE1/PLGRKT/HGFAC/NAA40/PERP/KAT2B/SPCS1/FN1/SERPINC1/NAA50/SRGN/F13A1/SOX4/MYRF/CHAC1/CPLANE2/ADAM19/CPM/SERPINE2/SORL1/THBS1/ENPEP/FURIN/SNAPIN/PARP1/PSEN2/REN/CIAO1/CORIN/OGT/SNX12/GSN/IMMP1L/SERPINH1/CAST/MMP14/SPPL3/RUNX1/ADAMTS13/OMA1/CAPN2/MELTF/NAA15/CASP3/SHH/FXN/MYRFL/FADD/BMP1/FGG/FGA/RCE1/MAGEF1/CALR/ASPRV1/ANXA2/CNTN2/CLN3/MME/SRC/DDI2/DPP4/MAFB/PSENEN/MAGEA3/PISD/HP/CISD3/ADAMTS13/GGT1/PRKACA | 92 |
| GO:0009154 | purine ribonucleotide catabolic process | 17/3662 | 43/15509 | 0.0144663 | 0.0429623 | 0.0258368 | PDE4A/ACOT7/PDE8B/PDE4D/NT5C1A/ITPA/NT5E/NUDT7/PDE9A/HINT1/PDE7B/SUCLG2/PDE4B/ENTPD4/PNP/NUDT19/NUDT3 | 17 |
| GO:0006303 | double-strand break repair via nonhomologous end joining | 23/3662 | 63/15509 | 0.0145112 | 0.0430544 | 0.0258922 | IFFO1/PARP3/MLH1/XRCC5/TFIP11/POLA1/DNTT/NSD2/SHLD2/POLM/DEK/AUNIP/POT1/SMARCAL1/PAXX/HMGA2/MRNIP/NUDT16L1/KDM2A/LIG4/HMGB1/DCLRE1A/PRKDC | 23 |
| GO:0051298 | centrosome duplication | 23/3662 | 63/15509 | 0.0145112 | 0.0430544 | 0.0258922 | NDE1/NDC80/XPO1/CHMP5/CHMP4B/NUBP1/CEP152/ARHGEF10/CHORDC1/KAT2B/PKD2/CHMP1A/BRCA2/CEP131/PLK2/BRSK1/PDCD6IP/CEP135/NPM1/CEP63/NDE1/CHORDC1/SPICE1 | 23 |
| GO:0030100 | regulation of endocytosis | 57/3662 | 185/15509 | 0.0145872 | 0.043259 | 0.0260152 | SELE/HFE/CD22/AP2S1/EPHA3/ROCK1/CDC42/PICALM/ABL1/TSC2/EHD4/LILRB1/TFR2/SERPINE1/SFRP4/PPP3CB/DKK1/RAB5C/UNC119/IL4/WNT5A/SNX17/CLU/LRP1/C3/APOE/SYT11/CD36/AHI1/CCL21/ITGAV/EGF/ARRB2/ABL2/SNX12/BICD1/APPL1/LDLRAP1/CALM3/AP2M1/ALOX15/SYK/CD14/CCL19/ADIPOQ/ANXA2/BTBD9/MAGI2/CLN3/SRC/CD177/ITGB3/B2M/LILRB1/LILRB1/LILRB1/LILRB1 | 57 |
| GO:0002791 | regulation of peptide secretion | 54/3662 | 174/15509 | 0.0147671 | 0.0436237 | 0.0262346 | BAD/CD38/HFE/CD74/CASR/NNAT/SIRT6/OXCT1/PCK2/SFRP1/TFR2/PPP3CB/PSMD9/IFNG/PPARD/PASK/SERP1/SOX4/IL1B/NR1D1/PER2/GLUL/IL6/CCN3/ENSA/EPHA5/GLUD1/TCF7L2/FOXO1/INHBB/AIMP1/SLC9B2/GPER1/PRKCE/FGG/FGA/BRSK2/LEP/PTPN11/PRKN/KCNJ11/PIM3/SELENOT/TNF/TNF/TNF/TNF/TNF/TNF/TNF/TNF/RASL10B/CCL5/CCL5 | 54 |
| GO:0000022 | mitotic spindle elongation | 6/3662 | 10/15509 | 0.0148228 | 0.0436237 | 0.0262346 | BIRC5/KIF4A/CDCA8/NUMA1/KIF23/AURKB | 6 |
| GO:0000050 | urea cycle | 6/3662 | 10/15509 | 0.0148228 | 0.0436237 | 0.0262346 | CPS1/ARG2/SLC25A15/ARG1/ASS1/CEBPA | 6 |
| GO:0006527 | arginine catabolic process | 6/3662 | 10/15509 | 0.0148228 | 0.0436237 | 0.0262346 | ATP2B4/OAT/ARG2/ARG1/DDAH1/NOS3 | 6 |
| GO:0010533 | regulation of activation of Janus kinase activity | 6/3662 | 10/15509 | 0.0148228 | 0.0436237 | 0.0262346 | IL12B/IL6R/SOCS1/GH1/CCL5/CCL5 | 6 |
| GO:0010917 | negative regulation of mitochondrial membrane potential | 6/3662 | 10/15509 | 0.0148228 | 0.0436237 | 0.0262346 | BAX/RNF122/PMAIP1/ARL6IP5/PRELID1/TRPV1 | 6 |
| GO:0043653 | mitochondrial fragmentation involved in apoptotic process | 6/3662 | 10/15509 | 0.0148228 | 0.0436237 | 0.0262346 | VPS35/BAX/DNM1L/MFF/NPTX1/FIS1 | 6 |
| GO:0045628 | regulation of T-helper 2 cell differentiation | 6/3662 | 10/15509 | 0.0148228 | 0.0436237 | 0.0262346 | IL4R/BCL6/CD86/RARA/HLX/IL18 | 6 |
| GO:0045837 | negative regulation of membrane potential | 6/3662 | 10/15509 | 0.0148228 | 0.0436237 | 0.0262346 | BAX/RNF122/PMAIP1/ARL6IP5/PRELID1/TRPV1 | 6 |
| GO:0060068 | vagina development | 6/3662 | 10/15509 | 0.0148228 | 0.0436237 | 0.0262346 | BAK1/LRP2/BAX/ESR1/WNT5A/MERTK | 6 |
| GO:0060368 | regulation of Fc receptor mediated stimulatory signaling pathway | 6/3662 | 10/15509 | 0.0148228 | 0.0436237 | 0.0262346 | PTPRC/CSK/APPL1/PLSCR1/CD47/PTPRC | 6 |
| GO:0060601 | lateral sprouting from an epithelium | 6/3662 | 10/15509 | 0.0148228 | 0.0436237 | 0.0262346 | FGFR2/TP63/BMP7/WNT5A/SHH/NOG | 6 |
| GO:0070561 | vitamin D receptor signaling pathway | 6/3662 | 10/15509 | 0.0148228 | 0.0436237 | 0.0262346 | SNAI2/CYP27B1/VDR/TRIM24/MN1/KANK2 | 6 |
| GO:0072110 | glomerular mesangial cell proliferation | 6/3662 | 10/15509 | 0.0148228 | 0.0436237 | 0.0262346 | PDGFB/BMP7/PDGFRB/EGR1/IL6R/ITGB3 | 6 |
| GO:1903800 | positive regulation of miRNA maturation | 6/3662 | 10/15509 | 0.0148228 | 0.0436237 | 0.0262346 | TGFB1/DDX5/MYCN/IL6/EGFR/TRUB1 | 6 |
| GO:2000510 | positive regulation of dendritic cell chemotaxis | 6/3662 | 10/15509 | 0.0148228 | 0.0436237 | 0.0262346 | SPI1/C1QBP/CCR7/CCL21/LGALS9/CALR | 6 |
| GO:0050732 | negative regulation of peptidyl-tyrosine phosphorylation | 20/3662 | 53/15509 | 0.014832 | 0.04363 | 0.0262383 | MVP/HYAL2/PTPRC/PIBF1/SFRP1/SH2B3/PPP2CA/VPS25/NCAPG2/DMTN/PRKCD/PTPN2/CHMP6/SOCS1/NF2/LILRB4/PTPRC/LILRB4/LILRB4/LILRB4 | 20 |
| GO:0043299 | leukocyte degranulation | 25/3662 | 70/15509 | 0.014999 | 0.0440586 | 0.026496 | BTK/GAB2/C12orf4/SPI1/FCGR2B/STXBP2/IL4R/LAT2/HCK/GATA1/PIK3CG/IL4/SNX4/VAMP8/NR4A3/RAC2/STXBP1/CPLX2/KIT/ITGB2/SYK/LGALS9/PTAFR/ITGAM/CD177 | 25 |
| GO:0043966 | histone H3 acetylation | 25/3662 | 70/15509 | 0.014999 | 0.0440586 | 0.026496 | SPI1/ATXN7L3/BRPF3/SMARCB1/JADE3/GATA3/ZNF451/KAT2B/DR1/LIF/WBP2/TAF5L/IRF4/BRCA2/SMAD4/KAT14/MBIP/BRPF1/TAF6L/TADA3/TAF7/WDR5/TRRAP/SMARCB1/TADA2A | 25 |
| GO:1903317 | regulation of protein maturation | 25/3662 | 70/15509 | 0.014999 | 0.0440586 | 0.026496 | TMEM98/PRKACA/GLG1/MYH9/PLAT/TFR2/SERPINE1/PLGRKT/SERPINC1/SOX4/CHAC1/SERPINE2/THBS1/SNX12/GSN/CAST/MMP14/RUNX1/MELTF/ANXA2/CNTN2/CLN3/SRC/MAGEA3/PRKACA | 25 |
| GO:0010717 | regulation of epithelial to mesenchymal transition | 33/3662 | 98/15509 | 0.0151526 | 0.0444887 | 0.0267547 | EPHA3/BMP7/SMAD7/SFRP1/TGFB1/EZH2/TGFBR1/ENG/GATA3/MDK/PPP2CA/IL1B/BMP2/LOXL2/SPRY2/IL6/NKX2-1/SMAD4/NOTCH1/TCF7L2/ADIPOR1/TGFBR2/EFNA1/PTK2/DAG1/SMAD2/NOG/ZNF703/BCL9L/SPRED2/MTOR/MCRIP1/PTEN | 33 |
| GO:0050708 | regulation of protein secretion | 70/3662 | 234/15509 | 0.0151962 | 0.0445957 | 0.0268191 | BAD/CD38/RHBDF1/IGF1/CASR/NNAT/VPS35/LLGL2/SIRT6/OXCT1/ACHE/DNM1L/P2RX7/PCK2/PARD6A/SFRP1/KCNN4/TGFB1/CD33/PPP3CB/PSMD9/IFNG/PPARD/APBB3/IL12B/IL1A/P3H1/SERP1/SOX4/IL1B/NR1D1/APOE/PER2/GLUL/IL6/TLR4/CCN3/ENSA/EPHA5/GLUD1/TCF7L2/VEGFC/FOXO1/BMP6/INHBB/SLC9B2/ARFIP1/GPER1/ADAM9/PRKCE/FGG/FGA/BRSK2/LEP/PTPN11/F2R/PRKN/KCNJ11/PPIA/PIM3/TNF/TNF/TNF/TNF/TNF/TNF/TNF/TNF/CCL5/CCL5 | 70 |
| GO:0046031 | ADP metabolic process | 31/3662 | 91/15509 | 0.0153096 | 0.0449071 | 0.0270063 | BAD/AK2/SLC4A1/IGF1/PKM/SIRT6/P2RX7/GPI/AK1/ENO3/ALDOC/IFNG/CBFA2T3/PRKAA1/NT5E/APP/ARNT/PKLR/OGT/AK3/AK5/SLC2A6/AK4/GPD1/DDIT4/PGAM1/MTOR/EIF6/PKLR/GPI/LDHA | 31 |
| GO:0050680 | negative regulation of epithelial cell proliferation | 43/3662 | 134/15509 | 0.0153665 | 0.0450527 | 0.0270939 | SNAI2/RUNX3/NGFR/FGFR2/RAP1GAP/APOH/FLT1/SFRP1/TGFB1/TGFBR1/GATA3/CCL2/VDR/PPARD/IL12B/WNT5A/STAT1/IRF6/KLF9/TRIM24/CDKN1C/APOE/MEN1/THBS1/BRCA2/RB1/DUSP10/NOTCH1/ZEB1/AIMP1/SCG2/TNF/TNF/TNF/TNF/TNF/TNF/TNF/TNF/B2M/CDKN1C/PTEN/TINF2 | 43 |
| GO:0038084 | vascular endothelial growth factor signaling pathway | 16/3662 | 40/15509 | 0.0154121 | 0.0451224 | 0.0271358 | DCN/FLT4/FLT1/PRKD2/HSPB1/SMOC2/IL12B/PDGFRB/NRP2/PGF/FLT3/KDR/PDGFRA/SPRY2/VEGFC/PTP4A3 | 16 |
| GO:0048713 | regulation of oligodendrocyte differentiation | 16/3662 | 40/15509 | 0.0154121 | 0.0451224 | 0.0271358 | TMEM98/TNFRSF1B/WDR1/TP73/PTN/MDK/HES1/HDAC1/CXCR4/NKX2-2/DUSP10/TNFRSF21/NOTCH1/SHH/DAG1/MTOR | 16 |
| GO:0071459 | protein localization to chromosome, centromeric region | 16/3662 | 40/15509 | 0.0154121 | 0.0451224 | 0.0271358 | CENPQ/NDC80/ZW10/H2BC11/KNL1/RB1/BOD1/CDK1/ZWILCH/AURKB/RCC2/H4C15/H4C14/H4C12/H4C5/H4C4 | 16 |
| GO:0046324 | regulation of glucose import | 22/3662 | 60/15509 | 0.0157247 | 0.0460158 | 0.0276731 | IGF1/SIRT6/GSK3A/RPS6KB1/MAPK14/PIK3R1/POU4F2/APPL1/PEA15/TERT/LEP/ERFE/PTPN11/ADIPOQ/TNF/TNF/TNF/TNF/TNF/TNF/TNF/TNF | 22 |
| GO:0045739 | positive regulation of DNA repair | 36/3662 | 109/15509 | 0.0159039 | 0.0465184 | 0.0279754 | PARP3/ARID1B/FAM168A/TMEM161A/ACTB/SIRT6/FUS/BCL7C/SMARCB1/RBBP8/EYA1/SMARCD2/BCL7A/FOXM1/EYA4/INO80D/ARID1A/SLF2/SHLD2/MORF4L2/YEATS4/EPC2/ACTR2/PARP1/EGFR/CCDC117/MRNIP/BRD7/MGMT/KAT5/H2AX/ARID2/HMGB1/TRRAP/PRKDC/SMARCB1 | 36 |
| GO:0002753 | cytoplasmic pattern recognition receptor signaling pathway | 19/3662 | 50/15509 | 0.0159856 | 0.0466911 | 0.0280792 | BIRC3/PUM2/NFKBIA/RIOK3/C1QBP/MAP2K6/TNFAIP3/IRF3/PTPN22/TLR4/DDX60/SLC15A4/NLRX1/CLPB/NOD2/RELA/LACC1/LSM14A/ITCH | 19 |
| GO:0032924 | activin receptor signaling pathway | 19/3662 | 50/15509 | 0.0159856 | 0.0466911 | 0.0280792 | FKBP1A/SMAD7/TGFBR1/TGIF2/INHBA/MEN1/SMAD4/NODAL/SKI/INHBB/TGFBR2/SHH/SMAD2/MAGI2/CSNK2B/CSNK2B/CSNK2B/CSNK2B/CSNK2B | 19 |
| GO:0060038 | cardiac muscle cell proliferation | 19/3662 | 50/15509 | 0.0159856 | 0.0466911 | 0.0280792 | FGFR2/TP73/ABL1/NDRG4/TGFBR1/BMPR1A/MAPK14/FGF2/NOTCH1/SKI/RUNX1/TGFBR2/RBPJ/ZFPM2/CDK1/NKX2-5/NOG/ARID2/PTEN | 19 |
| GO:0043270 | positive regulation of ion transport | 77/3662 | 261/15509 | 0.015996 | 0.0466997 | 0.0280844 | CNTN1/FHL1/BAK1/CASR/KCNQ1/KCNH2/PKP2/VMP1/MYLK/ACTB/ACTN2/OPRK1/P2RX5/ABCB1/BAX/P2RX7/ABL1/PDGFB/KCNN4/JAK3/SCN1B/CXCL12/PPP3CB/CCL2/MAP2K6/IFNG/PDGFRB/SNX4/IL1A/VAMP8/PKD2/KCNJ2/IL1B/HSPA2/EPHB2/STXBP1/COX17/ARRB2/TNFRSF11A/CALM2/STAC/ANK2/GSTO1/ITGB1/CNKSR3/MS4A1/STC1/CALM3/GPER1/CDK5/CHP2/STIM1/AHCYL1/ADRB2/PTAFR/KIF5B/CEBPB/LEP/PDZK1/GRIN1/CD19/F2/OXTR/F2R/CACNB4/NKX2-5/STAC3/P2RX2/TMSB4X/STIMATE/SHANK3/CCL5/CCL5/CCL4/CCL4/MIF/CCL4 | 77 |
| GO:0090276 | regulation of peptide hormone secretion | 53/3662 | 171/15509 | 0.0160082 | 0.0467133 | 0.0280925 | BAD/CD38/HFE/CASR/NNAT/SIRT6/OXCT1/PCK2/SFRP1/TFR2/PPP3CB/PSMD9/IFNG/PPARD/PASK/SERP1/SOX4/IL1B/NR1D1/PER2/GLUL/IL6/CCN3/ENSA/EPHA5/GLUD1/TCF7L2/FOXO1/INHBB/AIMP1/SLC9B2/GPER1/PRKCE/FGG/FGA/BRSK2/LEP/PTPN11/PRKN/KCNJ11/PIM3/SELENOT/TNF/TNF/TNF/TNF/TNF/TNF/TNF/TNF/RASL10B/CCL5/CCL5 | 53 |
| GO:0060828 | regulation of canonical Wnt signaling pathway | 68/3662 | 227/15509 | 0.016016 | 0.0467139 | 0.0280929 | SNAI2/PTPRU/CDH3/FGFR2/VPS35/GSK3B/GSKIP/CHD8/FERMT1/AXIN1/SFRP1/TLE5/TGFB1/GSK3A/SFRP4/DKK1/FOLR1/MDK/MAPK14/NPHP3/KPNA1/WNT5A/IGFBP2/HDAC1/FOXO3/SFRP5/EGR1/RECK/PFDN5/SOX4/BMP2/PIN1/APOE/LRP4/APC/PPM1B/FGF2/EGF/CSNK1D/RBMS3/TPBG/EGFR/NOTCH1/TCF7L2/FOXO1/HHEX/GNAQ/FRZB/SHH/VCP/AMER2/BTRC/RBPJ/ZEB2/CTNND2/CDH2/FZD4/DDIT3/CTNNBIP1/NKX2-5/NOG/ZNF703/NOTUM/PRKN/RNF220/FZD9/SRC/NRARP | 68 |
| GO:0002065 | columnar/cuboidal epithelial cell differentiation | 34/3662 | 102/15509 | 0.0162429 | 0.0473534 | 0.0284775 | BAD/PRDM1/FGFR2/TP63/PGR/GSK3B/ABL1/BMP7/GSK3A/HOXA5/SERPINE1/BCCIP/WNT5A/HES1/NR5A2/SOX4/NKX2-2/BMP2/RARA/MEN1/FGF2/NOTCH1/BMP6/NODAL/WNT4/CDH2/CEBPB/RARG/TYMS/FAM20C/YIPF6/POU3F2/TUBB/SRC | 34 |
| GO:0042273 | ribosomal large subunit biogenesis | 24/3662 | 67/15509 | 0.0162964 | 0.0474871 | 0.0285579 | RPL26L1/NOP16/RRP15/DDX18/RPL6/PES1/SNU13/NOP2/BRIX1/EBNA1BP2/RPL7L1/HEATR3/RPL26/NOL9/NSA2/RPL10L/MRPL1/NPM1/NOC2L/RPL23A/SDAD1/RPL10A/EIF6/BOP1 | 24 |
| GO:0006458 | 'de novo' protein folding | 15/3662 | 37/15509 | 0.0163652 | 0.0475312 | 0.0285844 | CD74/HSPA5/FKBP1A/BAG1/HSPA8/HSPA9/HSPE1/HSPA2/DNAJB12/CCT2/HSPA1L/HSPA1L/HSPA1L/HSPA1L/HSPA1L | 15 |
| GO:0010453 | regulation of cell fate commitment | 15/3662 | 37/15509 | 0.0163652 | 0.0475312 | 0.0285844 | MBD3/TBX21/IL12RB1/RBBP7/ESRP1/BMPR1A/DKK1/CHD4/IL12B/WNT5A/HES1/HDAC1/FGF2/RBBP4/GATAD2A | 15 |
| GO:0042554 | superoxide anion generation | 15/3662 | 37/15509 | 0.0163652 | 0.0475312 | 0.0285844 | NOX1/TYROBP/CYBA/NOX4/ACP5/TGFB1/SH3PXD2A/SOD1/ITGB2/PRKCD/SYK/CYBB/ITGAM/CD177/AATF | 15 |
| GO:0044788 | modulation by host of viral process | 15/3662 | 37/15509 | 0.0163652 | 0.0475312 | 0.0285844 | LTF/YTHDC2/CDC42/CCNK/VAPA/HSPA8/APOE/EEF1A1/PSMC3/PAIP1/CFL1/CSF1R/PRKN/IGF2R/ZBED1 | 15 |
| GO:0045454 | cell redox homeostasis | 15/3662 | 37/15509 | 0.0163652 | 0.0475312 | 0.0285844 | SLC11A1/GLRX2/DLD/APEX1/GSR/PRDX1/PRDX6/CHD6/NOS3/PRDX2/DDIT3/NQO1/SLC2A10/TXNRD1/SELENOT | 15 |
| GO:0045730 | respiratory burst | 15/3662 | 37/15509 | 0.0163652 | 0.0475312 | 0.0285844 | MPO/NOX1/SLC11A1/GRN/CYBA/HCK/PIK3CG/RAC2/DUSP10/CYBB/PRDX2/CD52/PGAM1/CD55/CD24 | 15 |
| GO:1902275 | regulation of chromatin organization | 15/3662 | 37/15509 | 0.0163652 | 0.0475312 | 0.0285844 | KDM1A/ZNHIT1/AICDA/DNMT1/PPHLN1/TET1/TLK2/MKI67/SSRP1/LSM11/TAL1/SETD5/KAT5/PHF2/L3MBTL3 | 15 |
| GO:0002275 | myeloid cell activation involved in immune response | 30/3662 | 88/15509 | 0.0166788 | 0.0484192 | 0.0291185 | BTK/TYROBP/GRN/GAB2/C12orf4/KARS1/SPI1/STXBP2/IL4R/LAT2/GATA1/PYCARD/PIK3CG/IFNG/IL4/SNX4/VAMP8/NR4A3/RAC2/STXBP1/CPLX2/KIT/ITGB2/SYK/CX3CR1/LGALS9/PTAFR/ITGAM/PRKCE/CD177 | 30 |
| GO:0007492 | endoderm development | 28/3662 | 81/15509 | 0.0167249 | 0.0485076 | 0.0291716 | PAF1/LAMA3/MMP2/MMP9/BMPR1A/DKK1/MACROH2A1/ITGA4/FN1/HDAC1/INHBA/COL5A1/LAMC1/NKX2-1/DUSP5/ITGAV/SMAD4/NOTCH1/HMGA2/NODAL/MMP14/DUSP2/ITGB2/SMAD2/GRB2/SETD2/NOG/ZFP36L1 | 28 |
| GO:0010965 | regulation of mitotic sister chromatid separation | 28/3662 | 81/15509 | 0.0167249 | 0.0485076 | 0.0291716 | CDC27/ARID1B/ACTB/NDC80/ZW10/ANAPC5/BIRC5/CDC6/BCL7C/SMARCB1/SMARCD2/BCL7A/FBXO5/CDC20/ARID1A/TEX14/CCNB1/CDCA8/APC/CENPE/RB1/SPC25/BRD7/BUB1/ZWILCH/AURKB/ARID2/SMARCB1 | 28 |
| GO:1901888 | regulation of cell junction assembly | 58/3662 | 190/15509 | 0.0168055 | 0.0487188 | 0.0292986 | SNAI2/EPHA3/NTN1/RHOA/ROCK1/VPS35/PRKACA/GPC4/ABL1/ADNP/TJP1/SFRP1/RAPGEF1/DKK1/CORO1C/IL17A/WNT5A/TEK/IL1B/FLRT3/KDR/EPHB2/THBS1/CLSTN3/ST8SIA2/APP/EPHA2/TPBG/NTRK2/MMP14/DMTN/WNT4/PDLIM5/SETD5/PTK2/LIMS1/NPTX1/BDNF/RCC2/OXTR/ADGRB1/EPHB3/THBS2/IL1RAP/SRC/NTRK1/GPRASP3/TNF/TNF/TNF/TNF/TNF/TNF/TNF/TNF/TJP1/PTEN/PRKACA | 58 |
| GO:0035265 | organ growth | 48/3662 | 153/15509 | 0.0168558 | 0.0488417 | 0.0293726 | IGF1/MAP2K4/FGFR2/FGFR3/TP73/ZMPSTE24/ESR1/ABL1/NDRG4/IL7/HAMP/GSK3A/TGFBR1/BMPR1A/MAPK14/PDGFRB/LEPR/SERP1/RARA/SPRY2/HLX/CYP19A1/FGF2/SOD1/NOTCH1/BCL2L11/SKI/STC1/RUNX1/PDLIM5/TGFBR2/SHH/FXN/RBPJ/ZFPM2/CDK1/S1PR1/RARG/LEP/RAG2/SMAD2/PTPN11/PLAG1/NKX2-5/NOG/ARID2/COL27A1/PTEN | 48 |
| GO:0031623 | receptor internalization | 37/3662 | 113/15509 | 0.0168892 | 0.0489157 | 0.029417 | SELE/CD9/AP2S1/PICALM/ACHE/LILRB1/SFRP4/DKK1/CD81/LRP1/CD36/AHI1/EGF/ARRB2/ITGB1/LDLRAP1/ITGB2/AP2M1/CXCR1/SYK/CXCL8/GRB2/CXCR2/ANXA2/CNTN2/HGS/LILRB4/MAGI2/DNM3/ITGB3/LILRB1/LILRB4/LILRB1/LILRB1/LILRB1/LILRB4/LILRB4 | 37 |
| GO:0030219 | megakaryocyte differentiation | 21/3662 | 57/15509 | 0.0170347 | 0.049314 | 0.0296566 | SCIN/GATA1/SH2B3/MYB/PRMT1/MEIS1/GABPA/KIT/ZNF385A/TAL1/RBM15/PF4/MAF/PTPN11/CIB1/EIF6/H4C15/H4C14/H4C12/H4C5/H4C4 | 21 |
| GO:0043303 | mast cell degranulation | 18/3662 | 47/15509 | 0.0172099 | 0.0497745 | 0.0299335 | BTK/GAB2/C12orf4/STXBP2/IL4R/LAT2/GATA1/PIK3CG/IL4/SNX4/VAMP8/NR4A3/RAC2/STXBP1/CPLX2/KIT/SYK/LGALS9 | 18 |
| GO:1902041 | regulation of extrinsic apoptotic signaling pathway via death domain receptors | 18/3662 | 47/15509 | 0.0172099 | 0.0497745 | 0.0299335 | HGF/SP100/GSK3B/ICAM1/SFRP1/SERPINE1/PARK7/TNFAIP3/THBS1/PMAIP1/FAIM/PEA15/ATF3/NOS3/BCL2L1/FGG/FGA/PTEN | 18 |
| GO:0003203 | endocardial cushion morphogenesis | 14/3662 | 34/15509 | 0.0173037 | 0.0499759 | 0.0300546 | SNAI2/BMP7/TGFBR1/ENG/BMPR1A/BMP2/CPLANE2/SMAD4/NOTCH1/TGFBR2/HEYL/NOS3/RBPJ/NOG | 14 |
| GO:0010742 | macrophage derived foam cell differentiation | 14/3662 | 34/15509 | 0.0173037 | 0.0499759 | 0.0300546 | SOAT1/APOB/NFKBIA/TGFB1/STAT1/CD36/ITGAV/IL18/PF4/CSF2/LPL/ADIPOQ/CSF1/ITGB3 | 14 |
| GO:1900077 | negative regulation of cellular response to insulin stimulus | 14/3662 | 34/15509 | 0.0173037 | 0.0499759 | 0.0300546 | TSC2/GSK3A/RPS6KB1/NCL/NCOA5/IL1B/PRKAA1/PRKCD/ZNF592/SLC27A4/PTPN2/LPL/SOCS1/PIP4K2B | 14 |
Tip
Instead of saving just the results summary from the ego object, it might also be beneficial to save the object itself. The save() function enables you to save it as a .rda file, e.g. save(ego, file="results/ego.rda"). The complementary function to save() is the function load(), e.g.
ego <- load(file="results/ego.rda").
This is a useful set of functions to know, since it enables one to preserve analyses at specific stages and reload them when needed. More information about these functions can be found here & here.
Tip
You can also perform GO enrichment analysis with only the up or down regulated genes** in addition to performing it for the full list of significant genes. This can be useful to identify GO terms impacted in one direction and not the other. If very few genes are in any of these lists (< 50, roughly) it may not be possible to get any significant GO terms.
Exercise 1
Create two new GO enrichment analyses one with UP and another for DOWN regulated genes for Control vs Vampirium.
Solution to Exercise 1
- Separate results into UP and DOWN regulated:
sigCont_UP <- sigCont %>% filter(log2FoldChange > 0)
sigCont_DOWN <- sigCont %>% filter(log2FoldChange < 0)
- Run overrepresentation:
UP regulated genes
ego_UP <- enrichGO(gene = sigCont_UP$gene,
                universe = allCont_genes,
                keyType = "ENSEMBL",
                OrgDb = org.Hs.eg.db,
                ont = "BP",
                pAdjustMethod = "BH",
                qvalueCutoff = 0.05,
                readable = TRUE)
DOWN regulated genes
ego_DOWN <- enrichGO(gene = sigCont_DOWN$gene,
                universe = allCont_genes,
                keyType = "ENSEMBL",
                OrgDb = org.Hs.eg.db,
                ont = "BP",
                pAdjustMethod = "BH",
                qvalueCutoff = 0.05,
                readable = TRUE)
- Check results:
Visualizing clusterProfiler results
clusterProfiler has a variety of options for viewing the over-represented GO terms. We will explore the dotplot, enrichment plot, and the category netplot.
The dotplot shows the number of genes associated with the first terms (size) and the p-adjusted values for these terms (color). This plot displays the top 20 GO terms by gene ratio (# genes related to GO term / total number of sig genes), not p-adjusted value.
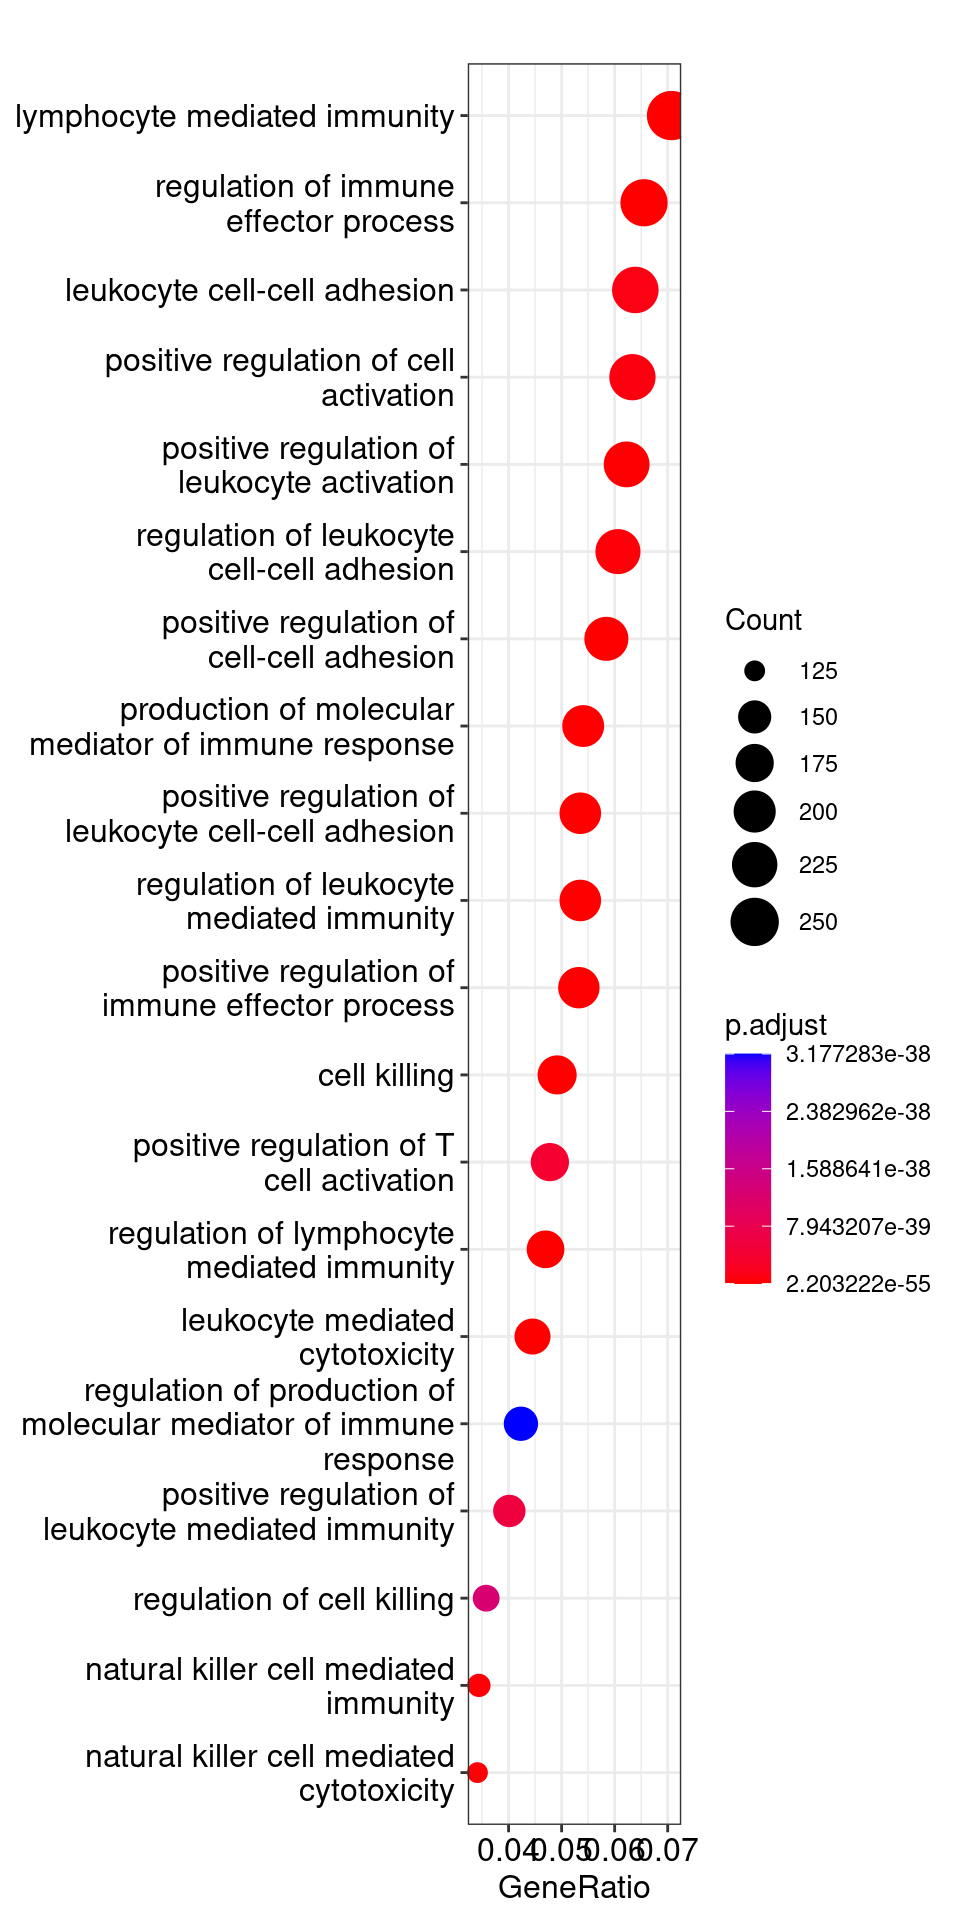
The next plot is the enrichment GO plot, which shows the relationship between the top 50 most significantly enriched GO terms (padj.), by grouping similar terms together. Before creating the plot, we will need to obtain the similarity between terms using the pairwise_termsim() function instructions for emapplot. In the enrichment plot, the color represents the p-values relative to the other displayed terms (brighter red is more significant), and the size of the terms represents the number of genes that are significant from our list.
# Add similarity matrix to the termsim slot of enrichment result
ego <- enrichplot::pairwise_termsim(ego)
# Enrichmap clusters the 50 most significant (by padj) GO terms to visualize relationships between terms
emapplot(ego, showCategory = 50)
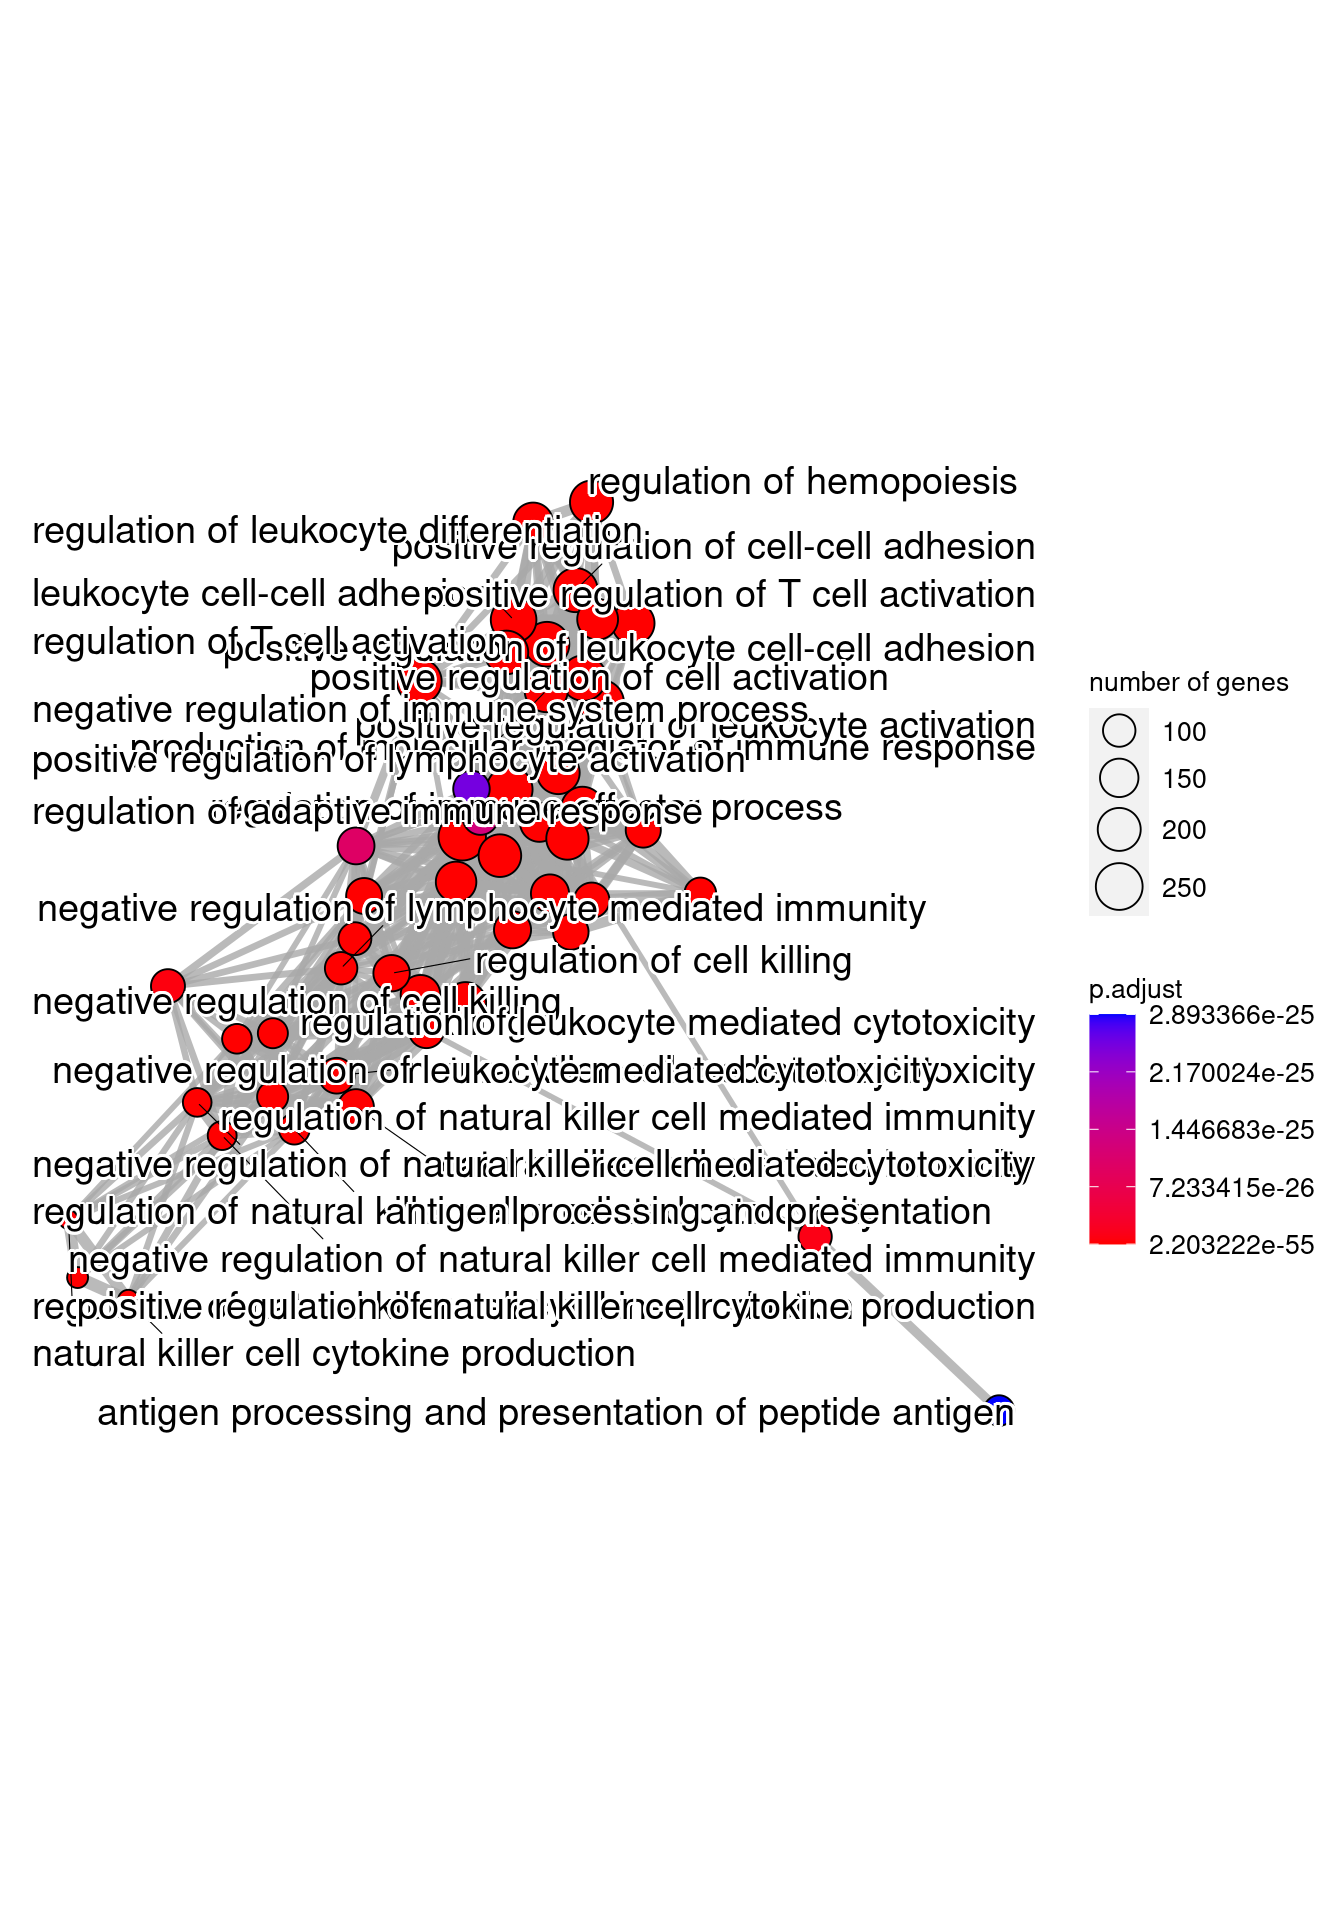
Finally, the category netplot shows the relationships between the genes associated with the top five most significant GO terms and the fold changes of the significant genes associated with these terms (color). The size of the GO terms reflects the pvalues of the terms, with the more significant terms being larger. This plot is particularly useful for hypothesis generation in identifying genes that may be important to several of the most affected processes.
Warning
You may need to install the ggnewscale package using install.packages("ggnewscale") for the cnetplot() function to work.
# To color genes by log2 fold changes, we need to extract the log2 fold changes from our results table creating a named vector
Cont_foldchanges <- sigCont$log2FoldChange

names(Cont_foldchanges) <- sigCont$gene
# Cnetplot details the genes associated with one or more terms - by default gives the top 5 significant terms (by padj)
cnetplot(ego,
         categorySize="pvalue",
         showCategory = 5,
         foldChange=Cont_foldchanges,
         vertex.label.font=6)
Tip
If some of the high fold changes are getting drowned out due to a large range, you could set a maximum fold change value
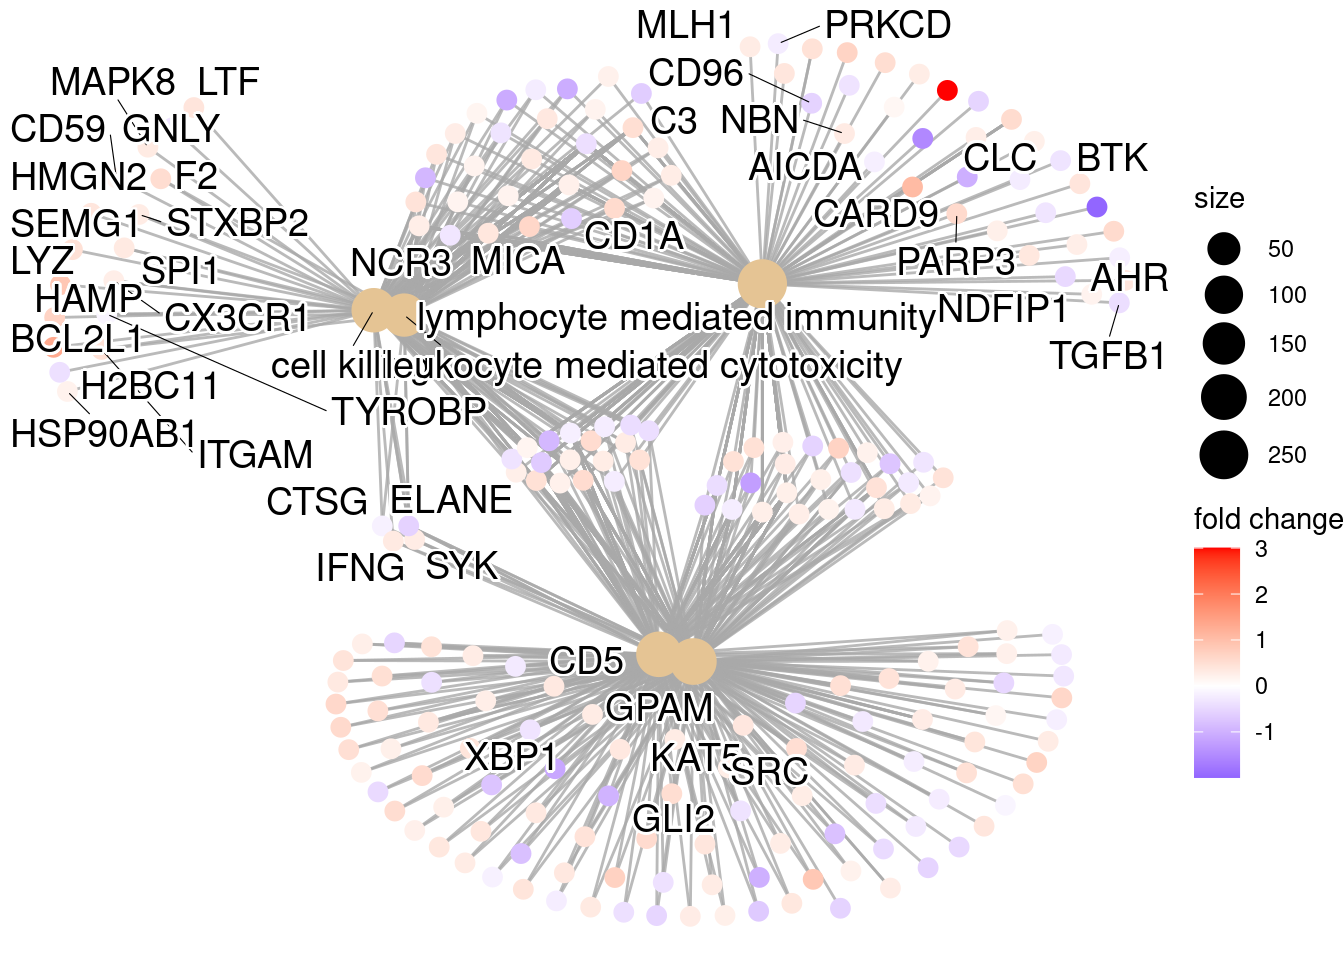
Tip
If you are interested in significant processes that are not among the top five, you can subset your ego dataset to only display these processes:
# Subsetting the ego results without overwriting original `ego` variable
ego2 <- ego

ego2@result <- ego@result[c(1,3,4,8,9),]

# Plotting terms of interest
cnetplot(ego2,
     categorySize="pvalue",
     foldChange=Cont_foldchanges,
     showCategory = 5,
     vertex.label.font=6)
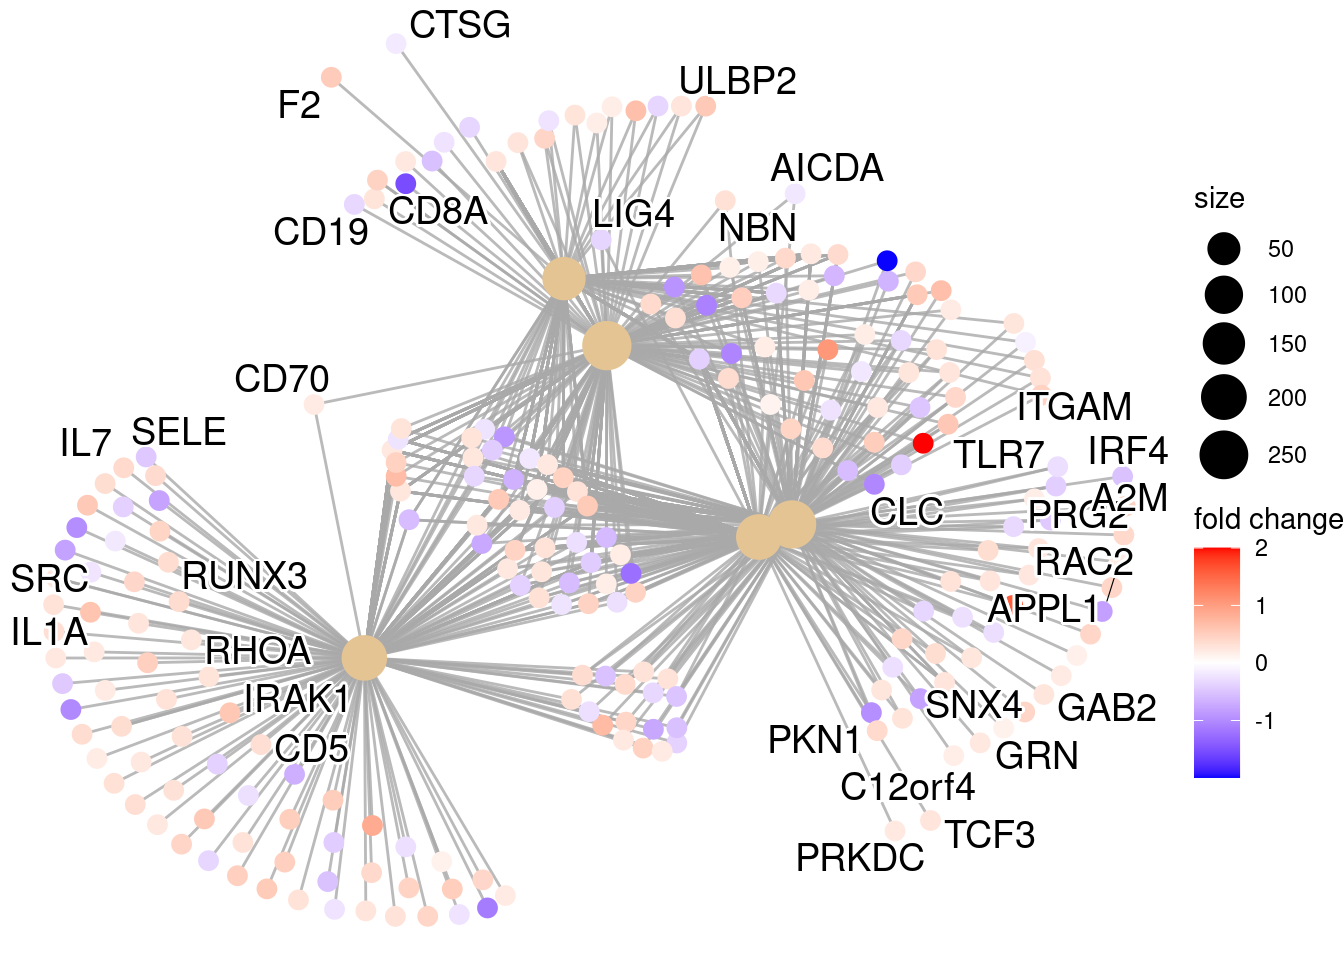
Exercise 2
Run a Disease Ontology (DO) overrepresentation analysis using the enrichDO() function. NOTE the arguments are very similar to the previous examples.
- Do you find anything interesting?
Solution to Exercise 2
For the DO, we need to use entrez IDs, instead of gene IDs
All significantly regulated genes.
UP significantly regulated genes
DOWN significantly regulated genes
Based on these results, we see that we cannot find Fragile X syndrome between the significant ones. However, if we dig a bit deeper, we find that many of these diseases overlap with the symptoms of Fragile X syndrome, such as muscular atrophia, physical disorders, intelectual disabilities, etc.
Exercise 3
Run an enrichment analysis on the results of the DEA for Garlicum vs Vampirium samples. Remember to use the annotated results!
Solution to Exercise 3
Let's do a simple analysis as an example:
## Create background dataset for hypergeometric testing using all genes tested for significance in the results
allGar_genes <- dplyr::filter(res_ids_Gar, !is.na(gene)) %>%
  pull(gene) %>%
  as.character()

## Extract significant results
sigGar <- dplyr::filter(res_ids_Gar, padj < 0.05 & !is.na(gene))

sigGar_genes <- sigGar %>%
  pull(gene) %>%
  as.character()
Now we can perform the GO enrichment analysis and save the results:
This lesson was originally developed by members of the teaching team (Mary Piper, Radhika Khetani) at the Harvard Chan Bioinformatics Core (HBC).
Created: November 28, 2023