Breast Cancer Proteomics Module
🕰 Total Time Estimation: 8 hours
💬 Learning Objectives:
- Understand the workflow of the study.
- Retrieve and understand the study design and data from selected papers.
- Download and preprocess proteomics data using FragPipe.
- Set up and use FragPipe for TMT-labeled MS data analysis.
- Create accurate annotation files for data analysis.
Welcome to the MS Data Analysis Module
In this module, you will learn about mass spectrometry (MS) data analysis using Tandem Mass Tag (TMT)–labeled data, focusing on insights from a breast cancer study. This module is designed to guide you through key stages of MS data analysis, from preparation to advanced analysis, ensuring accurate quantification of TMT-labeled data.
The module is divided into three sections:
- Preliminary Work
- Explore the study design.
- Retrieve relevant datasets.
- Prepare essential files for downstream analysis.
- Analysis of MS Data Using FragPipe
- Data processing with FragPipe.
- Set up workflows tailored to TMT-labeled samples.
- Run MS data analysis.
- Data Screening, Multivariate Analysis, and Clustering
- Techniques for screening and organizing results.
- Multi-variate analysis and clustering.
- Reveal meaningful patterns in the dataset.
By the end of this module, you will be equipped to manage TMT-labeled proteomics data and conduct detailed analyses crucial in clinical proteomics research.
Let’s get started!
Part 1: Preliminary work
For this work, we will use the data that was used and analyzed in the paper Breast cancer quantitative proteome and proteogenomic landscape by Johansson et al., which compares subgroups of breast cancer tumors from the Oslo2 Landscape cohort.
Before delving into the actual analysis of the data in FragPipe, we must initially:
- Read and understand the study design of the paper.
- Understand the data being used from the paper.
Questions for Understanding the Paper
To better understand the paper, we have formulated some questions that should help clarify the study design, aim, and overall scope of the work. These questions are listed below:
What are the primary research goals of this study?
How is the study design structured to achieve the study objective?
What role does LC-MS/MS play in this study, and why was it chosen as a method?
What novel insights were gained from the proteogenomic approach used in this study?
Supplementary Data
Before we proceed and download the data available from the paper, we must first delve into some of the details in Supplementary Data. Your first task is to look through the Supplementary Data and find the annotation relating the tumor types to the isotopic labels used.
How did you find the required information? Describe the steps you took. How much time did it take?
If you have not been able to find the annotations, open Supplementary Data 1, and then go to the tab called “Tumor annotations”.
To better understand the supplementary data, we have prepared guiding questions to aid in interpreting the table. You can find the supplementary data in the paper here.
Provide a brief description of the content presented in the table.
What information does the tumor ID represent?
Briefly describe TMT-labeled mass spectrometry proteomics data and explain the experimental procedure involved.
Part 2: Analysis of MS Data Using FragPipe
In this section of the teaching module, we will work with data from the paper. The first task is to download sample files from the paper, guided by the questions provided below:
Where can the data be found?
What is the ProteomeXChange database?
What accession code is used for the data deposited in ProteomeXChange?
By examining the accession code for the data deposited on ProteomeXChange, we can access and download the data using FTP.
What is FTP, and what is its functionality?
To download the data, we will use the Proteomics Sandbox Application on UCloud. This platform provides the necessary storage capacity and computational power to perform this process.
The Proteomics Sandbox Application is a virtual environment that includes various software tools, such as FragPipe, for analyzing proteomics data.
First, we will download the data for the sample files to be used in FragPipe. Then, we will launch FragPipe to run the first analysis of the data. Before doing so, we have some questions regarding FragPipe and its usability:
What is FragPipe, and what are its applications?
If FragPipe was not used for this part of the teaching module, which alternative software tools could be employed? Please provide a few examples.
What are the benefits of using FragPipe?
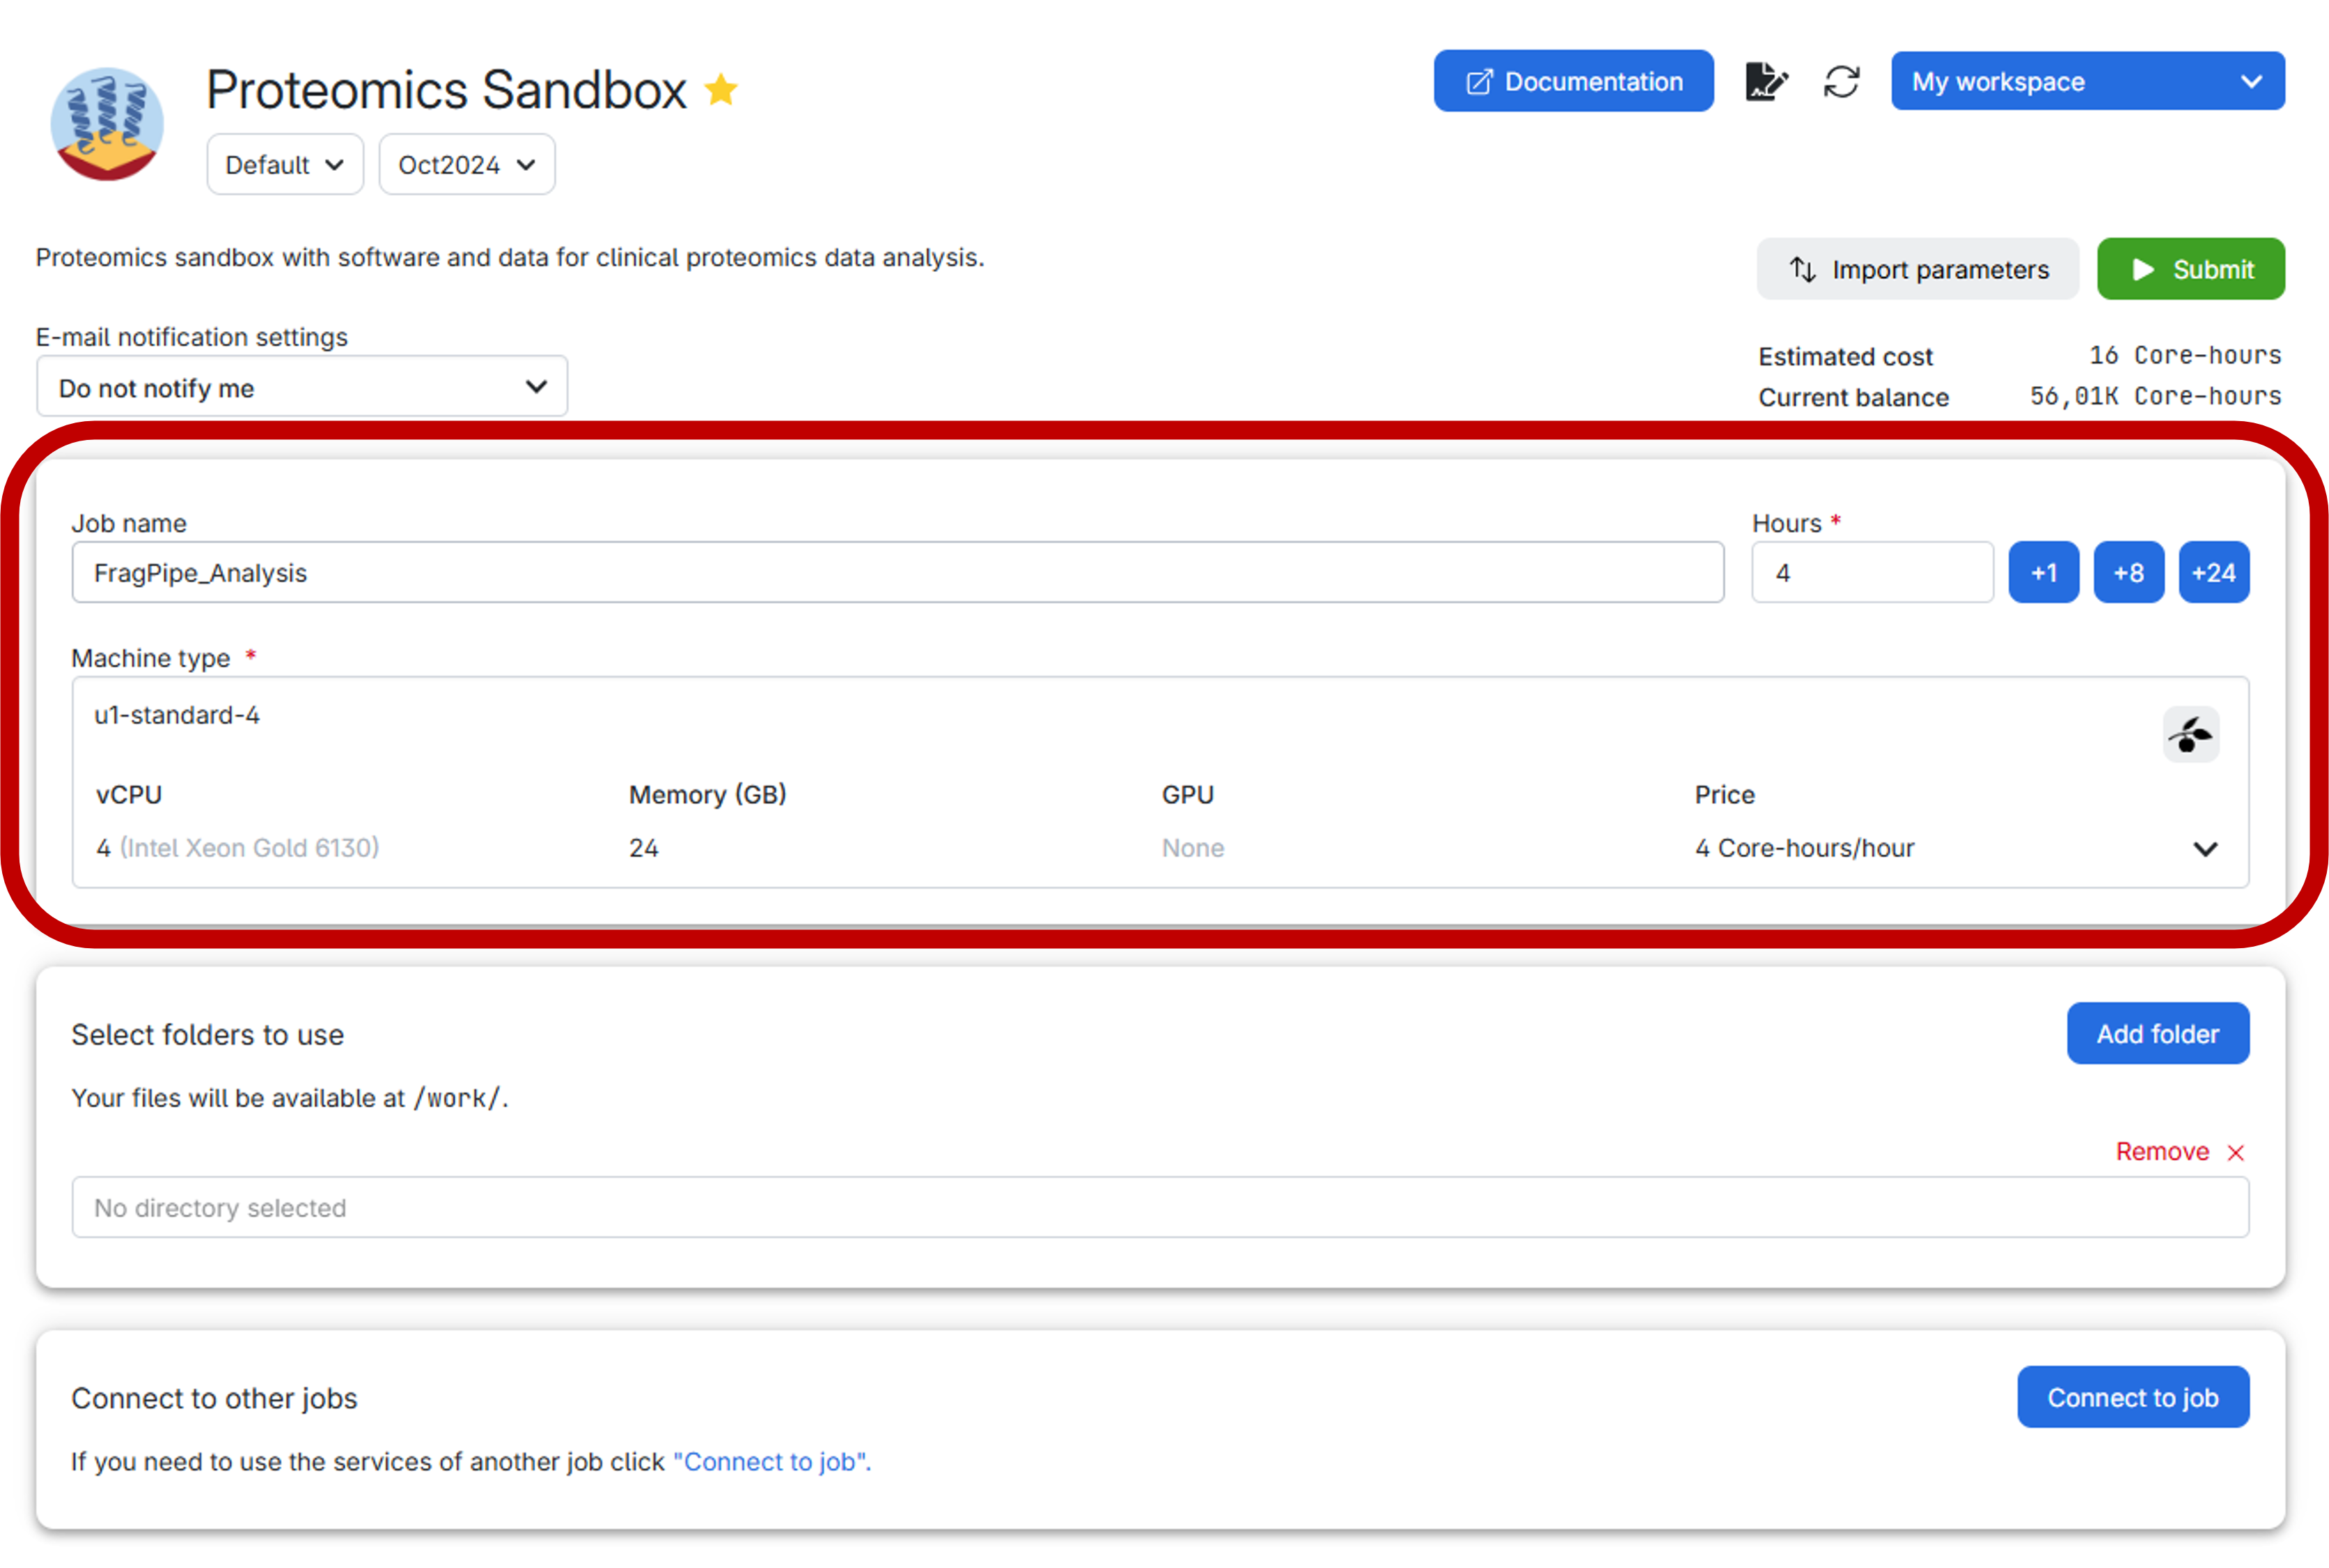
Now that we know what we want to do and why, it is time to start the Proteomics Sandbox application, or job. Simple analyses in FragPipe may only require 8 GB of RAM, while large-scale or complex analyses may require 24 GB of memory or more (FragPipe Documentation), which is why we will allocate 24 GB for this exercise.
You can access the Proteomics Sandbox Application on UCloud here.
In UCloud, the settings should look like this:
Before submitting the job, it is highly recommended to create a personal folder to securely store both your data and the results generated by FragPipe. Follow the step-by-step guide below for an effortless setup:
- First, click on the vibrant blue
Add folderbutton. - Next, select the exact directory you wish to mount, as illustrated below:
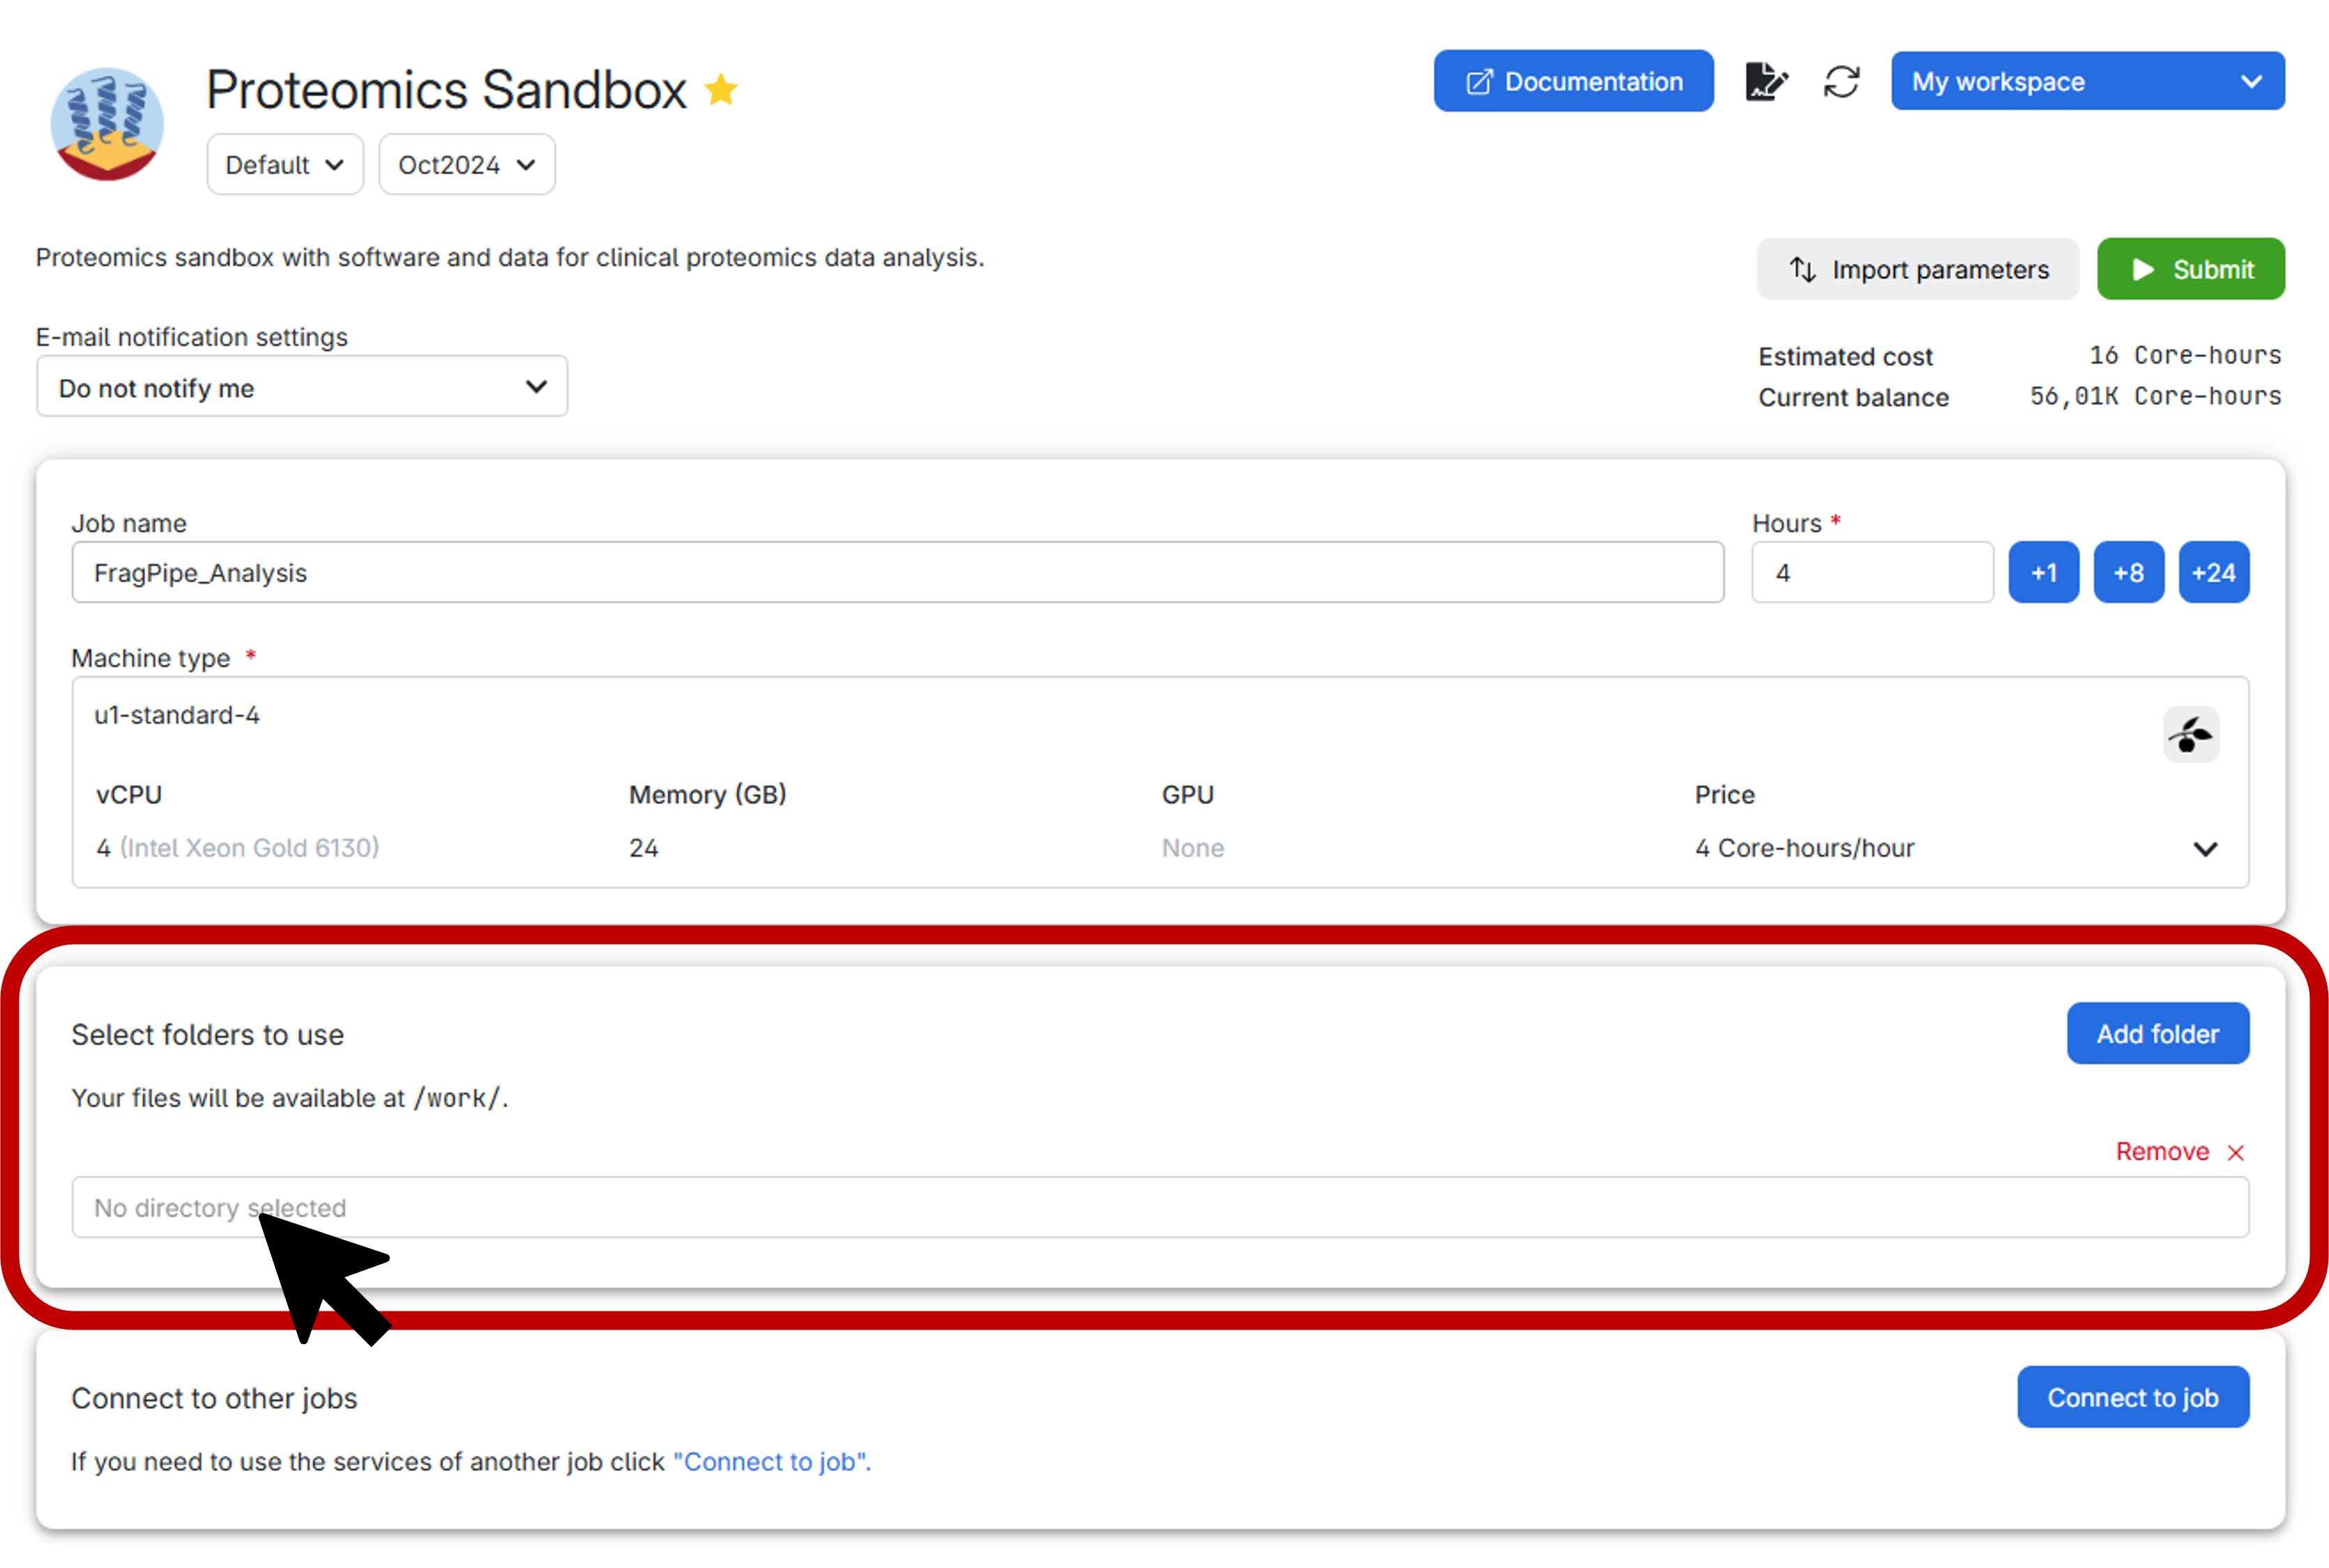
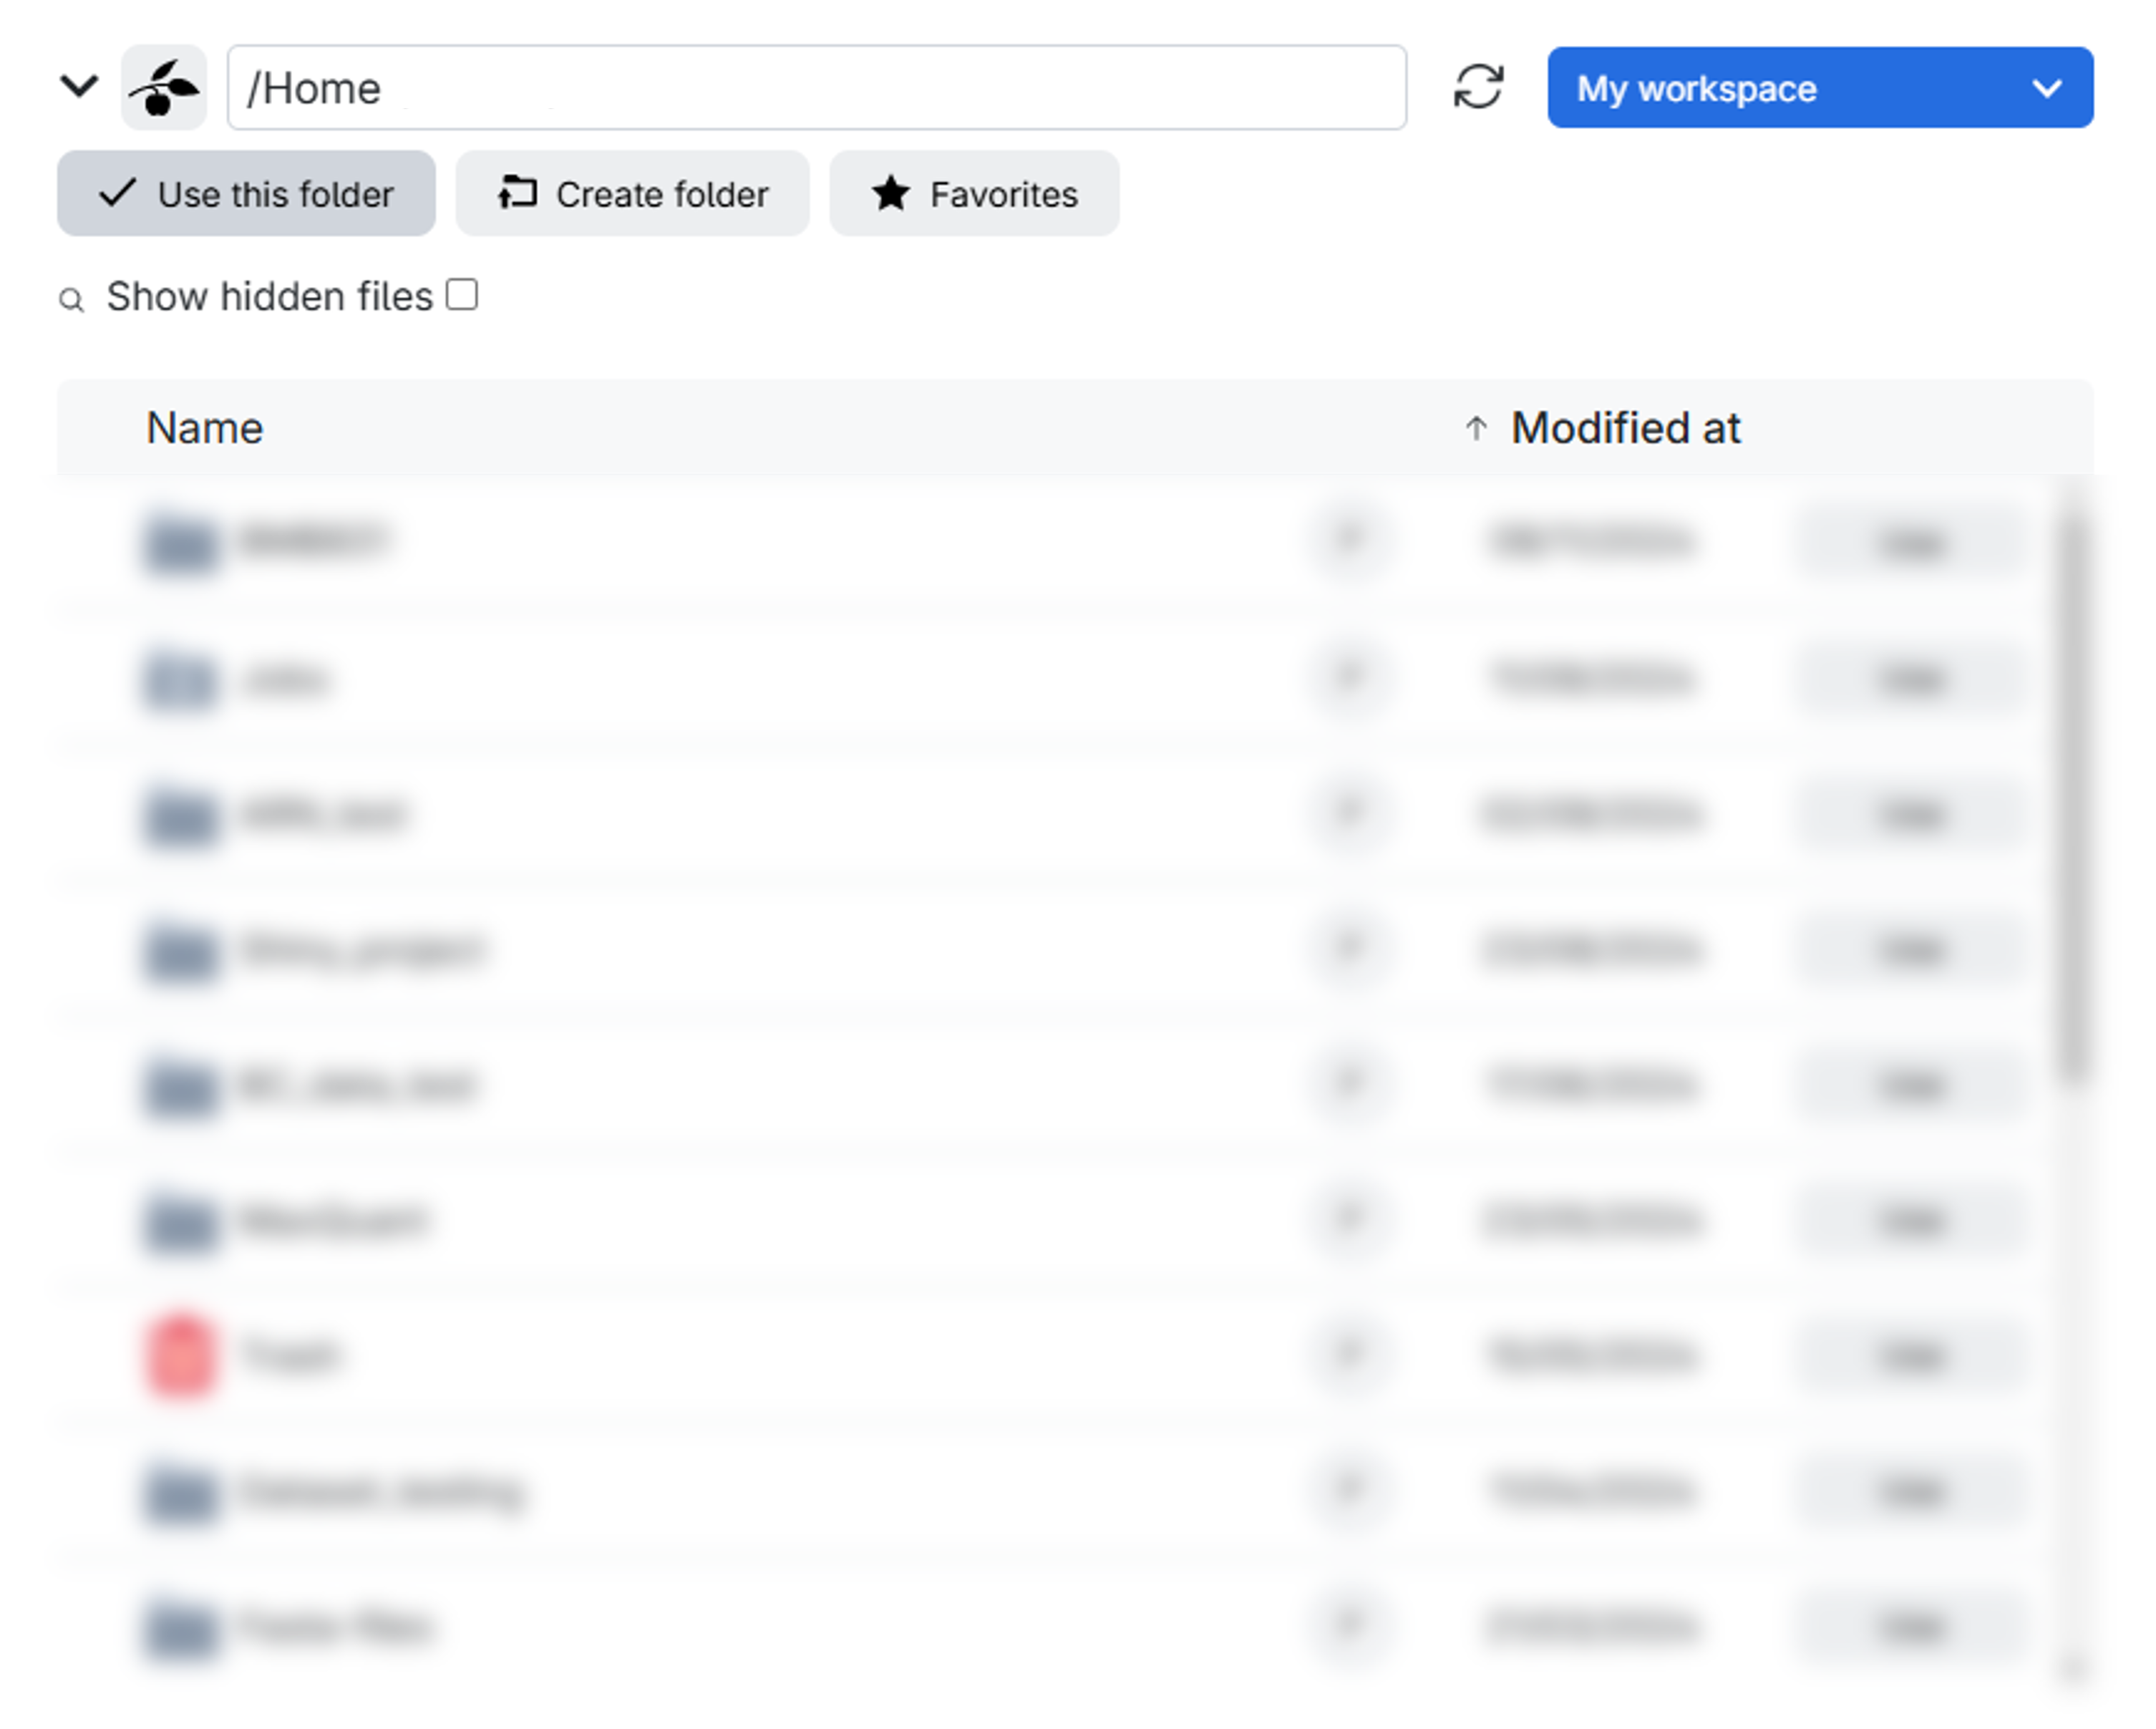
Upon clicking, a window similar to the one below will appear. Here, you have the option to either create a specific folder within a particular drive in the workspace you’ve chosen or simply select the entire drive itself. In this example, the drive is labeled as Home and the workspace is My workspace.
Make sure to allocate the right number of hours before submitting the job. If the time runs out, the job will be canceled, and all progress will be lost. However, you can always extend the job duration if more time is required after submission.
Time can pass quickly when working, so we recommend initially allocating 2 hours for the job. Now, we are ready to submit the job and launch the virtual environment of the Proteomics Sandbox Application.
Download Data from the Paper
Initially, we will need to download the paper’s data. For this exercise, we will only use one sample file from each Plex Set/Pool.
We will use the terminal in the virtual environment for downloading the data.
Now, we can access the FTP server where the data is located. You will need the server address from the correct FTP-server, which can be found on the site for the accession code PXD008841 in ProteomeXchange, previously visited. At the bottom of the page, you will find the FTP-server address where the data is stored.
Please locate the address.
Click on the Dataset FTP location link.
We now have access to the data stored on the FTP server. Please provide a brief description of the contents of the folder on the FTP server.
To download one sample file from each of the Plex Sets, we will need these URLs only:
https://storage.jpostdb.org/JPST000265/HJOS2U_20140410_TMTpool1_300ugIPG37-49_7of15ul_fr01.raw
https://storage.jpostdb.org/JPST000265/HJOS2U_20140410_TMTpool2_300ugIPG37-49_7of15ul_fr01.raw
https://storage.jpostdb.org/JPST000265/HJOSLO2U_QEHF_20150318_TMT_pool3_300ugIPG37-49_7of15ul_fr01.raw
https://storage.jpostdb.org/JPST000265/HJOSLO2U_QEHF_20150322_TMT_pool4_300ugIPG37-49_7of15ul_fr01.raw
https://storage.jpostdb.org/JPST000265/HJOSLO2U_QEHF_20150329_TMT_pool5_300ugIPG37-49_7of15ul_fr01.raw
You can also download this list here.
We recommend to open this material inside Proteomics Sandbox to be able to copy & paste or download the file directly into the environment.
After saving the list of URLs to a file named urls.txt, you can use the following command in the terminal. Make sure you are in the correct directory where urls.txt is located before running the code below to ensure the file is found correctly:
wget -i urls.txtIf you added your own private folder to the UCloud session, you can now move the data into that folder for better data management.
Next, we can launch FragPipe, which is located on the desktop. In this tutorial, we are using FragPipe version 22.0 within the October 2024 version of the Proteomics Sandbox application, available here.
Now that FragPipe is launched, we need to configure the settings before running the analysis. To assist you in setting up the settings in FragPipe, we have provided some guiding questions:
Getting started with FragPipe
Some of the information you will need in this section can be found in Supplementary Information to the study. Open the Supplementary Information and go to page 25, Supplementary Methods.
Go to the Workflow tab to set up the workflow for the analysis and import the data you just downloaded.
Which workflow should you select? Hint: What labeling method was used in the study?
How does the labeling method affect data processing?
Click Load workflow after you have selected the appropriate workflow.
Next, add your files by clicking on Add files and locating them in the designated folder for your raw files. Assign each file to a separate experiment by clicking Consecutive.
Go to the Quant (Isobaric) tab. Here, you need to provide annotations for TMT channels. Use the five pool annotations that you downloaded from this page. You will need to upload them to UCloud and specify the corresponding annotation file for each experiment in order.
Now, navigate to the Database tab. Here you can either download a new database file or browse for an existing one. In this case, we will download the latest database file by clicking the Download button in FragPipe. Be sure to add contaminants and decoys.
What is the purpose of the database file used in FragPipe, and why is it important?
Which organism should you choose when downloading the database file?
Describe the relationship between decoys and false discovery rate (FDR) by answering the following questions:
- What are decoys?
- Why should you include decoys?
- What role do decoys play in estimating the FDR?
Next, you can go to the MSFragger tab to adjust the parameter settings for the search and matching of the theoretical and experimental peptide spectra. The search parameters to be used are listed in Supplementary Methods.
What parameters did you set?
When all settings have been obtained, MSFragger should look something like this:
What is MSFragger? What does it do?
How does MSFragger operate?
You can also skip configuring MSFragger manually and just use this parameter file. You will need to upload it to UCloud and then load it on the “MSFragger” tab in FragPipe.
Finally, we can navigate to the Run tab and run the analysis. For that, we must choose an output directory for the results of the search made by FragPipe. Once you have adjusted that, you are ready to click on Run.
This process might take some time, so make sure that you still have enough hours allocated on your job on UCloud—otherwise, it will get terminated. Meanwhile, you can answer these questions:
What are your expectations regarding the output results? Consider the implications of the number of files provided for this search in your response.
Can the output from this analysis be reliably used for downstream applications given the limited number of sample files? Justify your answer.
What does it signify that the sample tissues have been fractionated as described in Supplementary Information?
- Outline the fractionation process utilized.
- Explain the study design associated with this research.
- In your opinion, will increasing the number of fractions improve proteome coverage? Justify your reasoning.
When the run in FragPipe is done, please locate the output results and get an overview of the output.
What types of output are generated by FragPipe?
For the downstream analysis, we will use the output from the list of combined proteins, which we will explore further in the following section.
Interpretation and Analysis of FragPipe Results
For this part, we will use output files based on a run with FragPipe using all sample files (i.e., 5x72 raw files). That file can be downloaded here???
Now, we will look at the output from FragPipe, where we will use the file named combined_proteins.tsv. Initially, we will explore the contents of the file locally. Therefore, you should download the file from UCloud and view it locally in a file editor such as Excel.
You can download the file by clicking on the file in your output directory in the UCloud interface, from where you can choose to download it.
Provide a concise overview of the table’s contents. What information is represented in the rows and columns?
For the downstream analysis, we will use the columns containing the TMT intensities across the proteins identified.
For that we will use OmicsQ, which is a toolkit for quantitative proteomics. OmicsQ can be used to facilitate the processing of quantitative data from Omics type experiments. Additionally, it also serves as an entrypoint for using apps like PolySTest [SCHWAMMLE20201396] for statistical testing, VSClust for clustering and ComplexBrowser for the investigation of the behavior of protein complexes.
Part 3: Data screening, multi-variate analysis and clustering
For the downstream workflow, we will follow the tutorial from the Jupyter Notebook embedded below.
You can work with the notebook both on your local machine and in the Proteomics Sandbox application.
To do so, download the repository containing the Jupyter Notebook by executing the following snippet in your terminal:
git clone https://github.com/veitveit/training-quantitative-proteomics.gitIn the Proteomics Sandbox application:
- Navigate to the
Applicationsmenu in the upper left corner.
- Go to
Development.
- Click on
Jupyter Notebook.
From there, you can select the notebook located in the directory:
/training-quantitative-proteomics/03_Cluster_Analysis/
This directory will be within the folder where you cloned the material in your terminal.
You can now proceed with the multivariate analysis of the material.
Personal Details
| Name | |
| Course/Program | |
| Date |