# Load libraries
library(DOSE)
library(pathview)
library(clusterProfiler)
library(org.Hs.eg.db)Functional Analysis for RNA-seq
Approximate time: 45 minutes
Learning Objectives:
- Identify popular functional analysis tools for over-representation analysis
clusterProfiler
We will be using clusterProfiler to perform over-representation analysis on GO terms associated with our list of significant genes. The tool takes as input a significant gene list and a background gene list and performs statistical enrichment analysis using hypergeometric testing. The basic arguments allow the user to select the appropriate organism and GO ontology (BP, CC, MF) to test.
Running clusterProfiler
To run clusterProfiler GO over-representation analysis, we wil use the Ensembl IDs, instead of the gene names, since the tool works a bit easier with the Ensembl IDs.
Then load the following libraries:
To perform the over-representation analysis, we need a list of background genes and a list of significant genes. For our background dataset we will use all genes tested for differential expression (all genes in our results table). For our significant gene list we will use genes with p-adjusted values less than 0.05 (we could include a fold change threshold too if we have many DE genes).
## Create background dataset for hypergeometric testing using all genes tested for significance in the results
allCont_genes <- dplyr::filter(res_ids, !is.na(gene)) %>%
  pull(gene) %>%
  as.character()

## Extract significant results
sigCont <- dplyr::filter(res_ids, padj < 0.05 & !is.na(gene))

sigCont_genes <- sigCont %>%
  pull(gene) %>%
  as.character()
Now we can perform the GO enrichment analysis and save the results:
## Run GO enrichment analysis
ego <- enrichGO(gene = sigCont_genes,
                universe = allCont_genes,
                keyType = "ENSEMBL",
                OrgDb = org.Hs.eg.db,
                ont = "BP",
                pAdjustMethod = "BH",
                qvalueCutoff = 0.05,
                readable = TRUE)
Let’s check the results:
## Output results from GO analysis to a table
cluster_summary <- data.frame(ego)
cluster_summarywrite.csv(cluster_summary, "../Results/clusterProfiler_Cont-Vamp.csv")Exercise 1
Create two new GO enrichment analyses one with UP and another for DOWN regulated genes for Control vs Vampirium.
Visualizing clusterProfiler results
clusterProfiler has a variety of options for viewing the over-represented GO terms. We will explore the dotplot, enrichment plot, and the category netplot.
The dotplot shows the number of genes associated with the first 50 terms (size) and the p-adjusted values for these terms (color). This plot displays the top 50 GO terms by gene ratio (# genes related to GO term / total number of sig genes), not p-adjusted value.
## Dotplot
dotplot(ego, showCategory=20)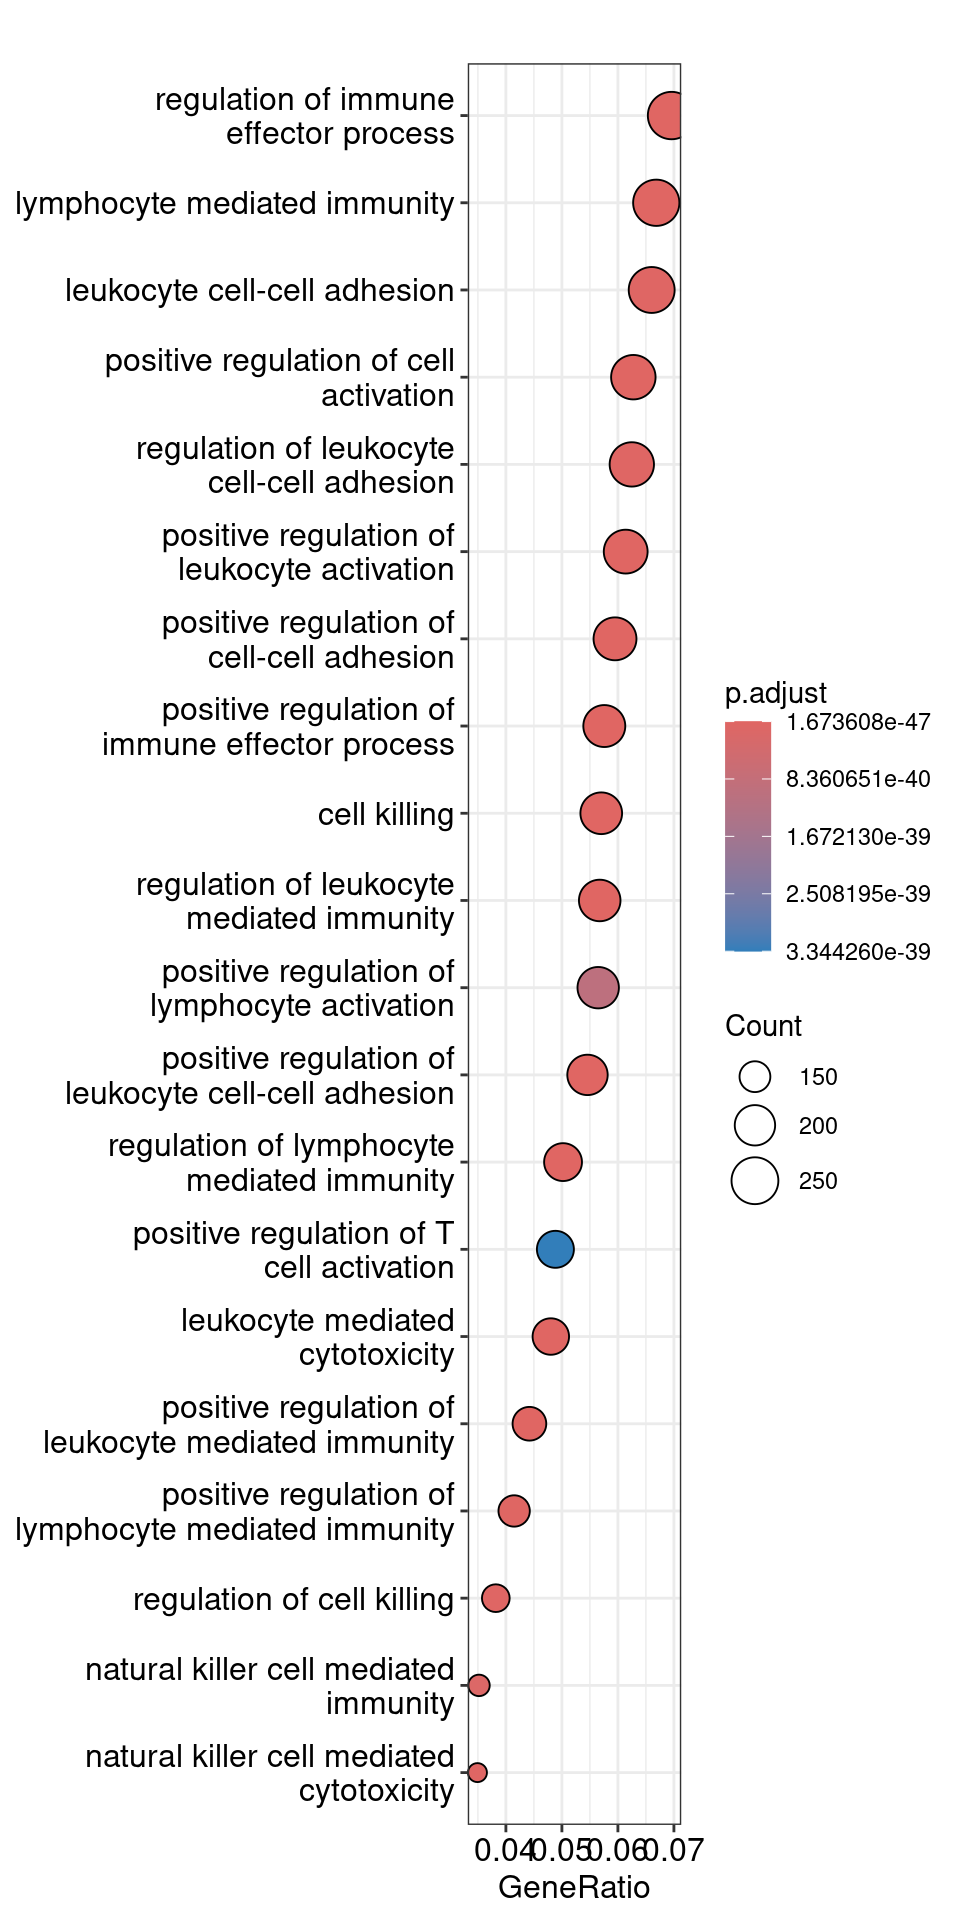
The next plot is the enrichment GO plot, which shows the relationship between the top 50 most significantly enriched GO terms (padj.), by grouping similar terms together. Before creating the plot, we will need to obtain the similarity between terms using the pairwise_termsim() function (instructions for emapplot). In the enrichment plot, the color represents the p-values relative to the other displayed terms (brighter red is more significant), and the size of the terms represents the number of genes that are significant from our list.
## Add similarity matrix to the termsim slot of enrichment result
ego <- enrichplot::pairwise_termsim(ego)
## Enrichmap clusters the 50 most significant (by padj) GO terms to visualize relationships between terms
emapplot(ego, showCategory = 50)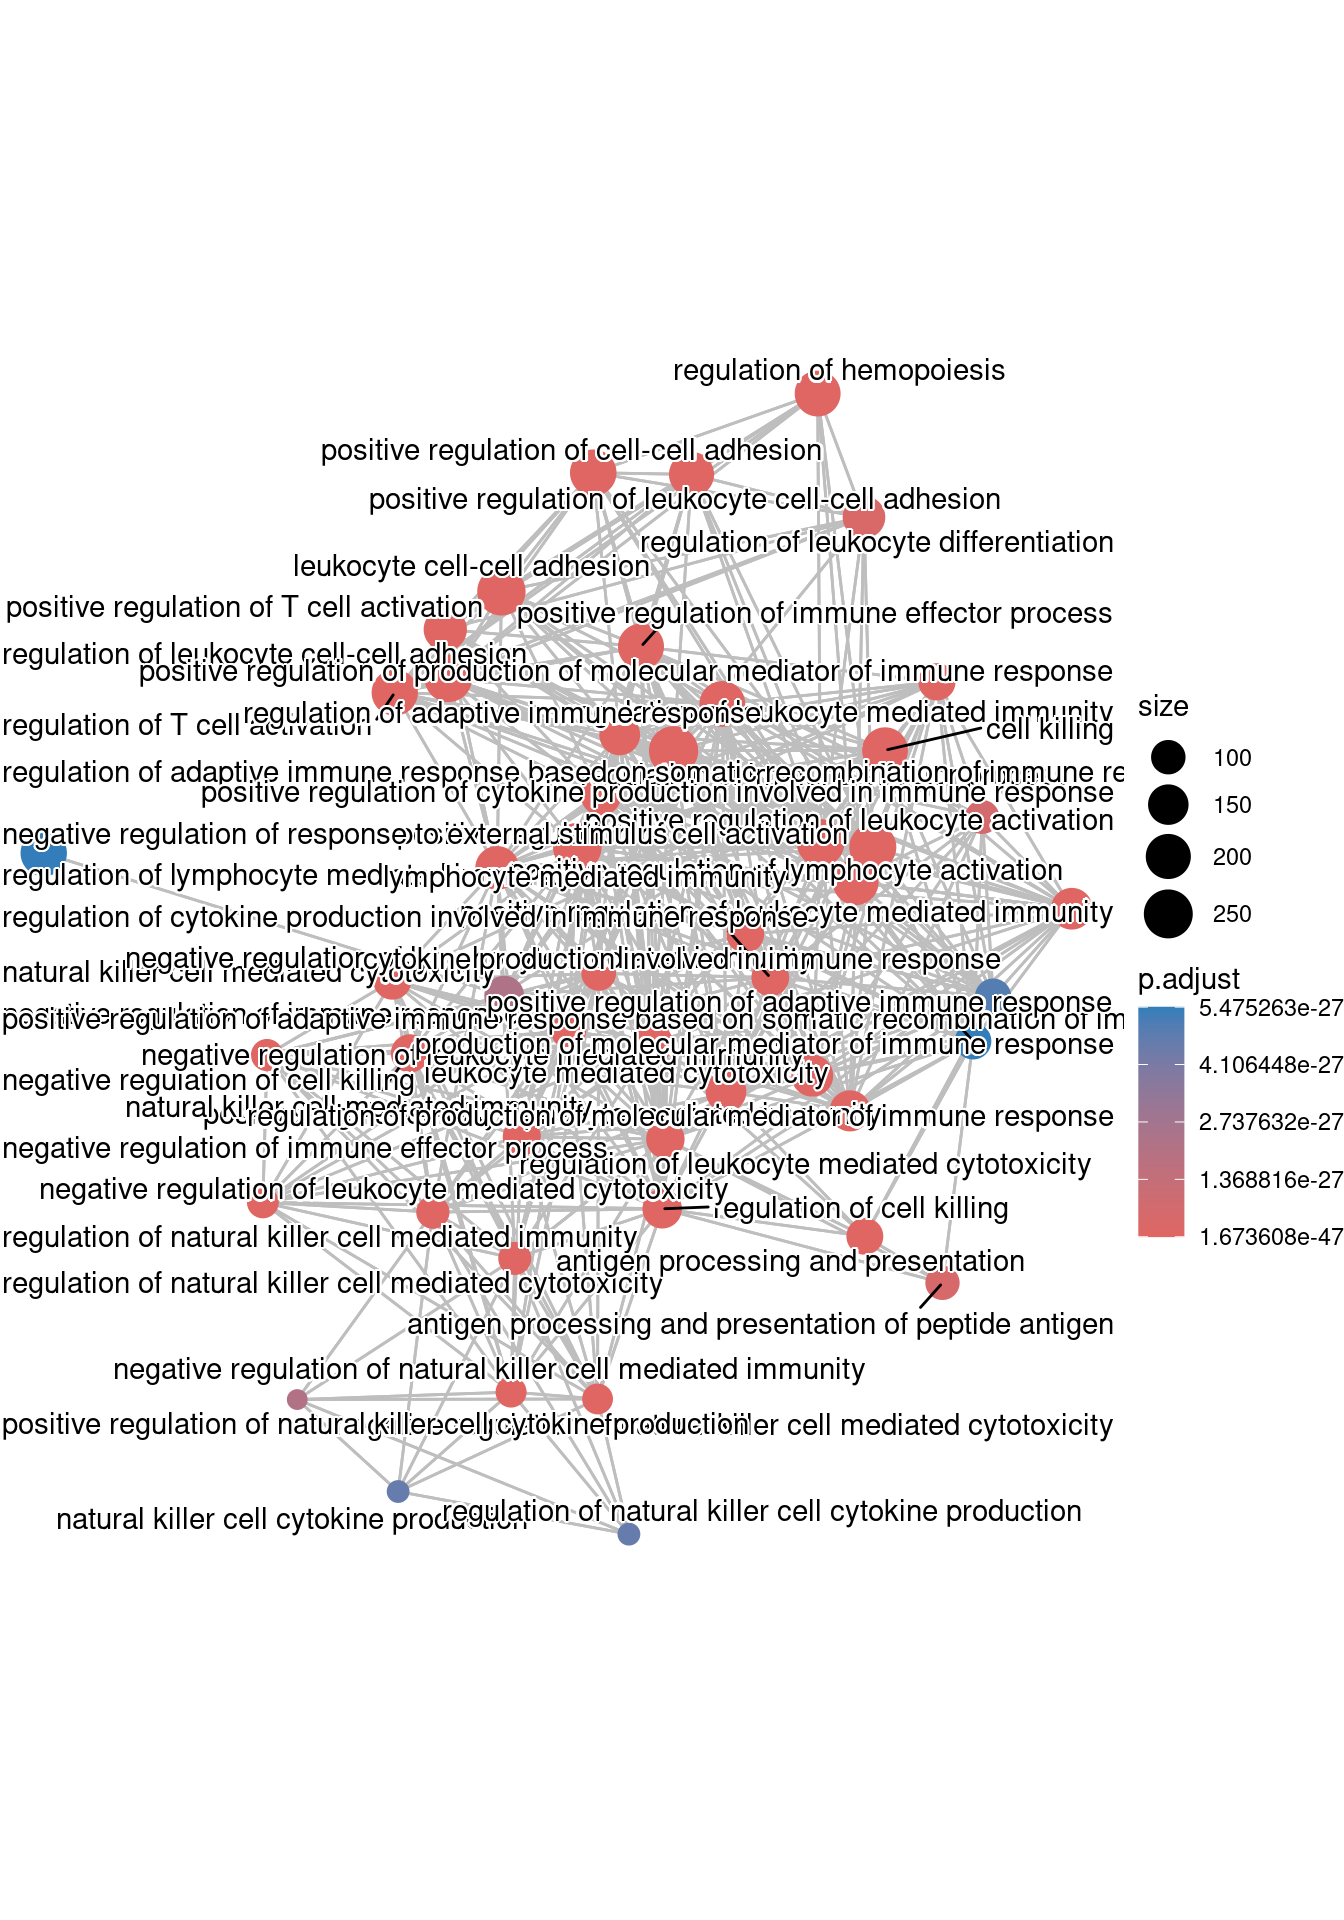
Finally, the category netplot shows the relationships between the genes associated with the top five most significant GO terms and the fold changes of the significant genes associated with these terms (color). The size of the GO terms reflects the pvalues of the terms, with the more significant terms being larger. This plot is particularly useful for hypothesis generation in identifying genes that may be important to several of the most affected processes.
## To color genes by log2 fold changes, we need to extract the log2 fold changes from our results table creating a named vector
OE_foldchanges <- sigCont$log2FoldChange

names(OE_foldchanges) <- sigCont$gene
## Cnetplot details the genes associated with one or more terms - by default gives the top 5 significant terms (by padj)
cnetplot(ego,
categorySize="pvalue",
showCategory = 5,
foldChange=OE_foldchanges,
vertex.label.font=6)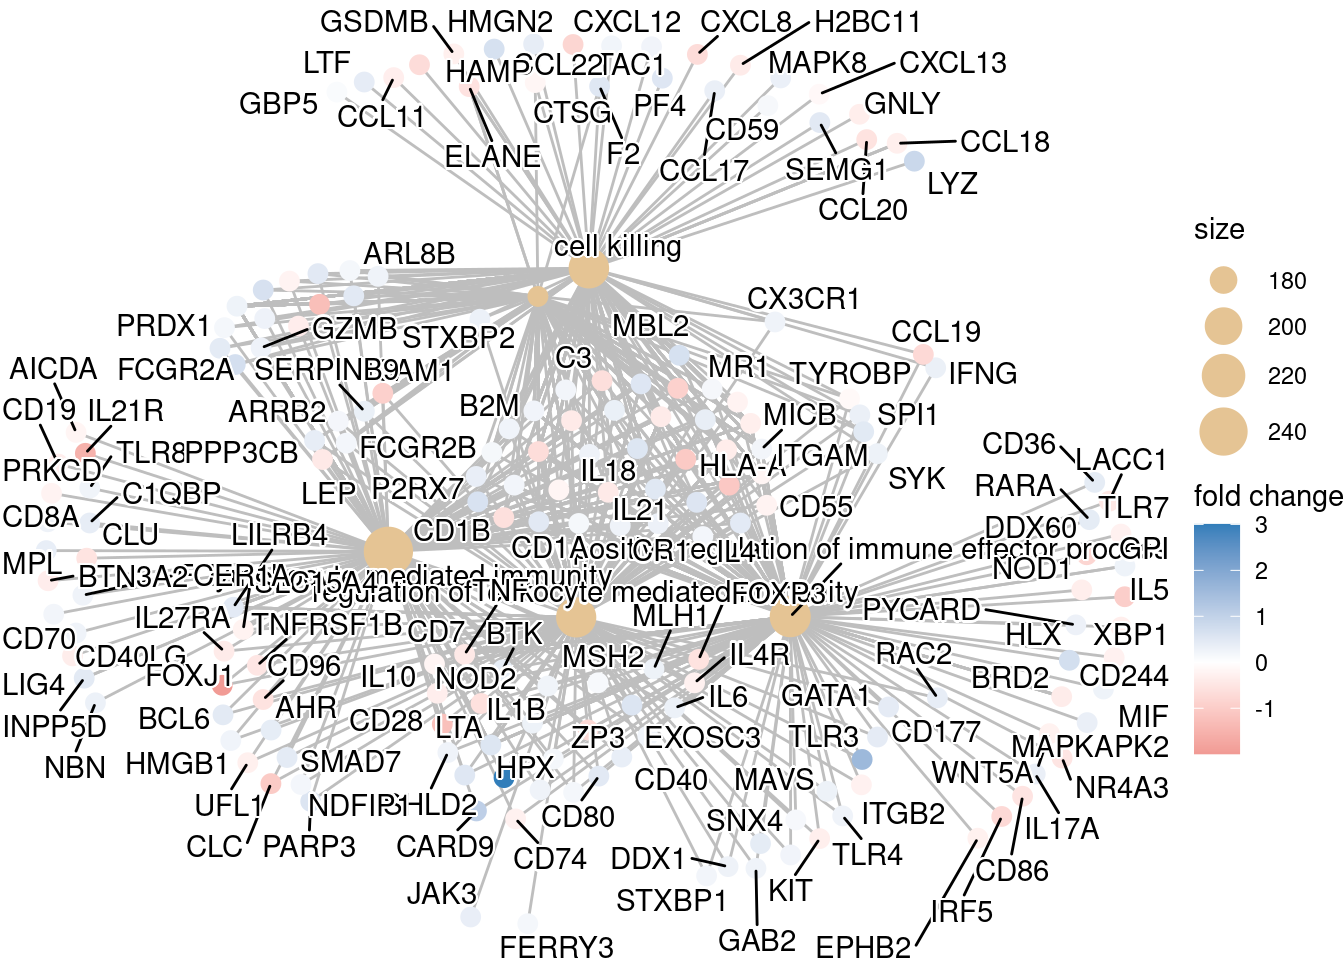
## If some of the high fold changes are getting drowned out due to a large range, you could set a maximum fold change value
OE_foldchanges <- ifelse(OE_foldchanges > 2, 2, OE_foldchanges)
OE_foldchanges <- ifelse(OE_foldchanges < -2, -2, OE_foldchanges)cnetplot(ego,
categorySize="pvalue",
showCategory = 5,
foldChange=OE_foldchanges,
vertex.label.font=6)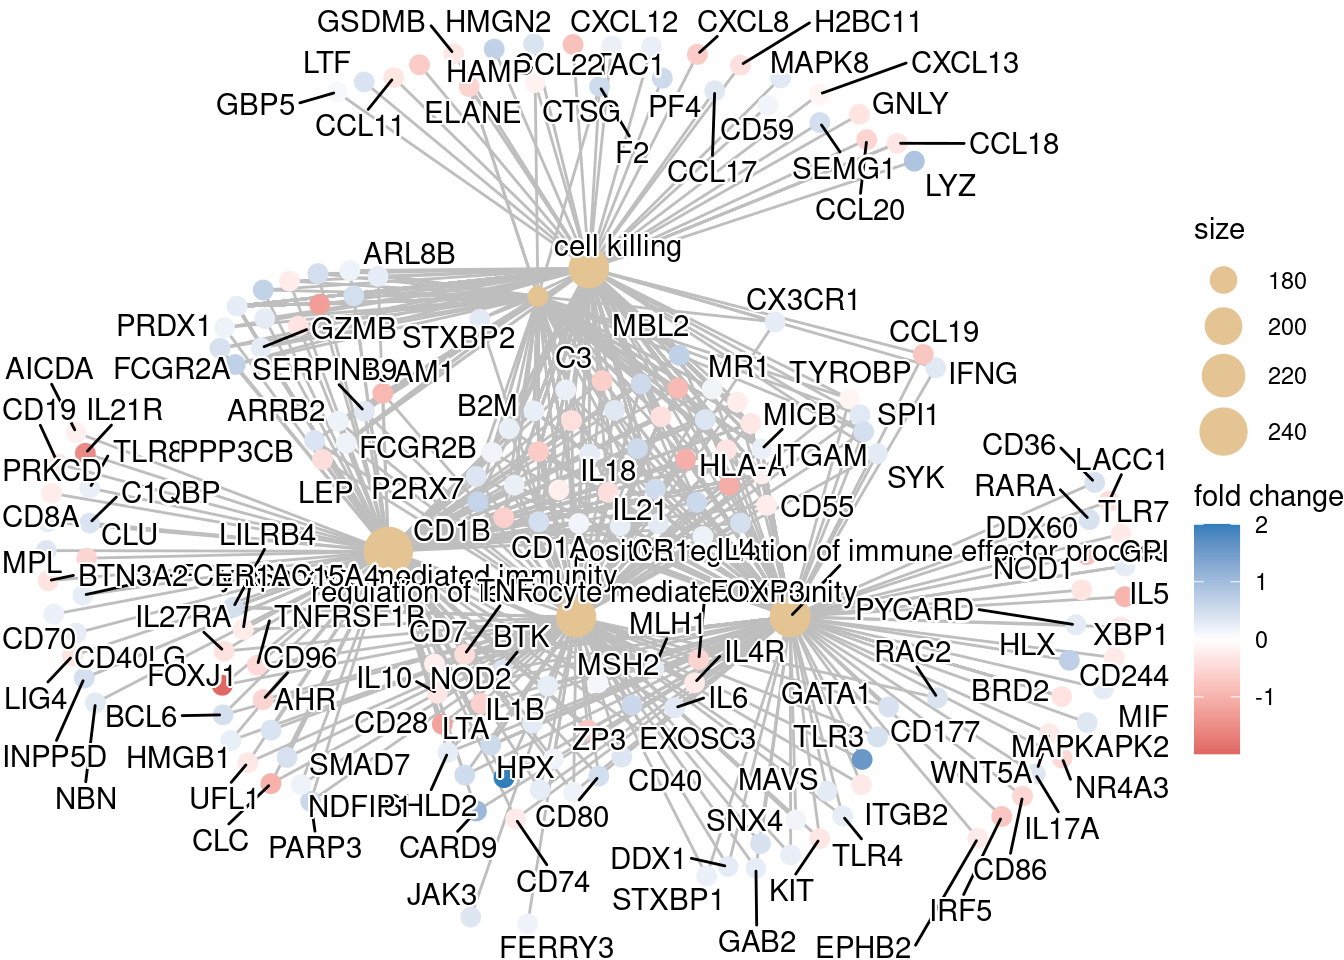
If you are interested in significant processes that are not among the top five, you can subset your ego dataset to only display these processes:
## Subsetting the ego results without overwriting original `ego` variable
ego2 <- ego

ego2@result <- ego@result[c(1,3,4,8,9),]

## Plotting terms of interest
cnetplot(ego2,
         categorySize="pvalue",
         foldChange=OE_foldchanges,
         showCategory = 5,
         vertex.label.font=6)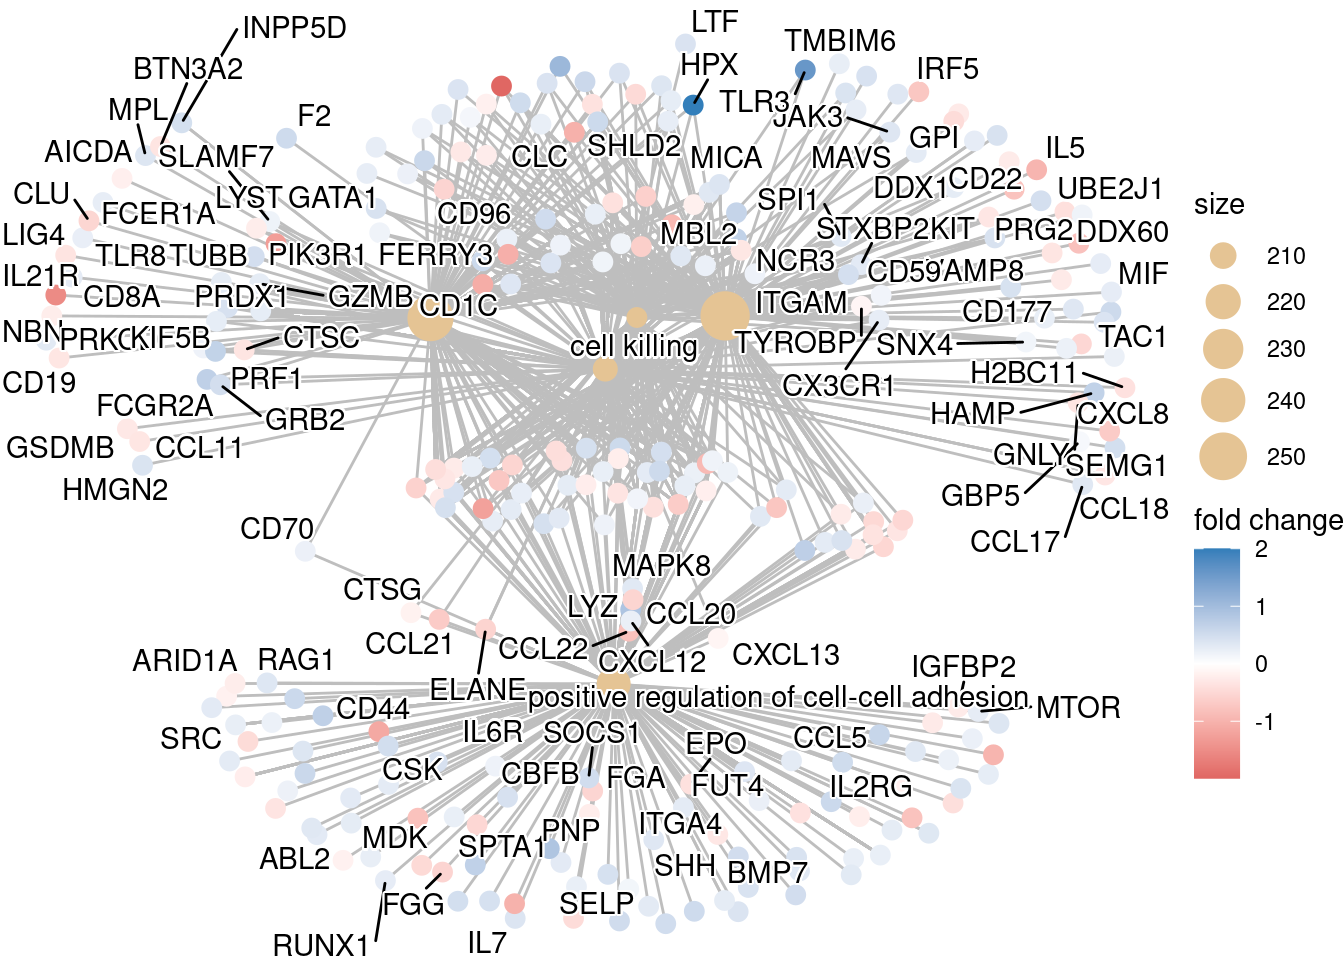
Exercise 2
Run a Disease Ontology (DO) overrepresentation analysis using the enrichDO() function. NOTE the arguments are very similar to the previous examples.
- Do you find anything interesting?
Exercise 3
Run an enrichment analysis on the results of the DEA for Garlicum vs Vampirium samples. Remember to use the annotated results!